Want to Know Where US GDP is Heading?
•
0 likes•145 views

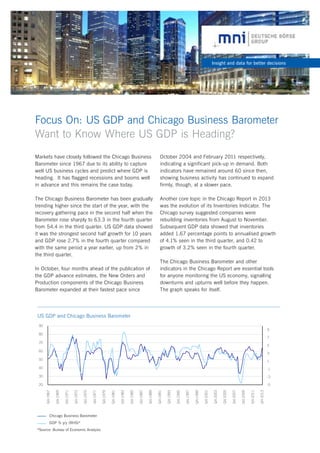
Markets have closely followed the Chicago Business Barometer since 1967 due to its ability to capture well US business cycles and predict where GDP is heading. It has flagged recessions and booms well in advance and this remains the case today.

Recommended
Recommended
More Related Content
What's hot
What's hot (20)
Viewers also liked
Viewers also liked (15)
Similar to Want to Know Where US GDP is Heading?
Similar to Want to Know Where US GDP is Heading? (20)
More from MNI Indicators | Deutsche Börse Group
More from MNI Indicators | Deutsche Börse Group (20)
Recently uploaded
Recently uploaded (20)
Want to Know Where US GDP is Heading?
- 1. Insight and data for better decisions Focus On: US GDP and Chicago Business Barometer Want to Know Where US GDP is Heading? Markets have closely followed the Chicago Business Barometer since 1967 due to its ability to capture well US business cycles and predict where GDP is heading. It has flagged recessions and booms well in advance and this remains the case today. October 2004 and February 2011 respectively, indicating a significant pick-up in demand. Both indicators have remained around 60 since then, showing business activity has continued to expand firmly, though, at a slower pace. The Chicago Business Barometer has been gradually trending higher since the start of the year, with the recovery gathering pace in the second half when the Barometer rose sharply to 63.3 in the fourth quarter from 54.4 in the third quarter. US GDP data showed it was the strongest second half growth for 10 years and GDP rose 2.7% in the fourth quarter compared with the same period a year earlier, up from 2% in the third quarter. Another core topic in the Chicago Report in 2013 was the evolution of its Inventories Indicator. The Chicago survey suggested companies were rebuilding inventories from August to November. Subsequent GDP data showed that inventories added 1.67 percentage points to annualised growth of 4.1% seen in the third quarter, and 0.42 to growth of 3.2% seen in the fourth quarter. In October, four months ahead of the publication of the GDP advance estimates, the New Orders and Production components of the Chicago Business Barometer expanded at their fastest pace since The Chicago Business Barometer and other indicators in the Chicago Report are essential tools for anyone monitoring the US economy, signalling downturns and upturns well before they happen. The graph speaks for itself. US GDP and Chicago Business Barometer 90 9 80 7 70 5 60 3 Chicago Business Barometer GDP % y/y (RHS)* *Source: Bureau of Economic Analysis Q4-2013 Q4-2011 Q4-2009 Q4-2007 Q4-2005 Q4-2003 Q4-2001 Q4-1999 Q4-1997 Q4-1995 Q4-1993 Q4-1991 Q4-1989 Q4-1987 Q4-1985 Q4-1983 Q4-1981 Q4-1979 Q4-1977 -5 Q4-1975 20 Q4-1973 -3 Q4-1971 -1 30 Q4-1969 1 40 Q4-1967 50
- 2. 2 MNI Indicators - Focus On - July 2013 MNI Indicators Insight and data for better decisions Editorial Content: Philip Uglow, Chief Economist Lorena Castellanos, Economist About MNI Indicators MNI Indicators offers unique macro-economic data and insight to businesses and the investment community. We produce data and intelligence that is unbiased, pertinent and responsive. Our data moves markets. MNI Indicators specialises in business and consumer focused macro-economic reports that give our customers the ability to make timely and relevant decisions. We strive to provide up-to-date information on business and consumer confidence on the economy. MNI Indicators publishes data on a monthly basis. Our indicators are based on a unique and proprietary methodology and are designed to present an advance picture of the economic landscape as perceived by businesses and consumers every month. Our monthly reports explore attitudes, perspectives and confidence across different countries and regions. They deliver in-depth analysis, highlight changing patterns and how these can affect potential developments in business and consumer activities. MNI Indicators is part of MNI, a leading provider of news and intelligence. MNI is a wholly owned subsidiary of Deutsche Börse Group, one of the largest worldwide exchange organisations. For more information: Customer Support support@mni-indicators.com +44 (0)20 7862 7444