1. REPUBLIC OF RWANDA
MINISTRY OF EDUCATION
HIGHER INSTITUTE OF AGRICULTURE AND ANIMAL
HUSBANDRY
FACULTY OF AGRICULTURE AND RURAL DEVELOPMENT
DEPARTMENT OF RURAL DEVELOPMENT AND AGRIBUSINESS
Presented by: MANIRAHO Leonidas
Dissertation submitted to the Faculty of Agriculture
and Rural Development for the partial fulfilment of
The requirements for Bachelor’s degree (Ao) in
Supervisor: Rural Development and Agribusiness.
MULINGA Narcisse (MSc.)
Rubilizi, August, 2013
IMPACT ASSESSMENT OF FERTILIZER SUBSIDY
PROGRAM ON MAIZE FARMERS.
A CASE STUDY OF VOUCHER PROGRAM IN
GATARAGA SECTOR, MUSANZE DISTRICT.
2. i
DECLARATION
I, LEONIDAS MANIRAHO hereby declare that this dissertation entitled ‘impact
assessment of fertilizer subsidy on Maize farmers A case study of voucher program in
Gataraga Sector, Musanze District is the product of my original work, that it has not
been submitted before for any degree or examination in any other University or
Higher Learning Institutions, and that all the sources I have used or quoted have been
indicated and acknowledged as complete references.
Signed………………………………… Date……………………………
MANIRAHO Leonidas
Declaration from the Supervisor
This work has been submitted for examination with my approval as Supervisor
Signed………………………………… Date……………………………
MULINGA Narcisse (MSc.)
4. iii
ACKNOWLEDMENT
First and foremost, I thank the almighty God for his abundant blessings and protection during
my studies and preparation of this work.
Without contributions made by other people, the process of producing this research would
certainly not exist. I would like to extend my sincere thanks to all of them. At the top of the
list is my supervisor, Mulinga Narcisse Msc. I was truly blessed to have an extraordinary
supervisor, with his patience, guidance, critical comments and advice at every stage of the
work helped in shaping, focussing and analysing the study.
I feel highly indebted to the Higher Institute of Agriculture and Animal Husbandry, ISAE,
for making available an excellent environment for pursuing my studies.
My sincere gratitude goes to the all staff and all lecturers of Rural Development and
Agribusiness Department for their kind collaboration. This is the results of their patience.
I would like to make special note of all my colleagues, for their encouragement, support and
contributions throughout the study period.
No words can express my feelings, but thanks a lot for your constant encouragement, support,
advice and contributions.
Last but not least, thanks to others who, in one way or another made my studies successful.
May God bless you.
Leonidas MANIRAHO
5. iv
ABSTRACT
This study examines the impact assessment of fertilizer subsidy being provided under
the voucher program GATARAGA Sector, MUSANZE District to assess whether the
voucher program implemented for 3 years ago has contributed to the welfare of maize
farmers. The study was also aimed at finding out how maize farmers pay the
remaining part of fertilizers subsidy. To determine the constraints that maize farmers
are facing under voucher program through fertilizers subsidy.
The study was carried out through questionnaire to collect primary data assisted by
SPSS program for test statistics to the use the fertilizers subsidy and Constraints
counted during the period of study, Paired Samples Test comparison for Maize range
production before and after implementation of fertilizers subsidy, Friedman Test to
the use the maize production income.
The data was obtained by administering four sets of research instruments: the
questionnaire, the semi-structured interview, observation and desk review. In total 66
respondents participated in the research.
The findings show that despite some challenges, the nature of the subsidy and the
way the program is organized and implemented has significantly improved the
welfare of maize farmers According to the Contribution of voucher program toward
the maize farmers, the finds shows that most beneficiaries of the program their
production have been increased from 10kg to above 750kg.as shown by Paired
Samples Test comparison for Maze range production before and after implementation
of fertilizers subsidy at 95% confidential interval. Income from maize production
helped maize farmers to pay 50% of fertilizer subsidy at the level of 81.8%
In conclusion, the findings indicate that the voucher program is necessary and
sufficient program for boosting welfare of maize farmers: Fertilizer subsidies have a
positive effect on maize production Compared before and after the program. The
application of voucher fertilizer is more like times (×10) the yield, as
recommendation to reduce registration process, respect agriculture season, the
farmers should be mobilized to form the cooperatives, consider post-harvest
technology.
6. v
RESUME
Cette étude porte sur l'évaluation de l'impact de la subvention desengraisétantprévus
Dans le cadre du programme sectoriel GATARAGA de bons, District de Musanze de
déterminer si le programme de coupons mis en œuvre pour il ya 3 ans a contribué
aubien-être des producteurs de maïs. L'étude visait également à savoir comment les
producteurs de maïs payer la partie restante de la subvention des engrais. Pour
déterminer les contraintes que les producteurs de maïs sont confrontés au titre du
programme de coupons par les engrais subvention.
L'étude a été réalisée par questionnaire pour recueillir des données primaires aidées
par le programme SPSS pour les statistiques de test pour l'utilisation de la subvention
des engrais et contraintes comptabilisés au cours de la période d'étude, jumelés
comparaison d'essai des échantillons pour la production de gamme maïs avant et après
la mise en œuvre des engrais subvention, Friedman Test pour l'utilisation, le revendue
la production de maïs. Les données ont été obtenues par l'administration de quatre
ensembles d'instruments de recherche: le questionnaire, l'entretien semi-structuré,
l’observation et l'étude documentaire. Au total, 66 répondants ont participé à la
recherche.
Les résultats montrent que, malgré certaines difficultés, la nature de la subvention et
de la façon dont le programme est organisé et mis en œuvre a sensiblement amélioré
le bien-être des producteurs de maïs fonction de la contribution du programme de
bons envers les producteurs de maïs, les trouvailles montre que la plupart des
bénéficiaires de l' programmer leur production a été augmentée de 10 kg pour 750kg.
indiquées par paires comparaison d'essai des échantillons pour la production de
gamme de Maze, avant et après la mise en œuvre des engrais subvention à 95%
intervalle confidentiel, les producteurs de maïs des stratégies utilisées pour verser la
subvention des engrais, 81,8% qu'ils payer 50% de la subvention des engrais en
utilisant des revenus provenant de la production de maïs après la récolte.
Pour conclure, les résultats indiquent que le programme de coupons est nécessaire et
suffisante programme pour stimuler le bien-être des producteurs de maïs: Les
subventions aux engrais ont un effet positif sur la production de maïs comparaison
avant et après le programme. L'application d'engrais bon ressemble plus 10 fois, le
rendement, nous avons donc recommandé de réduire les processus d'enregistrement,
respecter la saison agricole, les agriculteurs devraient être mobilisés pour former des
coopératives, de considérer la technologie post-récolte.
7. vi
TABLE OF CONTENT
DECLARATION ............................................................................................................i
DEDICATION...............................................................................................................ii
ACKNOWLEDMENT ................................................................................................ iii
ABSTRACT..................................................................................................................iv
RESUME .......................................................................................................................v
LIST OF TABLES AND FIGURES.............................................................................ix
LIST OF APPENDICE.................................................................................................xi
LIST OF ABBREVIATIONS AND ACRONYMS ....................................................xii
CHAPTER I. GENERAL INTRODUCTION...............................................................1
1.1. Problem statement...............................................................................................2
1.2. Objectives of the research project.......................................................................4
1.2.1 Main objective ..............................................................................................4
1.2.2. Specific objectives .......................................................................................4
1.2.3 Research Question ........................................................................................4
1.3. Interest of the study.............................................................................................4
1.4. Study limitation...................................................................................................4
1.5. Significance of the research................................................................................5
CHAPTER II. LITERATURE REVIEW ......................................................................6
2.1. INTRODUCTION ..............................................................................................6
2.2. AGRICULTURE IN RWANDA........................................................................6
2.2.1. Sector objectives ..........................................................................................6
2.2.2. The strength of agricultural sector in Rwanda.............................................6
2.2.3. Soil fertility decline in Rwanda ...................................................................6
2.2.4. The effects of soil fertility decline...............................................................7
2.3. AGRICULTURAL INPUTS ACCESS ..............................................................7
2.3.1. Low use of inputs.........................................................................................7
2.4. VOUCHER PROGRAM ....................................................................................8
2.4.1. Definition.....................................................................................................8
2.5. Background on Crop intensification program (CIP) and fertilizer distribution11
2.5.1. Distribution of improved inputs.................................................................11
2.5.2. Distribution of fertilizers and voucher program in Rwanda ......................11
2.5.3. Voucher program in summary ...................................................................12
2.5.4. Implication of fertilizer voucher program on smallholder farmers ...........13
8. vii
CHAPTER THREE: RESEARCH METHODOLOGY ..............................................14
3.1. Site selection and description............................................................................14
3.1.1. Site selection..............................................................................................14
3.1.2. Site description...........................................................................................14
3.1.3.Climate and rainfall in GATARAGA Sector..............................................14
3.1.4 Relief of GATARAGA sector ....................................................................14
3.1.5 Population ...................................................................................................15
3.1.6 Flora and Fauna...........................................................................................15
3.1.7 Socio-economic characteristics of GATARAGA Sector............................15
3.2. Target population..............................................................................................15
3.2.1. Sampling procedure ...................................................................................16
3.2.2. Sampling at the cell level...........................................................................17
3.3. Data collection, entry and analysis ...................................................................17
3.3.1. Interviews...................................................................................................17
3.3.3Questionnaires..............................................................................................18
3.3.4 Desk review ................................................................................................18
3.3.5 Data collection ............................................................................................18
3.3.6Primary data.................................................................................................18
3.3.7 Secondary data............................................................................................18
3.4.Data analysis ......................................................................................................19
3.5. Data interpretation ............................................................................................19
CHAPTER IV. PRESENTATION, .............................................................................20
ANALYSIS AND DISCUSSION OF THE FINDINGS.............................................20
4.1. Demographic Characteristics of Respondents: .................................................20
4.1.1. Gender distribution ....................................................................................20
4.1.2 Age..............................................................................................................21
4.1.3Educational level..........................................................................................21
4.1.4 Martial status...............................................................................................22
4.1.5The total size of cultivated area ...................................................................22
4.1.6 Source of income ........................................................................................23
4.1.7. The years experience of being in maize farming.......................................23
4.2 Contribution of voucher program toward the maize farmers.............................24
4.2.1. Kind of subsidy from Voucher program....................................................24
4.2.2 Working with Voucher program for fertilizers subsidy.............................24
9. viii
4.2.3. Company has the contract for providing the input subsidies.....................25
4.2.4. Conditions required for getting input subsidies.........................................26
4.2.5. Use the fertilizers subsidy..........................................................................27
4.2.6 Maize range production before and after implementation of fertilizers
subsidy .................................................................................................................27
4.2.7. Use of maize output ...................................................................................28
4.2.8. Maize unit price .........................................................................................29
4.2.9 The available market for maize production ................................................29
4.2.10 Use the maize production income.............................................................30
4.2.11. The savings of maize farmers ..................................................................30
Source: Primary Data...............................................................................................31
4.3 Strategies do maize farmers used to pay the fertilizers subsidy ........................31
4.3.1. Estimation of the quantity needed to maize production.............................31
4.3.2. Fixation of the unit cost of fertilizers given...............................................31
4.3.3 Period of payment.......................................................................................32
4.3.4. Source of money to pay fertilizer...............................................................32
4.3.5. Payment agreement....................................................................................33
4.3.6Voucher program appreciation ....................................................................33
4.3.7 Constraints counted during the period of study..........................................34
4.4. Farmers perceptions..........................................................................................35
4.5. Discussion.........................................................................................................35
CHAPTER V: CONCLUSION AND RECOMMENDATION ..................................38
5.1 CONCLUSION..................................................................................................38
5.2 RECOMMENDATIONS...................................................................................39
Reference .....................................................................................................................40
APPENDICE................................................................................................................42
10. ix
LIST OF TABLES AND FIGURES
TABLES
TABLE 1: DETERMINATION OF THE REPRESENTATIVE SAMPLE FOR FOUR CELLS OF
GATARAGA SECTOR..............................................................................................17
TABLE 2: THE SOURCE OF INCOME ................................................................................23
TABLE 3: THE YEARS EXPERIENCE OF BEING IN MAIZE FARMING ..................................23
TABLE 4: EXPERIENCE IN WORKING WITH VOUCHER PROGRAM ....................................24
TABLE 5 : COMPANY HAS THE CONTRACT FOR PROVIDING THE INPUT SUBSIDIES..........25
TABLE 6 : FRIEDMAN TEST FOR THE USE OF FERTILIZER SUBSIDY .................................27
TABLE 7:PAIRED SAMPLES TEST COMPARISON FOR MAIZE RANGE PRODUCTION BEFORE
AND AFTER IMPLEMENTATION OF FERTILIZERS SUBSIDY: ......................................28
TABLE 8: MAIZE UNIT PRICE .........................................................................................29
TABLE 9: THE AVAILABLE MARKET FOR MAIZE PRODUCTION .......................................29
TABLE 10: USE THE MAIZE PRODUCTION INCOME .........................................................30
TABLE 11:SAVINGS OF MAIZE FARMERS .......................................................................31
TABLE 12 : ESTIMATION OF THE QUANTITY NEEDED TO MAIZE PRODUCTION ................31
TABLE 13: FIXATION OF THE UNIT COST OF FERTILIZERS GIVEN....................................32
TABLE 14.PERIOD OF PAYMENT ....................................................................................32
TABLE 15: SOURCE OF MONEY TO PAY FERTILIZER .......................................................33
TABLE 16: PAYMENT AGREEMENT ................................................................................33
TABLE 17: VOUCHER PROGRAM APPRECIATION ............................................................34
11. x
FIGURES
FIGURE 1: GENDER DISTRIBUTION.................................................................................20
FIGURE 2: AGE..............................................................................................................21
FIGURE 3: EDUCATIONAL LEVEL...................................................................................21
FIGURE 4: MARTIAL STATUS .........................................................................................22
FIGURE 5: CULTIVATED AREA RANGES IN ACRE ............................................................22
FIGURE 6: CONDITIONS REQUIRED FOR GETTING INPUT SUBSIDIES................................26
FIGURE 7: USE OF MAIZE OUTPUT .................................................................................28
FIGURE 8: CONSTRAINTS COUNTED DURING THE PERIOD OF STUDY ..............................35
13. xii
LIST OF ABBREVIATIONS AND ACRONYMS
CIP :Crop Intensification Program
GDP :Gross Domestic Product
MINICOM :Ministry of Commerce and Trade
MINAGRI :Ministry of Agriculture and Animal Resource
PSTAII :Plan Stratégique de la Transformation Agricole
GOR :Government of Rwanda
MINECOFINE: Ministry of Finance and Economic Planning
RAB : Rwanda Agriculture Board
ISAE :Higher Institute of Agriculture and Animal Husbandry.
14. 1
CHAPTER I. GENERAL INTRODUCTION
Rwanda is a landlocked country situated in central or East Africa. Also known as ’the
land of a thousand hills” with land area of 26 338 square kilometers with a high
population density of 10,537,222 (NISR, 2012 population and housing census
provisonal reports, 2012) . The country’s economy is primarily subsistence based, the
Services sector contributed by 43 percent of GDP compared to 34 percent by the
Agriculture sector. The remainder or 17 percent was attributable to the Industry sector
and 6 percent as adjustment (NISR, 2012). Today, the agricultural population is
estimated to be a little less than 80% of the total population. The sector meets 90% of
the national food needs and generates more than 70% of the country’s export
revenues. (RDB, 2013)
Agriculture in Rwanda is dominated by small-scale, subsistence-oriented family
farming units. Approximately 1.4 million rural households depend on agriculture as
their main livelihood source. These households produce a range of food crops, with
approximately 66 percent of production destined for home consumption. The
remaining 34 percent of production finds its way to local markets. Crops are produced
mainly under rain fed conditions using mostly family labor and few or no purchased
inputs (Michel, 2008)
Increasing agricultural productivity will allow farmers to move from subsistence
agriculture to a more market oriented production strategy. Most small holder farmers’
lack the financial resources required to purchase modern inputs such as mineral
fertilizers and improved seeds required for improved productivity (MINAGRI, 2007).
Since increasing productivity requires the use of modern inputs, the government of
Rwanda adopted the inputs subsidies program which was initiated by the Ministry of
Agriculture in September 2007, for farmers to pay a half price of the initial amount to
pay for fertilizers from factory.
A survey was conducted within 2013B season in GATARAGA Sector, MUSANZE
District.
15. 2
1.1. Problem statement
One of the global objectives of agriculture policy is to create favorable conditions for
sustainable development and promotion of agricultural production, in order to ensure
national food security,
Integration of agriculture in a market-oriented economy and to generate increasing
incomes to the producers (MINAGRI, 2011).
Rwandan smallholder farmers confront with many challenges which prevent them to
maximize their agriculture output necessary for the increasing of their incomes. One
of the most challenges they face is the lack of financial resources required to purchase
improved inputs. The GoR adopted some strategies which will help smallholder
farmers increasing their production and one the most strategies is to subsidies inputs
(MINAGRI, 2007)
Specifically, the subsidy voucher system grant farmers access to certified fertilizers
and improved seeds and was expected to have direct effects on the agriculture
productivity which will lead to increase in farmers’ income and consumption
expenditure. The poverty reduction effects are also expected as a result of improved
access to education and health services brought about by increase in income (IFDC,
2011)
From September 2009, the government has established the fertilizer voucher program
that helps in the wider distribution networks of fertilizers so that the smallholder
farmers have access and affordability to the fertilizers inputs.
Recently, the government distributes vouchers to farmers through service providers;
the farmers buy fertilizers from the distributor/dealer by presenting the coupons which
are given to them at registration time. The distributor transacts the vouchers at the
financial bank outlets which in turn collect from MINAGRI/MINICOM (CIP
PROGRESS REPORT, 2008)
16. 3
As the Input voucher system is not a continuing program, the exit stage should be
determined by evaluating whether it has accomplished the initial objective it had set
and to what extend it is relevant within farmers’ acceptability.
So this issue has risen up the idea of assessing whether or not subsidizing fertilizer is
embraced by smallholder farmers and knowing if the program helps the poor
households break out of a poverty trap, boost future economic growth to provide
sustainable food security and long term outcome.
17. 4
1.2. Objectives of the research project
1.2.1 Main objective
The overall objective of this research is to assess the socio economic impact of
voucher program among Maize farmers towards poverty reduction.
1.2.2. Specific objectives
1. To evaluate the contribution of fertilizers subsidy through voucher program to
the welfare of maize farmers.
2. To know how maize farmers pay the remaining part of fertilizers subsidy.
3. To determine the constraints that maize farmers are facing under voucher
program through fertilizers subsidy.
1.2.3 Research Question
i. How the voucher program contribute to the welfare of maize farmers
through fertilizers subsidy?
ii. What are strategies do maize farmers use to pay the remaining part of
fertilizers subsidy?
iii. What are the constraints do maize farmers are facing under voucher
program through fertilizer subsidy?
1.3. Interest of the study
The interest of this study was the opportunity to the policy makers to know the
challenges that maize farmers are faced with in voucher program so that they can see
how to overcome those challenges.
1.4. Study limitation
A number of limitations were encountered during this study. First, time and financial
resources ranked the highest in hampering the smooth execution of this research.
Secondly, poor record keeping by the farmers and accessibility to data in bureaucratic
offices proved to be a stumbling block. Thirdly, Poor record keeping and lack of
database on maize productivity among respondents and finally access to government
documents and other publications from organizations in Rwanda.
18. 5
1.5. Significance of the research
This research is divided into three main parts; the first one is focused on literature
review and the second part, the experimentation, presentation of results and
discussion. Finally, conclusion is formulated and recommendations are proposed to
improve the fertilizer subsidy trough voucher program of Maize farmers in Gataraga
sector, Musanze district.
19. 6
CHAPTER II. LITERATURE REVIEW
2.1. INTRODUCTION
This chapter focuses on determining the current state of knowledge about the impact
of the agricultural inputs subsidies on livelihood of smallholder farmers, identifying
the most important factors affecting the program performance, and the linkages
between the fertilizer subsidy and other social economic factors are explained.
2.2. AGRICULTURE IN RWANDA
2.2.1. Sector objectives
The specific objectives for agriculture sector include among others (i) Increasing food
production and ensuring optimum food security in the country (ii)Ensure growth of
employment creation as the backbone of Rwandan economy (iii) Facilitates expansion
of exports in the sector to fetch foreign exchange earnings (iv) strive to ensure
resource conservation and poverty alleviation (MINAGRI, 2004)
2.2.2. The strength of agricultural sector in Rwanda
Agricultural sector has historically been the backbone of the Rwandan economy. In
addition to its contribution to GDP, the sector typically generates about 90% of
employment (especially for women), about 70% of export revenues and about 90% of
national food needed. This gives the sector much strength as the driver of economic
power in the country (IPAR, 2009)
2.2.3. Soil fertility decline in Rwanda
Soil fertility is defined as ‘The quality of a soil that enables it to provide nutrients in
adequate amounts and in proper balance for the growth of specified plants or crops
(Hartemink, 2006). A decline in soil fertility implies a decline in the quality of the
soil, decline in chemical soil fertility, or decrease in the levels of soil organic C, PH,
and plants nutrients (N, P, K) and micro-nutrients. Soil fertility decline thus includes
nutrient decline. (Hartemink A. I.-C., 2006)
Some changes in land use which have increased the soil fertility decline:
20. 7
(i) The continuous cultivation. An effect of continuous cultivation is that the soil is
hoed and loosened at least twice a year, making it susceptible to erosion. The soil is
also depleted of nutrients. (Moeyerson 1989)
(ii) Reduced pasture, which has led to fewer animals and less manure, the most
important soil additive. The result is a reduction in the amount of nutrients and
organic material transferred from outside the farm onto the fields
(iii) Cultivation of marginal lands such as steep slopes, poor soils and high altitude
regions
(iv) Changing crop choices reflecting the need for higher caloric production/ha (more
tubers to the detriment of cereals and pulses). The tubers require deep hoeing so the
soil becomes more susceptible to erosion, and tubers also quickly deplete the soil of
nutrients. (Rwanda Society- Environment Project/working paper 5)
2.2.4. The effects of soil fertility decline
Alfred E. Hartemink in his study confirms that soil fertility decline occurs in many
land use systems. The decline in soil fertility under annual cropping systems is
contributing to the stagnation in the growth of food production experienced in some
parts of the world, as in sub-Saharan Africa. The soil fertility decline affects
production and thus reduces the export and income of a country. (Soil fertility decline
in the tropics)
2.3. AGRICULTURAL INPUTS ACCESS
2.3.1. Low use of inputs
The five main causes that lead to low use of agricultural inputs include the country’s
geographical structure, insufficient inputs stocks, affordability, farmers’ knowledge
and skills and incentives. (IPAR, 2009) As in the case of Geographical structure more
that 39% of the cultivated land is on slopes which in turn occupies over 25% of
available land in Rwanda. This not only increases the risks of soil erosion, but also
limits the use of tractors in agricultural activities. In shortly this is the economic costs.
Another issue is Insufficient National Stocks, Rwanda has for a long time lacked
indigenous sources of fertilizers and pesticides. In 2005, only 8% of the households
used inorganic fertilizers and 12% improved seeds.
21. 8
The Ministry of Agriculture and Animal resources report that imports of agricultural
inputs have not been enough to cover the country’s demand, and the ability of
delivery chain to get bulk purchases to farmers is weak. Affordability is a problem
because of lack of domestic sources of fertilizer and high cost of pesticide, while most
farmers are poor and lack access to credit to finance inputs.
Farmers’ knowledge and skills are limited, though a number of farmers understand
the fact that better use of inputs could improve the yields. Farmers’ incentives are not
defined, so there is always no clear link between price and quality. At the same time,
there has been some evidence that farmers have been reselling seeds and fertilizer to
meet short-term needs (IPAR, 2009)
2.4. VOUCHER PROGRAM
2.4.1. Definition
The voucher is an income transfer to the farmer from the government, donor, or
implementing agency, but it is a transfer that can be realized only through private
sector suppliers. A common approach to designing smart subsidies for fertilizer use
involves input vouchers. The idea is simple. Farmers are given vouchers that they can
take to local, often small-scale, private input suppliers to acquire fertilizer (or seed or
pesticides). The cost of the fertilizer for the farmer is reduced by the value of the
voucher.
The supplier, having provided fertilizer to the farmer in exchange for the voucher and
any additional cash cost beyond the value of the voucher, takes the voucher to a bank
or other designated agency and is reimbursed for its value, plus a handlings Fee
(Gregory, 2006)
A subsidy is basically a transfer of cash from government to benefit a certain section
of society; it therefore qualifies to be a public good (Wuyts et al., 1992).
2.4.2. Voucher Program
Agro-input vouchers are a subsidized title of payment (prepaid for all or part of their
value) for one or more inputs (e.g. fertilizers and seeds), which are given to farmers to
exchange with the local dealers. After delivering inputs to the farmer at a
predetermined payment level (free or at reduced price), those dealers are then paid the
subsidy on the agro-input by the financial organizations (previously engaged by the
22. 9
government/program organizer) or directly by the government/program organizers
(MINAGRI, 2009).
.
The theoretical argument behind this research in relation to subsidies is that the
beneficiaries should possess more assets because:
a) They save more due to reduced input cost. They have an added advantage.
Imagine a situation where the farmer must sell an asset in order to invest in maize
production but instead gets the inputs at half the price. Their assets are then spared
while it is the opposite for another farmer not benefiting.
b) They would be less risk averse as part of the risk is shared in the subsidy.
This should enable them to venture into more risky and profitable undertakings such
as acquisition of innovative assets or diversifying into high value crops.
c) They should have a wider profit margin and should therefore be able to acquire
more assets, whatever the source of money (Komives, 2005.
Vouchers are one of the most reliable means to make sure that the subsidies on the
inputs granted by Governments for the development of the agriculture sector and for
the improvement of farm income reach their target, i.e. the farmer in most cases;
while integrating dealers into the procurement chain in order to ensure development
and sustainability of the distribution chain (Wuyt, 1992).
Input vouchers may well be the best instrument to attain the objectives of a particular
public program for agriculture and rural development, but this result cannot be
assumed.
The specific design and quality of implementation are critical to success. It is
important to address three broad issues when considering fertilizer input vouchers:
(i) The objectives of the intervention. Input voucher programs are typically saddled
with several objectives. The most prominent are developing the private input supply
system, reducing poverty, and attaining national or household food security.
Prioritized objectives are needed for any input voucher program.
23. 10
(ii) The effectiveness of targeting and the potential for leakage. Ensuring that the
benefits of an input voucher program go to the designated beneficiaries is a challenge.
An evaluation of the TIP in Malawi, which relied on community-based targeting
using poverty criteria, found that the beneficiaries were no poorer on average than non
beneficiaries. Lack of information, political interference, and implementation
constraints, such as poor voucher control systems, all reduce the efficiency of
targeting of the vouchers. (Minot, 2009)
(iii) The appropriateness of focusing on fertilizer. If the objective of an
intervention is to strengthen private input supply systems, fertilizer vouchers that can
be redeemed at private input suppliers make sense. They provide incentives to farmers
to use fertilizer and create effective demand to which suppliers will respond. (Minot,
2009)
2.4.3. Role of Voucher System rogram
Their specific role is to provide a means of transferring assets to the targeted farmer
beneficiaries that will enable them to increase productivity of staple crops, produce
more saleable surplus, increase land devoted to higher value crops, and raise incomes.
At the same time, vouchers provide an incentive for small input dealers to develop
their businesses. Vouchers can help build the private-sector distribution network by
requiring that farmers take their vouchers to private input dealers to exchange for
fertilizer.
Voucher programs provide an opportunity to train farmers and input suppliers on
efficient, profitable use of fertilizer. The final objective is to bring about sustainable
increases in agricultural productivity and increased rural incomes for targeted
participants. (Kenneth Baltzer, 2011/2)
24. 11
2.5. Background on Crop intensification program (CIP) and fertilizer
distribution
Crop Intensification Program (CIP) is a flagship program implemented by the
Ministry of Agriculture and Animal Resources to attain the goal of increasing
agricultural productivity under PSTA II. CIP aims to accomplish this goal by
significantly increasing the production of food crops across the country. CIP currently
undertakes a multi-pronged approach that includes facilitation of inputs (improved
seeds and fertilizers), consolidation of land use, provision of extension services, and
improvement of post-harvest handling and storage mechanisms. Started in September
2007, the CIP program focuses on six priority crops namely maize, wheat, rice, Irish
potato, beans and cassava (MINAGRI, 2010)
2.5.1. Distribution of improved inputs
Access to improved inputs has long been inhibiting the farmers from raising the
productivity levels. The access was curtailed by the low demand and costs which are
further amplified by the difficulties in transportation to rural areas. To overcome these
constraints, CIP took a ‘supplypush’ approach whereby the inputs are initially
supplied by the government and the farmers are persuaded to use.
2.5.2. Distribution of fertilizers and voucher program in Rwanda
From 2009, through bulk orders, CIP imported 6,000 tons of fertilizers and distributed
to farmers for free through various service providers. About 83% of fertilizers were
used by farmers growing maize, wheat, rice and potato. CIP imported 14,427 tons and
distributed to maize and wheat growers at subsidized rates (50%) covering the
overhead (transportation and administrative costs) from Mumbasa to rural areas were
covered by the government. CIP continued to import and distribute in 2010 (33,500 t)
and 2011 (22,000 t). Through an auction process, the CIP auctions the imported
fertilizers to private distributors. To access these fertilizers at subsidized prices, CIP
distributes vouchers to farmers through service providers. (IPAR Rwanda Report
August, 2012).
Vouchers are one of the most reliable means to make sure that the subsidies on the
inputs granted by governments for the development of the agriculture sector and for
25. 12
the improvement of farm income reach their target. The farmers, while integrating
distributors into the procurement chain in order to ensure the development and
sustainability of the distribution chain.
With this approach, the voucher allows the distributor to carry out a sale at a normal
price and thus to generate a margin as if the product were not subsidized.
The distributor transacts the vouchers at the financial bank outlets which in turn
collect from MINAGRI/MINICOM. The following table describes in brief the design
of fertilizer voucher program.
2.5.3. Voucher program in summary
Argument Description
What is the
voucher and how
is it funded?
The Voucher program introduced by the government to improve on
the prior programs meant to assist the smallholder farmers and
private sector in the wake of liberalized inputs fertilizer distribution.
When and Why
was it Created?
The Voucher was introduced in 2009 to assist the smallholder
farmers use fertilizer and improve private sector firms provisioning
of fertilizer and related inputs. The voucher was a justification for
government involvement in managing a transition to build the
capacities of both the private sector and smallholder farmers.
What are the
Objectives?
The objectives are aimed at improving, maize production, household
food security and national food self-sufficiency, incomes,
accessibility to inputs by smallholder farmers through the subsidy,
and to building the capacities of the private sector to participate in
the supply and distribution of inputs. Through the voucher program,
Government also aimed to rebuild the resource base of the of the
smallholder farmers.
What are the
Criteria of
inclusion in the
Smallholder farmers, who are actively involved in the farming
activity, have capacity to cultivate 0.5 hectares of land. Capacity to
pay 50% of the cost of inputs, being in the less than third category of
26. 13
Source: Elaboration from CIP Evaluation report, 2009.
2.5.4. Implication of fertilizer voucher program on smallholder farmers
In recognizing that a large proportion of smallholder farmers in rural areas depend on
agriculture for sustenance, the Fertilizer voucher program was established as one of
the Programs created to increase food production and enhance food security among
stallholder farmers by supplying fertilizers and seed at a 50% subsidy (CIP
evaluation report, 2009). The general objectives of the voucher program were to
promote the use of low input and conservation farming technologies among selected
target smallholder farmers who meet the vulnerable criteria.
program? UBUDEHE program
What is the pack? Comprises 50kg bags of NPK and 25kg of DAP and free hybrid seed
according to the necessity of smallholder’s farmers.
Crop supported? Maize, wheat, rice and potato.
27. 14
CHAPTER THREE: RESEARCH METHODOLOGY
For this chapter, the area of study, methodology used to collected and analyze the data
were described.
3.1. Site selection and description
3.1.1. Site selection
Musanze District was selected for study out of many other districts in Northern
Province. The Musanze District was chosen by random among the 5 districts of
Northern Province, exactly in Gataraga sector.
3.1.2. Site description
GATARAGA Sector is one of the fifteen Sectors of Musanze District in Northern
Province. It is boarded at the East by Kimonyi Sector of Musanze District, to the
North by the Volcanoes National Park and Shingiro Sector of Musanze District, to the
West by GATARAGA Sector of MUSANZE District and the Volcanoes National
Park, to the South by GATARAGA Sector of Musanze District. Its surface area is
50.52 Km2
GATARAGA Sector is subdivided into four cells, it consists 20 villages.
3.1.3.Climate and rainfall in GATARAGA Sector
GATARAGA Sector is characterized by a rainfall of 1100mm per year, the average of
temperature varies between 12O
C and 13.5O
C and its soil come from the volcanic ash.
It records two major ground water sources; Rubindi and Mutobo where the second is
managed and treated by EWSA. Few of them have access to Electricity. Only the
firewood is a principal source of energy.
3.1.4 Relief of GATARAGA sector
The altitude of GATARAGA Sector is between 1800 m and 2650 m. It means that
there are many hills because it is located in the North of Rwanda.
28. 15
3.1.5 Population
20546 inhabitants, is to say 407 inhabitants per square kilometer. The number of
households is 4915 (GATARAGA Sector, 2012).
3.1.6 Flora and Fauna
GATARAGA Sector has natural drill and which belongs to the Volcanoes National
Park. It is about an ombrophilous forest of mountains with the bamboo like species
characteristics. It has also artificial forest where Eucalyptus represents dominant
species.
The width dimensions one of the animal kingdom, one meets there many animals
species among which the famous Gorillas of mountains, Buffaloes, Elephants,
Antelopes, and Monkey as well.
3.1.7 Socio-economic characteristics of GATARAGA Sector
GATARAGA Sector has one health center and six primary schools centers with
elementary schools every primary school center, three secondary schools; four
enrollment centers for adult people .
The economy of GATARAGA Sector is based on agriculture and livestock farming.
The main crops grown are food crops (Irish potatoes, maize, wheat, beans, vegetables
and one cash crop (pyrethrum). The system of keeping is still traditional. The animals
kept are cows, goats, sheep, pigs, hens, rabbits, and bee keeping and the exotic races
are still at low level.
The crops like Irish potatoes are sold in different areas of Musanze District and
Kigali Town. The prices are fixed by farmer and his/her customer. There are also
some roads facilitate the forwarding of these crops.
3.2. Target population
Since the study was to assess the impact of fertilizer subsidy program on maize
farmers case of voucher program in Gataraga sector,Musanze District,2000 maize
farmers were benefiting fertilizers subsidy trough voucher program.
29. 16
3.2.1. Sampling procedure
The sample for this study was drawn from 4 cells that comprise GATARAGA
sector.
In order to determine sample size, the following formula of Dagnelie, 2006 cited
in Jmv MUSANABANDI, 2012 was used.
Where: n= sample size; N= size of population (number of Maize farmers);
Z= coefficient normal distribution; q= probability of failure
d= margin error; p= probability of success.
For Kothar, the margin error varies between 5 % and 10 %. We are going to use
the margin error of 10 %, then the confidence level of 90 %, our probability of
success is p=0.5, failure probability of q=0.5, as Z0.25=1.65
The total Maize farmers benefiting the program are 2000 in Gataraga sector.
Then,
farmers
xx
xx
n 66856.65
5.0)65.1()12000()1.0(
20005.0)65.1(
222
22
The sample size taken was 66 farmers benefiting fertilizer subsidy program in
Gataraga sector. The sample was drawn from different farming sites located in
GATARAGA Sector. This sample size of 66 farmers was considered sufficient for the
study as it was supplemented by direct observation of the post-harvest activities in the
area of study.
30. 17
3.2.2. Sampling at the cell level
At the cell level, the sample size (number of farmers to be interviewed) will be
determined using the formula below:
Where:
ni: The sample size proportion to be determined
Ni: The population proportion in the stratum S
n: The sample size
N: Total population
So, the proportion of farmers in 4 sample cells namely Mudakama, Rungu,
Murago, and Rubindi is presented in the table below as it is calculated with the
help of the above formula.
Table 1: Determination of the representative sample for four cells of Gataraga
Sector.
Cells’s name Farmers of Maize Sample taken
Mudakama 420 3.86
Rungu 400 3.2 3
Murago 600 9.8 20
Rubindi 580 9. 9
Total 2000 66 farmers
3.3. Data collection, entry and analysis
3.3.1. Interviews
The main data are gathered using structured interviews based on a pre-prepared
interview schedule. For the interview schedule, the relationship with the respondents
31. 18
was very important for a good understanding with them to establish a good
relationship. The questions were closed and open to give the respondents a chance to
articulate themselves exhaustively.
3.3.3Questionnaires
Wimmer and Dominick (1994) identify the survey questionnaire as the key research
instrument in survey research and suggest four main types of questionnaires. This
study applied the personal interview type of survey questionnaire. This was conducted
with the direct translation of questionnaires written in English and they were
translated into Kinyarwanda before interviewing. The use of the survey questionnaire
has tendency to enhance reliability and validity of the findings. In total 66
questionnaires were administered in the whole Sector.
3.3.4 Desk review
In this study, we have been able to generate significant information from various
sources in the area of interest and at national level. All these materials turned out to be
significant sources of information. In view of the recent information on the subject,
document analysis was found to be the most convenient, time saving and cheapest
method to use. Finally, it ought to be highlighted that the World Wide Web and the
Internet Proved to be indispensable research instruments.
3.3.5 Data collection
The research relies on both primary and secondary data. Sample survey techniques
were followed where enumerators are aimed to distribute questionnaires to the
research subject.
3.3.6Primary data
Primary data collection employed various tools and methods namely personal
interviews, observation and focus group discussions. A structured questionnaire was
designed and administered within the study area. This was mainly used to collect data
from individual farmer.
3.3.7 Secondary data
The primary data obtained through formal statistical approaches, secondary sources of
data are also valuable for this type of study. Statistical yearbooks, farmers ‘records,
33. 20
CHAPTER IV. PRESENTATION,
ANALYSIS AND DISCUSSION OF THE FINDINGS
This chapter covers summary of findings made from this research based on the
research objectives and research questions.
The analysis and discussion is done in light of socio-economic characteristics of
respondents, asset accumulation, farming experience, cropped size, production and
income. It shall also make some reflections based on literature, theoretical
framework and researcher’s field experience.
4.1. Demographic Characteristics of Respondents:
4.1.1. Gender distribution
As it is shown in the following figure 1. The field survey conducted is selectively
covering a total of 66 Maize farmers, 100 percent of the survey respondents are
farmers that received fertilizer through voucher program in the almost 2013B season,
According to gender, 56 % of respondents were male against 44 % female.
Gender distribution figure:
Figure 1: Gender distribution
Source: Primary Data
Male
56%
Female
44%
Gender
34. 21
4.1.2 Age
The data presented in figure 2 below depict that large number of respondent farmers
fall in the average age category of years 35-50 (57.6%), This shows that adult people
like maize practice while the youth represented by (22.7%) 20-35 maize farming is
mixed with other activities and they are not under poverty line and Above 50 years
had (19.7 %)
Age of farmers:
Figure 2: Age
Source: Primary Data
4.1.3Educational level
For education level, findings show the most part of benefiting voucher program52
farmers (78.8. %) has at least attained primary education, the Illiteracy occupied by
(18.2%) 12 farmers and Secondary took (3%) 2 famers .that is why the program is
well understood due to their level of education as shown in below figure3.
Educational Level:
Figure 3: Educational level
Source: Primary Data
15
38
13
0
10
20
30
40
20-35 35-50 Above 50
Age
20-35
35-50
Above 50
52
2
12
0
20
40
60
Primary Secondary Illiteracy
educational level
Primary
Secondary
Illiteracy
35. 22
4.1.4 Martial status
According to marital status, the result shows that most of respondents are married
(71.2%) 47 farmers, while (21.2%) 14 farmers are Widows and single took (7.6%) 5
farmers.
Martial Status:
Figure 4: Martial status
Source: Primary Data
4.1.5The total size of cultivated area
The maize farmers have different area of their land in below figure5 shows that 23
farmers have 50-75 acres,19 farmers have 25-50 acres while 5 farmers their land are
very small 1-10 acres and 4 farmers have above 75 acres due the lack of family
planning their land are not satisfaction .
The total size of cultivated area:
Figure 5: Cultivated area ranges in acre
Source: Primary Data
5
47
14
0
20
40
60
Single Married Widows
Maritial status
Single
Married
Widows
5
15
19
23
4
0
5
10
15
20
25
[1-10[ [10-25[ [25-50[ [50-75[ >75
Frequency
Cultivated area range in acre
36. 23
4.1.6 Source of income
During the survey, Maize farmers are asked how they get income from their daily
activities. From the Table2, the findings shows that voucher beneficiaries practice the
farming activities and the difference arise when it comes to livestock where (60.6%)
making farming while (39.4%) mixing Farming and livestock.
The source of Income:
Table 2: The source of income
Frequency Percent
Farming 40 60.6
Farming and livestock 26 39.4
Total 66 100.0
Source: Primary Data
4.1.7. The years experience of being in maize farming
According to the year’s experience of being in maize farming most people
interviewed were not new in maize farming because as shown in table below 66.7%
had more than 10 years of maize farming and 33.3% less than 10 years in maize
farming as shown in below table 3.
The years experience of being in maize farming:
Table 3: The years experience of being in maize farming
Frequency Percent
Under 10 years 22 33.3
Above 10 years 44 66.7
Total 66 100.0
Source: Primary Data
37. 24
4.2 Contribution of voucher program toward the maize farmers
4.2.1. Kind of subsidy from Voucher program
The field survey conducted is selectively covering a total of 66 Maize farmers, 100
percent of the survey respondents are farmers that received fertilizer and improved
seeds through voucher program in the almost 2013B season.
4.2.2 Working with Voucher program for fertilizers subsidy
The survey shows that the maize farmers it was not first time working with voucher
program by giving them various inputs most people have experience for 3 years
dealing with it 60.6% while 4years and 2years took 15.2% then 1.5% they are starting
getting fertilizer subsidy at the last7.6%have above 5 years working with voucher
from 2009 started in Rwanda as shown in below table 4.
Experience in working with voucher program
Table 4: Experience in working with voucher program
Years Frequency Percent
1year 1 1.5
2years 10 15.2
3years 40 60.6
4years 10 15.2
5years 5 7.6
Total 66 100.0
Source: Primary Data
38. 25
4.2.3. Company has the contract for providing the input subsidies
One the three priority actions putted forward by the Strategy for Developing
Fertilizer Distribution Systems (SDFDS) in Rwanda to improve fertilizer distribution
systems in Rwanda and increase the availability, accessibility and affordability of
fertilizer to farmers is to strengthen the capacity of the private sector to timely supply
quality fertilizer at affordable prices. As shown by respondents in the table 5, (75.8%)
are private suppliers ,(15.2%)they know that is government who supplier the inputs
and (9. %)they don’t know where in puts came from, the finds shows that the inputs
came from private suppliers because it took a big number of respondents (75.8%).
Company has the contract for providing the input subsidies:
Table 5 : Company has the contract for providing the input subsidies
Company name Frequency Percent
Government 10 15.2
Private suppliers 50 75.8
Others (specify) 6 9.1
Total 66 100.0
Source: Primary Data
39. 26
4.2.4. Conditions required for getting input subsidies
Many farmers 77.3% of farmers interviewed are being poorest and poor family in
order to get input subsidy trough voucher program and (13.6%) have Small owner
land size then (9.1%) they found fertilizer subsidy through other ways as shown in the
table below. at this level many people are satisfied with the conditions required in
order to improve their living standards.
Conditions required for getting input subsidies:
Figure 6: Conditions required for getting input subsidies
Source: Primary Data
Being poorest
and poor family
77%
Small owner land
size
14%
Others (specify)
9%
Conditions required for getting input subsidies
40. 27
4.2.5. Use the fertilizers subsidy
In accordance with the use fertilizer subsidy as shown in Friedman Test was classified
as follow in below Table6: maize production (1.19), using for other crops (2.12) and
selling to the market (2.69).
Use the fertilizers subsidy:
Table 6 : Friedman Test for the use of fertilizer subsidy
Test Statisticsa
Use of fertilizers Frequency Percent Mean Rank N 60
Maize production
60 90.9% 1.19
Chi-
Square
91.633
using for other crops 29 43.9% 2.12 df 2
Selling to the market
0.0 0.0% 2.69
Asymp.
Sig.
.000
a. Friedman Test
Source: Friedman Test
4.2.6 Maize range production before and after implementation of fertilizers
subsidy
As also shown in the below Table 7 of maize range production before and after the
program shows that there is significance at 95% confidence Interval of the difference,
this explain well that a big contribution of voucher program have been occurred
among maize farmers due to high production got after the program implementation .
41. 28
Maize range production before and after implementation of fertilizers subsidy:
Table 7:Paired Samples Test comparison for Maize range production before and after
implementation of fertilizers subsidy:
Paired Differences
t df Sig. (2-tailed)Mean Std. Deviation
Std. Error
Mean
95% Confidence
Interval of the
Difference
Lower Upper
Pair 1
-1.000 .744 .092 -1.183 -.817
-
10.916
65 .000
Source: Paired Samples Test
4.2.7. Use of maize output
The figure 7.below shows that most maize farmers use their out in household
consumption and selling 61% while 30% use the maize production for only household
consumption and 9%for household consumption and storing.
Use of maize output:
Figure 7: Use of maize output
Source: Primary Data
Household
consumptio
n
30%
Household
consumptio
n and selling
61%
Household
consumptio
n and
storing
9%
Use of maize output
42. 29
4.2.8. Maize unit price
The maize farmers after interviewing them most of them told as that the unit price of
maize is 300rwf means (48.5%) of respondents while (43.9%) they sell their maize at
unit price of 200rwf this took the (43.9%) and the left part of maize farmers they get
much money above 300rwf at (7.6%) the maize producers are happy for the price of
their products due to the below table 8 shown.
Maize unit price:
Table 8: Maize unit price
rwf Frequency Percent
200 29 43.9
300 32 48.5
Above 5 7.6
Total 66 100.0
Source: Primary Data
4.2.9 The available market for maize production
The maize farmers after harvesting, I have to know where they sell the products if the
markets are available and who buy those products the findings shown that (84.8%)
they sell their products to the local market and cooperative while the rest part brought
by their neighbor at (15.2%) the maize farmers no problem about the market as shown
in the below table 9.
The available market for maize production:
Table 9: The available market for maize production
Frequency Percent
Local market and Cooperatives 56 84.8
Neighbor 10 15.2
Total 66 100.0
Source: Primary Data
43. 30
4.2.10 Use the maize production income
In accordance of their intensity as given by the Friedman Test, shows in the below
table10 the major using the maize production income is used in the following
ways:(2.36) for food satisfaction here most of them before to do any other thing they
have to consume the production, ( 2.62)for paying 50% of remaining part of fertilizer
subsidy given, at this level all beneficiaries pay after getting income. (2.83) for
saving the money in Umurenge sacco, ,(3.68) for domestic assets payment, yes some
people can buy materials that they need trough income got.
Use the maize production income:
Table 10: Use the maize production income
Test Statisticsa
Used for
Frequency Percent
Mean
Rank
N
66
Food satisfaction 65 98.5% 2.36 Chi-Square 254.273
Saving 56 84.8% 2.83 df 6
To pay school fees 58 88.8% 5.70 Asymp. Sig. .000
Health insurance payment 66 100.0% 5.80
To pay rest part of fertilizers
subsidy
60 90.9% 2.62
Domestic assets payment 40 60.6% 3.68
Domestic animals raising 15 22.7% 5.01
Source: Friedman Test to the use of maize production income
4.2.11. The savings of maize farmers
The table 11 below shows us 57.6% of farmers interviewed save their rest one money
in Umurenge Sacco and 33.3% save their rest of money in Ikimina and 9.1% they
don’t save in Gataraga sector there was no Bank only Umurenge Sacco where most
people use it to save their money. With those savings Government can implement any
other policy there in rural areas in order to improve agricultural productivity and
Private sector can make availability of Banks in order to allow those people to get
loan transforming their living standards.
44. 31
Savings of maize farmers;
Table 11:Savings of maize farmers
Frequency Percent
Ikimina 22 33.3
Umurenge SACCO 38 57.6
Total 60 90.9
No response 6 9.1
Total 66 100.0
Source: Primary Data
4.3 Strategies do maize farmers used to pay the fertilizers subsidy
4.3.1. Estimation of the quantity needed to maize production
The interviewer in this research needed also to know what factors allow them to get
such quantity of input subsidy the findings in the below table shows that 8 .8% it’s
based on Land size and 18.2% the quantity is estimated by voucher program officers
due to various issues such as illiterate people as shown in table 12below.
Estimation of the quantity needed to maize production:
Table 12 : Estimation of the quantity needed to maize production
Frequency Percent
According to the land size 54 81.8%
Estimated by voucher program officers 12 18.2%
Source: Primar Data
4.3.2. Fixation of the unit cost of fertilizers given.
The frequency distribution in below table shows that 71.2% the unit cost is fixed by
MINECOFINE, this shows that the people know who has in charge of fixing the cost
while other people 25.8% know that the cost is fixed by RAB because is always with
45. 32
the maize farmers through the CIP program and 3% is supplier who fix the cost. Here
the cost is fixed really by MINECOFINE find below table 13.
Fixation of the unit cost of fertilizers given:
Table 13: Fixation of the unit cost of fertilizers given
Frequency Percent
Supplier 2 3.0%
RAB 17 25.8%
MINECOFIN 47 71.2%
Source: Primary Data
4.3.3 Period of payment
During this research it was very interested to know when the maize farmers pay the
50% as the rest part after supported by the government by also paying 50%.the
findings shows that most people pay that remaining part after harvest at the level of
80.3% while 19.7%pay directly that part as show in below table14.
Period of Payment :
Table 14.Period of payment
Frequency Percent
Directly 13 19.7%
After harvest 53 80.3%
Source: Primary Data
4.3.4. Source of money to pay fertilizer
The frequency shows that 81.8% they pay fertilizer subsidy by using income from
maize production after harvesting as shown in table 15 below and 18.2% they 50% of
fertilizer subsidy by using income from other activities such as livestock.
46. 33
Source of money to pay fertilizer:
Table 15: Source of money to pay fertilizer
Frequency Percent
Income from maize production 54 81.8%
Others support (Specify) 12 18.2%
Source: Primary Data
4.3.5. Payment agreement
In the table 6 below the frequency shows that 78.8% are agree with the payment
method means that method doesn’t create any problem for them, and then 18.2% are
fair agree and 3% disagree with the payment method so most people are very happy
for the payment method.
Payment agreement:
Table 16: Payment agreement
Frequency Percent
Agree 52 78.8%
Fair agree 12 18.2%
Disagree 2 3.0%
Source: Primary Data
4.3.6Voucher program appreciation
The frequency shows in the table17 below that 81.8% are excellent with the voucher
program by getting fertilizer subsidy as it was in my objective of to evaluate the
contribution of fertilizers subsidy through voucher program to the welfare of maize
farmers, they can’t appreciate the program at this level without considering it’s
47. 34
contribution to their welfare while 13.6% it was very good for the program and
remaining maize farmers it’s good for them at .5%.
Voucher program appreciation:
Table 17: Voucher program appreciation
Frequency Percent
Excellent 54 81.8%
Very good 9 13.6%
Good 3 4.5%
Source: Primary Data
4.3.7 Constraints counted during the period of study
In the overall view, the fertilizer voucher program in last season 2013B is appreciated
by the participants, because it procures several advantages despite the challenge and
some weakness. However, they were asked to show their position on the willingness
to embrace the program and they have shown some challenges resource constraints
such as shown in the figure 7 below shows the various constraints found in better
implementation of voucher program most of them are insufficient of fertilizers
( 59.1% ) with 39 frequency the 2nd
is inputs delaying took 22 of frequency with
33.3%, long transport fees for 16 frequency for 24.2%,low skills of farmers for
15frequency with 22.7% and repayment of fertilizer on 18.2)for 12 frequency others
are on less level like low yield 9(13.6%),climate change4(6.1%),3 for lack of
investment (4.5%) and high cost for 2(3%).
48. 35
Constraints counted during the period of study:
Figure 8: Constraints counted during the period of study
Source: Primary Data
4.4. Farmers perceptions
For proofing this, we have surveyed the farmer’s appreciation on the program and the
finding shows that all participants have the willingness to continue participating in the
next fertilizer program because of several advantages such as increasing in the maize
production and accumulating the
4.5. Discussion
As stated in CIP report, 2011, there was an increase on the production of maize by 6-
fold, in the past 4 years. These outputs have pushed Rwanda to the verge of becoming
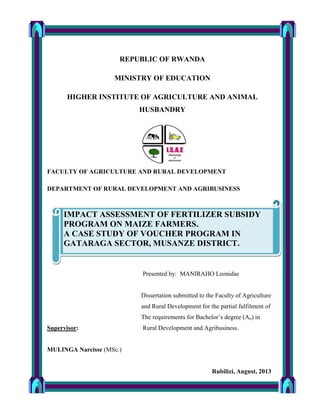
a food secure country.
22
12
39
3
16
2
9
4
15
0
5
10
15
20
25
30
35
40
45
Inputs
delaying
Repayment
of fertilizers
subsidy
Insufficient
of fertilizers
subsidy
Lack of
investment
for the
farmers
Long
transport
fees of
fertilizers
subsidy
from the
stock
High
fertilizers
subsidy cost
Low yield Climate
change
Low skills of
farmers
Frequency
Constraints Counted
Constraints counted during the period of study
49. 36
Also as stated by Dr. Alfred R. BIZOZA and Patrick BYISHIMO(2012) in their
research on agricultural productivity and policy interventions, the voucher system has
significant marginal effects on change in crop yield (measured by farmer’s
perception) at 5% level of significance.
The result of the socio-economic variables indicates that the majority (57.6 %) of the
respondents for Beneficiaries fell within the age range of 35 and 50 years. This
formed the cream of productive work force. It also shows that majority (71.2%) of the
beneficiaries was married and 21.2% are widows. This issue defines the inclusion of
most vulnerable group in the voucher program. The findings show also that majority
number of beneficiaries (78.8%) had at least primary education this shows the role of
education the awareness of the program participation.
According to the Contribution of voucher program toward the maize farmers
The finds shows that most beneficiaries of the program their production have been
increased from 37.9% [10-100 kg [, 53.0% [100-250 kg [; 9.1% [250-500 kg [before
the program to 37.9% [100-250 kg [, 53.0% [250-500kg [, 9.1% [500-750kg [after the
program and those results are related to those reported by Bizoza et al (2012).
According to the use of maize production income the findings shows in accordance of
their intensity as given by the Friedman Test, shows that the major using the maize
production income is used in the following ways:(2.36) for food satisfaction here
most of them before to do any other thing they have to consume the production, (2.62)
for paying 50% of remaining part of fertilizer subsidy given, at this level all
beneficiaries pay after getting income. (2.83) for saving the money in Umurenge
sacco ,(3.68) for domestic assets payment, yes some people can buy materials that
they need trough income got.
According to strategies do maize farmers used to pay the fertilizers subsidy, the
results shown that the majority of maize farmers pay the remaining part of fertilizer
subsidy at the percentage of 81.8 they pay fertilizer subsidy by using income from
maize production after harvesting as shown in table 16 and 18.2% they 50% of
fertilizer subsidy by using income from other activities such as livestock.
50. 37
In the overall view, the fertilizer voucher program in last season 2013B is appreciated
by the participants, because it procures several advantages despite the challenge and
some weakness. However, they were asked to show their position on the willingness
to embrace the program and they have shown some challenges resource constraints
such as shown in the figure 8 below shows the various constraints found in better
implementation of voucher program most of them are insufficient of fertilizers
( 59.1% ) with 39 frequency the 2nd
is inputs delaying took 22 of frequency with
33.3%, long transport fees for 16 frequency for 24.2%,low skills of farmers for
15frequency with 22.7% and repayment of fertilizer on 18.2)for 12 frequency others
are on less level like low yield 9(13.6%),climate change4(6.1%),3 for lack of
investment (4.5%) and high cost for 2(3%).
51. 38
CHAPTER V: CONCLUSION AND RECOMMENDATION
5.1 CONCLUSION
This paper has tried to assess the findings on fertilizer subsidy via voucher program
by focusing on the views of maize farmers regarding its contribution to the welfare of
maize farmers. The study conducted in July 2013, after 4 years of program
implementation in GATARAGA Sector, where the farmers use voucher coupons to
get fertilizer and free improved seeds for maize production.
A combination of quantitative questionnaire survey and observation were used to
generate data for this study, semi-structured interviews and physical observations
have been used. For data analysis, a comparative analysis was done between before
and after of subsidy fertilizer program. A total of 66 sample maize farmers were
interviewed.
The findings indicate that the voucher program is necessary and sufficient program
for boosting welfare of maize farmers: Fertilizer subsidies have a positive effect on
maize production Compared before and after the program. The application of
voucher fertilizer is more like thence (×10) the yield.
So, this evidence has in turn impacted positively on food satisfaction and income
generation.
However, the voucher program has contributed positively on maize farmers in terms
of production and income accumulation. The system is challenged by: insufficient of
fertilizers, inputs delaying long transport fees.
52. 39
5.2 RECOMMENDATIONS
At the last of this paper we have collected some recommendation that should increase
the smooth functioning of the program.
The following recommendations should be raised:
As the process of registration in voucher program need to be repetitive each season;
our recommendation to MINAGRI is to redesign it by reducing the bureaucracy by
decentralizing at village level or creates the phone or software registrars;
We recommend MINAGRI also to respect agriculture season by providing to the
farmers the fertilizer at the right time and facilitate the farmers to get input subsidy
near of their land.
The farmers should be mobilized to form the cooperatives that help them to
consolidated their small land that could help them having access to micro credit and
general storage facilities.
we recommend also that the government should consider post-harvest technology as
priority so that the farmers should have access to storing hangar that ensure good
quality of their yield and enduring effect of food availability.
We recommend the future researchers to continue to show the impact of voucher
program in order to improve the challenges faced by the program.
53. 40
Reference
-Adeyemi S, I., G.T Ijaiya,M.A and Ijaiya,B.L. (2009).'Determinants of the Right Of
Access to Food in Sub-Saharan Africa', African Journal of Food,
2008/2009.Crop intensification program, Evaluation report.
- Chibwana, C., M. Fisher, G. Shively. 2010. “Land Allocation Effects of Agricultural
Input Subsidies in Malawi.” (In press) World Development.
-Dr.Alfred BIZOZA, P. (2012). Agricultural productivity and policy interventions in
Nyamagabe district, southern province Rwanda.
-FAO (2003).Trade Reforms and Food Security: Conceptualizing the Linkage, Rome.
-Henao, B. (2006). The low productivity of the agricultural sector is largely attributed
to low and decreasing soil fertility.
-Jayne, T.S., A. Chapoto, I. Minde and C. Donovan (2008) the 2008/09 Food Price
And Food Security Situation in Eastern And Southern Africa: Implications
For Immediate and Longer Run Responses
-Kane., E. (1996) Seeing for Yourself: Research Handbook for Girls' Education in
Africa.
-Komives, K. (2005) Water, Electricity and the Poor: Who Benefits from Utility
Subsidies?
- Lumba, S. (2009) Do Subsidies work for the poor? MA Thesis, Institute of Social
Studies, The Hague.
-MUSANABANDI Marie Jeanne, (2012). Socio economic driving factors for
homegarden practice adoption: case study of Nyamugali sector of
kirehe district.
-MINAGRI, Auction and voucher guide for fertilizer and seed, 2009
-MINAGRI, strategies for developing fertilizer distribution in Rwanda, April 2007.
-MINAGRI, Strategies for sustainable crop intensification in Rwanda, 2011
54. 41
-NKUNDIMANA Sosthene,(2012). Impact assessment of fertilizer susidy
Program on small holder livelihood:voucher program in Gahanga
Sector,Kicukiro District.
-Patton, M.Q. (2002) Qualitative research & evaluation method (3 ed, CA: Sage).
-Ricker-Gilbert, J., T.S. Jayne and E. Chirwa. 2011. “Subsidies and Crowding Out: A
Double-Hurdle Model of Fertilizer Demand in Malawi.” American
Journal of Agricultural Economics
-Rwanda Agriculture Sector Situational Analysis, An IPAR sector review,2012
- Silverman, D. (1993) Interpreting qualitative data: methods for analyzing talk, text,
And interaction London: Thousand Oaks, CA: Sage.
-Valerie, J. (2002). Using Analysis of Fertilizer demonstration Plots to improve
Programs for Stimulating Fertilizer Demand in Rwanda.
-Wimmer, R.D., and J.R. Dominick. (1994) Mass Media Research: An Introduction.
California: Wadsworth.
-Wuyts, M., M.Mackintosh. And T Hewitt. (ed.) (1992) Development Policy and
Public Action Oxford Oxford University Press in Assoc.
55. 42
APPENDICE
APPENDIX 1: Questionnaire used during data collection
Dear respondent!
My name is MANIRAHO Leonidas, a student from the Higher Institute of
Agriculture and Animal husbandry. I am conducting a research study on the impact
assessment of fertilizer Subsidy program on voucher program in Gataraga sector. as
part of my dissertation leading toward of Bachelor’s degree in Rural Development
and Agribusiness. Your response will be treated with high confidentially and will only
be used for academic purposes. Thank you!
II.IDENTIFICATION
2.1. How many years have you been in maize farming?
1. Under 10 years
2. above 10 years
2.2. What is the total size of your cultivated area (in ha)?
1. 1-10 are
2. 10-25 are
Famers identification
Names of
Respondent(optional)
……………………………………………………………
Household members ……………………….number
Sex
Male
Female
Age
20-35 Education level
35-50 Primary
<50 Secondary
Tertiary
None
Marital status
Single
Married
Widows or divorced
56. 43
3.25-50 are 4. 50-75are , 5. <75 are
2.3. What is your source of income?
i. Farming
ii. Farming and livestock
iii. Farming and off farm business
iv. Farming and civil servant
I. Contribution of voucher program toward the maize farmers
3.1 What Kind of subsidy from Voucher program?
a. Improved maize seed and fertilizer yes……no……..
3.2 How long are working with Voucher program for fertilizers subsidy?
i. 1year
ii. 2years
iii. 3years
iv. 4years
v. 5years
3.3 Use of fertilizers subsidy
3.3.1 Which company has the contract for providing you those input subsidies?
1. Government
2. Private suppliers
3. Others (specify)
3.3.2 Which conditions required in order getting those input subsidies?
1. Being poorest and poor family (1st
and 2nd
categories of Ubudehe)
2. Small owner land size
3. Others (specify) ………………………….
3.3.3 How do you use the fertilizers subsidy?
1. Maize production
2. using for other crops
3. Selling to the market
57. 44
3.4 Maize production and the use of income
3.4.1 What is your maze range production before and after implementation of
fertilizers subsidy?
Range quantity (in Kg) Before After
[10-100[ 25
[100-250[ 35 25
[250-500[ 6 35
[500-750[ 6
Above 750
3.4.2 How do you use the maize production?
i. Household consumption
ii. Household consumption and selling
iii. Household consumption and storing
3.4.3 What is maize price?
a) 100
b) 200
c) 300
d) Above
3.5.3 Where do you sell your maize production?
i. Local market and Cooperatives
ii. Neighbor
iii. Others (Specify) …………………….
3.4.4 How do you use the maize production income?
Used for yes No
Food satisfaction
Saving
To pay school fees
Health insurance payment
To pay rest part of fertilizers subsidy
Domestic assets payment
Domestic animals raising
58. 45
Others (specify)-------------------
3.4.5 If you make savings, where do you save?
i. Ikimina
ii. Umurenge SACCO
iii. Cooperative
iv. Bank
v. Other ways of savings (specify) ………………………..
4. Strategies do maize farmers used to pay the fertilizers subsidy
4.1. How estimate the quantity needed for your maize production?
1. According to the land size
2. Estimated by voucher program officers
3. Other way (specify) …………………
4.2Who fix the unit cost of fertilizers given?
i. Supplier
ii. RAB
iii. Beneficiary
iv. MINECOFINE
v. Others (Specify) ……………….
4.3.In which period do you pay the fertilizers subsidy?
1. Directly
2. After harvest
4.4 How do you find the money to pay the fertilizer subsidy?
1. Income from maize production
2. Others support (Specify) ………
4.5. How do agree with the fertilizer subsidy’s payment method?
1. Agree
2. Fair agree
3. Disagree
4.6How do you appreciate the voucher program?
1. Excellent
2. Very good
3. Good
59. 46
4. Fair
5. Constraints and suggestions of maize farmers to the voucher program
through fertilizers subsidy.
4.1 what are the constraints
Inputs delaying
Repayment of fertilizers subsidy
Insufficient of fertilizers subsidy
Lack of investment for the farmers
Long transport fees of fertilizers subsidy from the stock
High fertilizers subsidy cost
Low yield
Climate change
Low skills of farmers
4.2 What is your suggestion for better implementation of fertilizers subsidy?
...............................................................................................................................
Thank you!