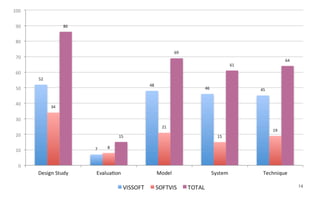
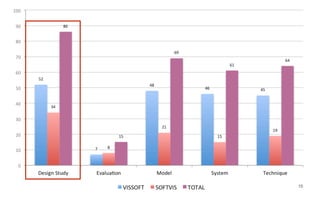
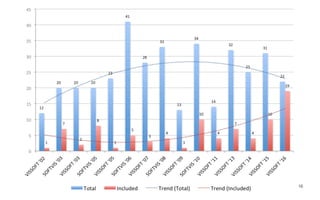
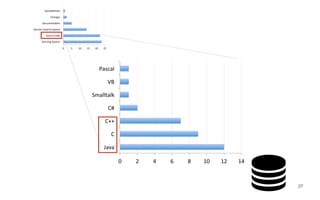
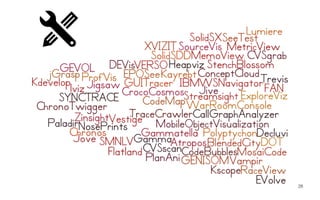
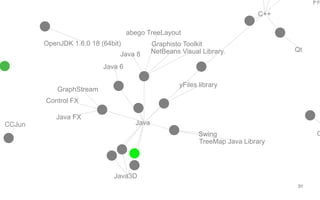
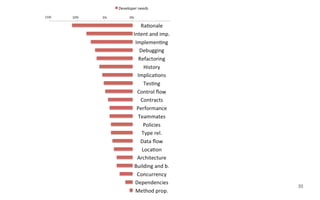
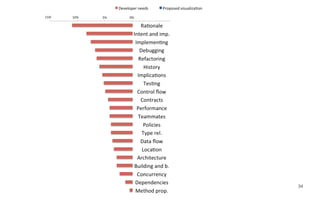
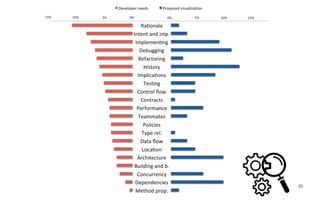
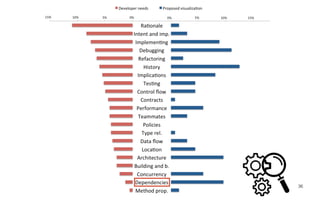
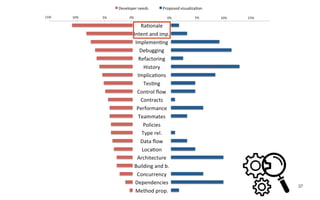
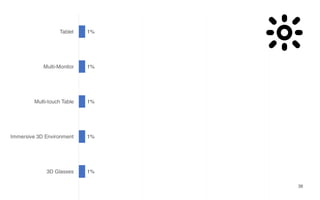
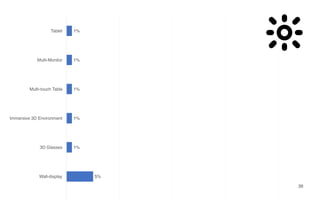
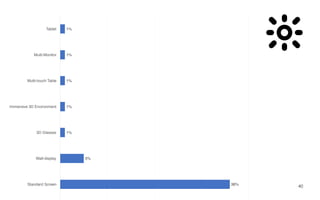
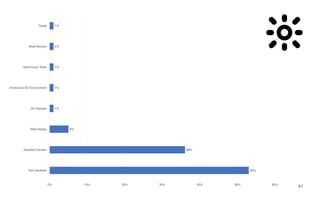
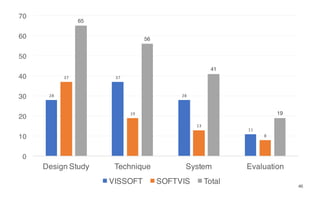
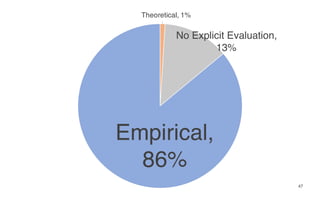
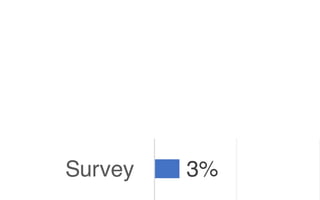
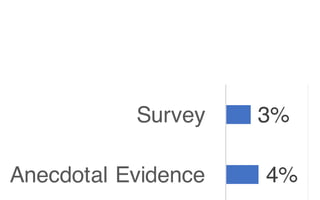
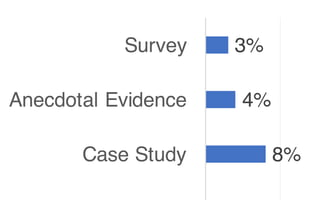
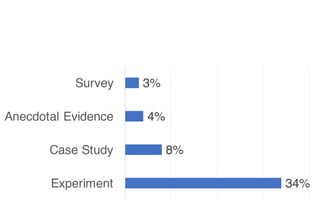
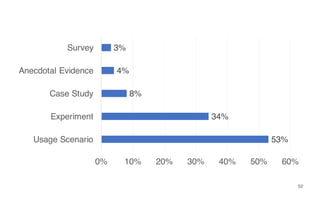
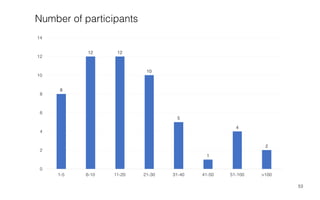
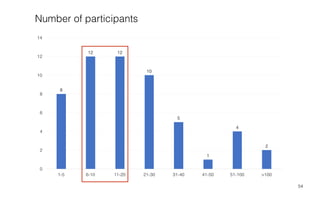
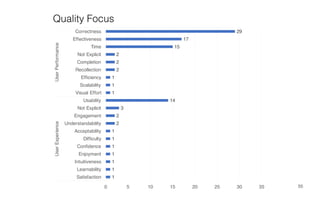
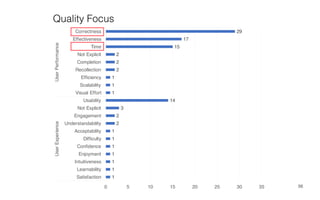
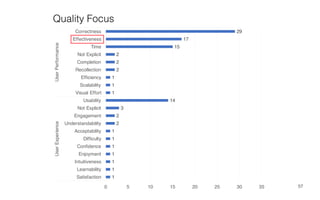
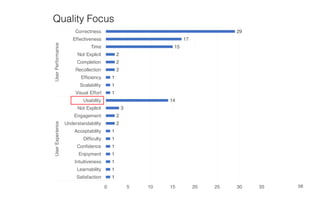
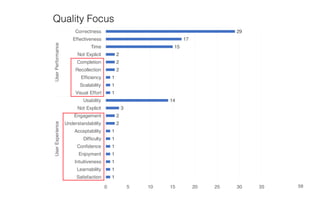
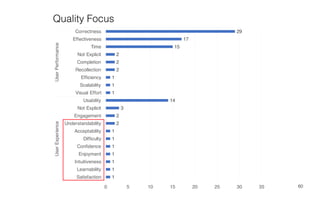
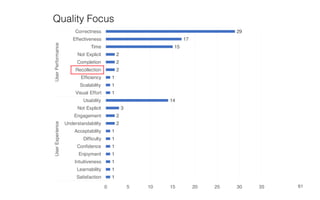
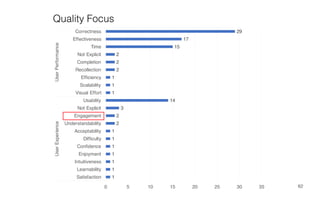
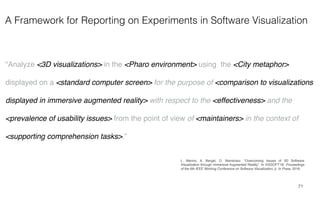
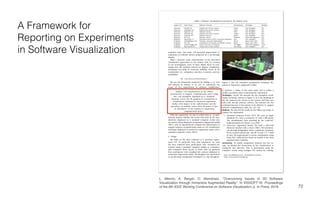
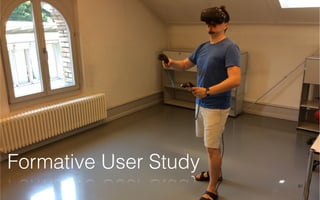
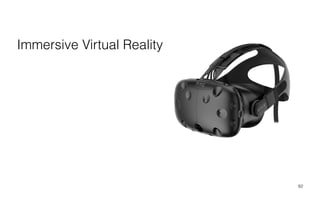
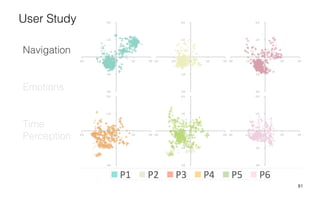
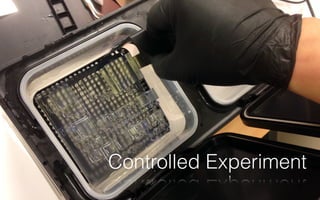
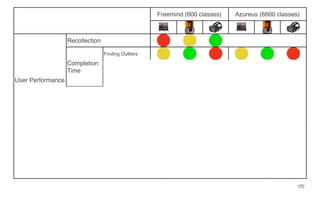
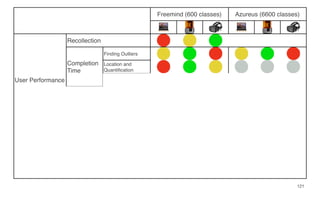
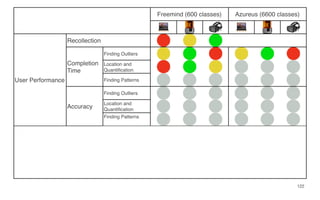
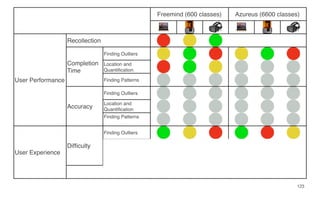
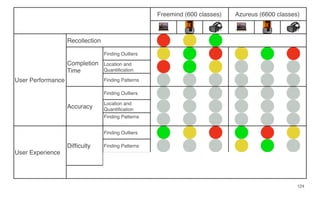
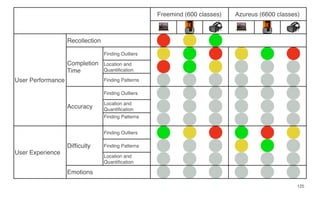
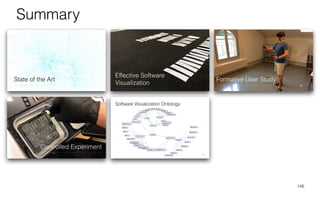
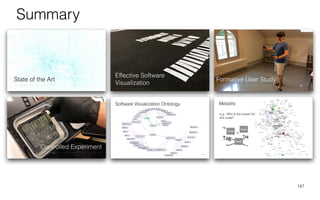
1
Leonel Merino
PhD Defense
Supervisor
Prof. Dr. Oscar Nierstrasz
29 June 2018
The Medium of Visualization
for Software Comprehension
2
Price et. al. ‘92
“Software visualization is the use of graphics to enhance
program understanding”
“To increase the effectiveness of software visualization tools, we need to
consider the impact of the medium in user performance and experience.”
Thesis
3
4
The medium has proved useful to increase the
effectiveness of visualizations in other domains
5
The CAVE medium
6
The CAVE medium to visualize neural networks
6
The CAVE medium to visualize neural networks
8
Education expenses visualized
using 3D Printed Models
8
Education expenses visualized
using 3D Printed Models
10
Visualization of voting data displayed
in an Immersive Virtual Reality
10
Visualization of voting data displayed
in an Immersive Virtual Reality
12
What is the medium of software visualizations?
State of the Art
14
15
16
e.g., maintenance
17
e.g., maintenance e.g., QA Engineer
18
e.g., maintenance e.g., QA Engineer
e.g., source code
19
e.g., maintenance
e.g., dense pixel
e.g., QA Engineer
e.g., source code
20
e.g., maintenance
e.g., wall display
e.g., dense pixel
e.g., QA Engineer
e.g., source code
21
e.g., lviz
e.g., maintenance
e.g., wall display
e.g., dense pixel
e.g., QA Engineer
e.g., source code
22
23
0	 5	 10	 15	 20	 25	
Running	System		
Source	Code		
Version	Control	System		
Documenta:on		
Changes		
Spreadsheets		
23
0	 5	 10	 15	 20	 25	
Running	System		
Source	Code		
Version	Control	System		
Documenta:on		
Changes		
Spreadsheets		
23
0	 2	 4	 6	 8	 10	 12	 14	
Java	
C	
C++	
C#	
Smalltalk	
VB	
Pascal	
0	 5	 10	 15	 20	 25	
Running	System		
Source	Code		
Version	Control	System		
Documenta:on		
Changes		
Spreadsheets		
26
0	 2	 4	 6	 8	 10	 12	 14	
Java	
C	
C++	
C#	
Smalltalk	
VB	
Pascal	
0	 5	 10	 15	 20	 25	
Running	System		
Source	Code		
Version	Control	System		
Documenta:on		
Changes		
Spreadsheets		
27
28
OpenGL
GLUT
Globsym
wxWidgets
Extractor
D3
OpenCloud
VR Juggler
G4P
Roassal
MT4j
FTGL
Viewer
JFreeChart
29
OpenGL
NetBeans Visual Library.
GLUT
Java 8
Globsym
wxWidgets
Extractor
OpenCloud
C++
VR Juggler
G4P
Roassal
Eclipse Visualization Toolkit (Zest)
Graphisto ToolkitOpenJDK 1.6.0 18 (64bit)
wxWindows
FTGL
FreeType
Viewer
abego TreeLayout
Qt
JFreeChart
30
NetBeans Visual Library.Java 8
Java
Control FX
Java3D
Java FX
C++
Graphisto ToolkitOpenJDK 1.6.0 18 (64bit)
TreeMap Java Library
GraphStream
Java 6
G
Fre
abego TreeLayout
yFiles library
Qt
CCJun
Swing
31
OpenGL
NetBeans Visual Library.
GLUT
Java 8
Stencil visualization environment
Prefuse toolkit
Java
Globsym
Control FX
wxWidgets
Extractor
Java3D
D3
OpenCloud
Java FX
C++
VR Juggler
G4P
dot
Roassal
Eclipse Visualization Toolkit (Zest)
Graphisto ToolkitOpenJDK 1.6.0 18 (64bit)
wxWindows
TreeMap Java Library
GraphStream
Java 6
MT4j
GraphViz
Palantir
FTGL
FreeType
Viewer
abego TreeLayout
Trevis
yFiles library
Qt
jMonkeyEngine
JFreeChart
CCJun
Swing
32
33
solutions
34
35
36
37
1%
1%
1%
1%
1%
3D Glasses
Immersive 3D Environment
Multi-touch Table
Multi-Monitor
Tablet
38
5%
1%
1%
1%
1%
1%
Wall-display
3D Glasses
Immersive 3D Environment
Multi-touch Table
Multi-Monitor
Tablet
39
36%
5%
1%
1%
1%
1%
1%
Standard Screen
Wall-display
3D Glasses
Immersive 3D Environment
Multi-touch Table
Multi-Monitor
Tablet
40
53%
36%
5%
1%
1%
1%
1%
1%
0% 10% 20% 30% 40% 50% 60%
Not Identified
Standard Screen
Wall-display
3D Glasses
Immersive 3D Environment
Multi-touch Table
Multi-Monitor
Tablet
41
42
The medium has not been considered a relevant
factor in the effectiveness of software visualizations
The medium has not been considered a relevant
factor in the effectiveness of software visualizations
43
What is an effective software visualization?
The medium has not been considered a relevant
factor in the effectiveness of software visualizations
44
What is an effective software visualization?
How suitable is this definition of effectiveness to
evaluate software visualizations?
Effective Software
Visualization
28
37
28
11
37
19
13
8
65
56
41
19
Design Study Technique System Evaluation
0
10
20
30
40
50
60
70
VISSOFT SOFTVIS Total 46
47
Theoretical, 1%
No Explicit Evaluation,
13%
Empirical,
86%
48
3%Survey
49
4%
3%
Anecdotal Evidence
Survey
50
8%
4%
3%
Case Study
Anecdotal Evidence
Survey
5134%
8%
4%
3%
Experiment
Case Study
Anecdotal Evidence
Survey
52
53%
34%
8%
4%
3%
0% 10% 20% 30% 40% 50% 60%
Usage Scenario
Experiment
Case Study
Anecdotal Evidence
Survey
53
8
12 12
10
5
1
4
2
0
2
4
6
8
10
12
14
1-5 6-10 11-20 21-30 31-40 41-50 51-100 >100
Number of participants
54
8
12 12
10
5
1
4
2
0
2
4
6
8
10
12
14
1-5 6-10 11-20 21-30 31-40 41-50 51-100 >100
Number of participants
55
1
1
1
1
1
1
1
2
2
3
14
1
1
1
2
2
2
15
17
29
0 5 10 15 20 25 30 35
Satisfaction
Learnability
Intuitiveness
Enjoyment
Confidence
Difficulty
Acceptability
Understandability
Engagement
Not Explicit
Usability
Visual Effort
Scalability
Efficiency
Recollection
Completion
Not Explicit
Time
Effectiveness
Correctness
UserExperienceUserPerformance
Quality Focus
1
1
1
1
1
1
1
2
2
3
14
1
1
1
2
2
2
15
17
29
0 5 10 15 20 25 30 35
Satisfaction
Learnability
Intuitiveness
Enjoyment
Confidence
Difficulty
Acceptability
Understandability
Engagement
Not Explicit
Usability
Visual Effort
Scalability
Efficiency
Recollection
Completion
Not Explicit
Time
Effectiveness
Correctness
UserExperienceUserPerformance
56
Quality Focus
57
1
1
1
1
1
1
1
2
2
3
14
1
1
1
2
2
2
15
17
29
0 5 10 15 20 25 30 35
Satisfaction
Learnability
Intuitiveness
Enjoyment
Confidence
Difficulty
Acceptability
Understandability
Engagement
Not Explicit
Usability
Visual Effort
Scalability
Efficiency
Recollection
Completion
Not Explicit
Time
Effectiveness
Correctness
UserExperienceUserPerformance
Quality Focus
58
1
1
1
1
1
1
1
2
2
3
14
1
1
1
2
2
2
15
17
29
0 5 10 15 20 25 30 35
Satisfaction
Learnability
Intuitiveness
Enjoyment
Confidence
Difficulty
Acceptability
Understandability
Engagement
Not Explicit
Usability
Visual Effort
Scalability
Efficiency
Recollection
Completion
Not Explicit
Time
Effectiveness
Correctness
UserExperienceUserPerformance
Quality Focus
59
1
1
1
1
1
1
1
2
2
3
14
1
1
1
2
2
2
15
17
29
0 5 10 15 20 25 30 35
Satisfaction
Learnability
Intuitiveness
Enjoyment
Confidence
Difficulty
Acceptability
Understandability
Engagement
Not Explicit
Usability
Visual Effort
Scalability
Efficiency
Recollection
Completion
Not Explicit
Time
Effectiveness
Correctness
UserExperienceUserPerformance
Quality Focus
60
1
1
1
1
1
1
1
2
2
3
14
1
1
1
2
2
2
15
17
29
0 5 10 15 20 25 30 35
Satisfaction
Learnability
Intuitiveness
Enjoyment
Confidence
Difficulty
Acceptability
Understandability
Engagement
Not Explicit
Usability
Visual Effort
Scalability
Efficiency
Recollection
Completion
Not Explicit
Time
Effectiveness
Correctness
UserExperienceUserPerformance
Quality Focus
61
1
1
1
1
1
1
1
2
2
3
14
1
1
1
2
2
2
15
17
29
0 5 10 15 20 25 30 35
Satisfaction
Learnability
Intuitiveness
Enjoyment
Confidence
Difficulty
Acceptability
Understandability
Engagement
Not Explicit
Usability
Visual Effort
Scalability
Efficiency
Recollection
Completion
Not Explicit
Time
Effectiveness
Correctness
UserExperienceUserPerformance
Quality Focus
62
1
1
1
1
1
1
1
2
2
3
14
1
1
1
2
2
2
15
17
29
0 5 10 15 20 25 30 35
Satisfaction
Learnability
Intuitiveness
Enjoyment
Confidence
Difficulty
Acceptability
Understandability
Engagement
Not Explicit
Usability
Visual Effort
Scalability
Efficiency
Recollection
Completion
Not Explicit
Time
Effectiveness
Correctness
UserExperienceUserPerformance
Quality Focus
A Framework for Reporting on Experiments in Software Visualization
63
“Analyze <3D visualizations> in the <Pharo environment> using the <City metaphor>
displayed on a <standard computer screen> for the purpose of <comparison to visualizations
displayed in immersive augmented reality> with respect to the <effectiveness> and the
<prevalence of usability issues> from the point of view of <maintainers> in the context of
<supporting comprehension tasks>.”
L. Merino, A. Bergel, O. Nierstrasz. “Overcoming Issues of 3D Software
Visualization through Immersive Augmented Reality”. In VISSOFT'18: Proceedings
of the 6th IEEE Working Conference on Software Visualization, p. In Press, 2018.
A Framework for Reporting on Experiments in Software Visualization
64
“Analyze <3D visualizations> in the <Pharo environment> using the <City metaphor>
displayed on a <standard computer screen> for the purpose of <comparison to visualizations
displayed in immersive augmented reality> with respect to the <effectiveness> and the
<prevalence of usability issues> from the point of view of <maintainers> in the context of
<supporting comprehension tasks>.”
L. Merino, A. Bergel, O. Nierstrasz. “Overcoming Issues of 3D Software
Visualization through Immersive Augmented Reality”. In VISSOFT'18: Proceedings
of the 6th IEEE Working Conference on Software Visualization, p. In Press, 2018.
A Framework for Reporting on Experiments in Software Visualization
65
“Analyze <3D visualizations> in the <Pharo environment> using the <City metaphor>
displayed on a <standard computer screen> for the purpose of <comparison to visualizations
displayed in immersive augmented reality> with respect to the <effectiveness> and the
<prevalence of usability issues> from the point of view of <maintainers> in the context of
<supporting comprehension tasks>.”
L. Merino, A. Bergel, O. Nierstrasz. “Overcoming Issues of 3D Software
Visualization through Immersive Augmented Reality”. In VISSOFT'18: Proceedings
of the 6th IEEE Working Conference on Software Visualization, p. In Press, 2018.
A Framework for Reporting on Experiments in Software Visualization
66
“Analyze <3D visualizations> in the <Pharo environment> using the <City metaphor>
displayed on a <standard computer screen> for the purpose of <comparison to visualizations
displayed in immersive augmented reality> with respect to the <effectiveness> and the
<prevalence of usability issues> from the point of view of <maintainers> in the context of
<supporting comprehension tasks>.”
L. Merino, A. Bergel, O. Nierstrasz. “Overcoming Issues of 3D Software
Visualization through Immersive Augmented Reality”. In VISSOFT'18: Proceedings
of the 6th IEEE Working Conference on Software Visualization, p. In Press, 2018.
A Framework for Reporting on Experiments in Software Visualization
67
“Analyze <3D visualizations> in the <Pharo environment> using the <City metaphor>
displayed on a <standard computer screen> for the purpose of <comparison to visualizations
displayed in immersive augmented reality> with respect to the <effectiveness> and the
<prevalence of usability issues> from the point of view of <maintainers> in the context of
<supporting comprehension tasks>.”
L. Merino, A. Bergel, O. Nierstrasz. “Overcoming Issues of 3D Software
Visualization through Immersive Augmented Reality”. In VISSOFT'18: Proceedings
of the 6th IEEE Working Conference on Software Visualization, p. In Press, 2018.
A Framework for Reporting on Experiments in Software Visualization
68
“Analyze <3D visualizations> in the <Pharo environment> using the <City metaphor>
displayed on a <standard computer screen> for the purpose of <comparison to visualizations
displayed in immersive augmented reality> with respect to the <effectiveness> and the
<prevalence of usability issues> from the point of view of <maintainers> in the context of
<supporting comprehension tasks>.”
L. Merino, A. Bergel, O. Nierstrasz. “Overcoming Issues of 3D Software
Visualization through Immersive Augmented Reality”. In VISSOFT'18: Proceedings
of the 6th IEEE Working Conference on Software Visualization, p. In Press, 2018.
A Framework for Reporting on Experiments in Software Visualization
69
“Analyze <3D visualizations> in the <Pharo environment> using the <City metaphor>
displayed on a <standard computer screen> for the purpose of <comparison to visualizations
displayed in immersive augmented reality> with respect to the <effectiveness> and the
<prevalence of usability issues> from the point of view of <maintainers> in the context of
<supporting comprehension tasks>.”
L. Merino, A. Bergel, O. Nierstrasz. “Overcoming Issues of 3D Software
Visualization through Immersive Augmented Reality”. In VISSOFT'18: Proceedings
of the 6th IEEE Working Conference on Software Visualization, p. In Press, 2018.
A Framework for Reporting on Experiments in Software Visualization
70
“Analyze <3D visualizations> in the <Pharo environment> using the <City metaphor>
displayed on a <standard computer screen> for the purpose of <comparison to visualizations
displayed in immersive augmented reality> with respect to the <effectiveness> and the
<prevalence of usability issues> from the point of view of <maintainers> in the context of
<supporting comprehension tasks>.”
L. Merino, A. Bergel, O. Nierstrasz. “Overcoming Issues of 3D Software
Visualization through Immersive Augmented Reality”. In VISSOFT'18: Proceedings
of the 6th IEEE Working Conference on Software Visualization, p. In Press, 2018.
A Framework for Reporting on Experiments in Software Visualization
71
“Analyze <3D visualizations> in the <Pharo environment> using the <City metaphor>
displayed on a <standard computer screen> for the purpose of <comparison to visualizations
displayed in immersive augmented reality> with respect to the <effectiveness> and the
<prevalence of usability issues> from the point of view of <maintainers> in the context of
<supporting comprehension tasks>.”
L. Merino, A. Bergel, O. Nierstrasz. “Overcoming Issues of 3D Software
Visualization through Immersive Augmented Reality”. In VISSOFT'18: Proceedings
of the 6th IEEE Working Conference on Software Visualization, p. In Press, 2018.
A Framework for
Reporting on Experiments
in Software Visualization
72
L. Merino, A. Bergel, O. Nierstrasz. “Overcoming Issues of 3D Software
Visualization through Immersive Augmented Reality”. In VISSOFT'18: Proceedings
of the 6th IEEE Working Conference on Software Visualization, p. In Press, 2018.
73
Explicit goal of evaluations
Experiments’ tasks must be in-line with evaluations’ goal
Use (our) framework to report on experiments in software visualization
Take-Home Messages
74
Explicit goal of evaluations
Experiments’ tasks must be in-line with evaluations’ goal
Use (our) framework to report on experiments in software visualization
Take-Home Messages
75
Explicit goal of evaluations
Experiments’ tasks must be in-line with evaluations’ goal
Use (our) framework to report on experiments in software visualization
Take-Home Messages
76
Explicit goal of evaluations
Experiments’ tasks must be in-line with evaluations’ goal
Use (our) framework to report on experiments in software
visualization
Take-Home Messages
77
L.Merino, M.Ghafari, O.Nierstrasz, “Towards
Actionable Visualization in Software Development”, in
VISSOFT’16: Proceedings of the 4th IEEE Working
Conference on Software Visualization. IEEE, 2016.
(Best paper award)
L. Merino, M. Ghafari, and O. Nierstrasz, “Towards
Actionable Visualization for Software Developers”. In
Journal of Software: Evolution and Process 30(2) p.
e1923—n/a, 2017.
L. Merino, M. Ghafari, C. Anslow, and O. Nierstrasz.
“A systematic literature review of software
visualization evaluation”. The Journal of Systems
and Software, 2018. To appear.
The medium has not been considered a relevant
factor in the effectiveness of software visualizations
78
The medium has not been considered a relevant
factor in the effectiveness of software visualizations
79
What is an effective software visualization?
The medium has not been considered a relevant
factor in the effectiveness of software visualizations
80
What is an effective software visualization?
How can the medium help to increase the
effectiveness of software visualizations?
81
Formative User Study
82
Immersive Virtual Reality
83
Immersive Virtual Reality
Promotes engagement
Commonly available
84
City metaphor
85
Widely used
Transferable to other media
Publicly available
City metaphor
86
Widely used
Transferable to other media
Publicly available
City metaphor
87
Widely used
Transferable to other media
Publicly available
City metaphor
NOM
NOA NLOC
88
Widely used
Transferable to other media
Publicly available
City metaphor
89
City metaphor
3 mts.
3 mts.
2.5 mts.
91
User Study
Navigation
Emotions
Time
Perception
92
“nice to walk” • curious
• immersed
• in control
• challenged
Navigation
Emotions
Time
Perception
User Study
93
Navigation
Emotions
Time
Perception
User Study
“time flown very fast”
The immersive virtual reality medium might be used to
promote engagement in software visualization
94
95
How does using different media for software
visualization affects their effectiveness?
The immersive virtual reality medium might be used to
promote engagement in software visualization
96
Controlled Experiment
97
98
99
100
101
102
103
Visualization CodeCity in Moose 5
Apparatus
Apple MacBook Pro with a
resolution of 1440 x 900 pixels
Location Konstanz (4) + Bern (5)
Participants 1 PostDoc, 3 BA/MA, 5 PhD
Subject Freemind, Azureus
Deployment: SCS
104
Deployment: I3D
Visualization Custom development in Unity 5.5
Apparatus
HTC Vive VR Headset with a
2160 x 1200 combined
resolution, 90 Hz refresh rate and
110° field of view
Location Konstanz (9)
Participants 1 PostDoc, 3 BA/MA, 5 PhD
Subject Freemind, Azureus
105
Visualization
Model exported to the Stereo
Lithography (STL) format from
the I3D implementation (in Unity)
required by the printer using the
pb_Stl library
Apparatus
Form 2 3D printer by formlabs
based on stereolithography
(SLA) technology
Location Bern (9)
Participants 1 PostDoc, 3 BA/MA, 5 PhD
Subject Freemind, Azureus
106
107
108
109
110
Visualization
Model exported to the Stereo
Lithography (STL) format from
the I3D implementation (in Unity)
required by the printer using the
pb_Stl library
Apparatus
Form 2 3D printer by formlabs
based on stereolithography
(SLA) technology
Location Bern (9)
Participants 1 PostDoc, 3 BA/MA, 5 PhD
Subject Freemind, Azureus
111
Virtual Reality Computer Screen 3D Printed
112
Data Collection
User
Performance
Time
Correctness
Recollection
User
Experience
Difficulty
Emotions
113
Data Collection
User
Performance
Time
Correctness
Recollection
User
Experience
Difficulty
Emotions
114
Data Collection
User
Performance
Time
Video recordings / questionnaires
Correctness
Recollection
User
Experience
Difficulty
Emotions
115
Data Collection
User
Performance
Time
Video recordings / questionnaires
Correctness
Recollection
User
Experience
Difficulty
Emotions
116
Data Collection
User
Performance
Time
Video recording / questionnaire
Correctness
Recollection Drawing
User
Experience
Difficulty Questionnaire (5-step Likert scale)
Emotions
117
Data Collection
User
Performance
Time
Video recording / questionnaire
Correctness
Recollection Drawing
User
Experience
Difficulty Questionnaire (5-step Likert scale)
Emotions
Freemind (600 classes) Azureus (6600 classes)
User Performance
Recollection
Completion
Time
Finding Outliers
Location and
Quantification
Finding Patterns
Accuracy
Finding Outliers
Location and
Quantification
Finding Patterns
User Experience
Difficulty
Finding Outliers
Finding Patterns
Location and
Quantification
Emotions
118
Freemind (600 classes) Azureus (6600 classes)
User Performance
Recollection
Completion
Time
Finding Outliers
Location and
Quantification
Finding Patterns
Accuracy
Finding Outliers
Location and
Quantification
Finding Patterns
User Experience
Difficulty
Finding Outliers
Finding Patterns
Location and
Quantification
Emotions
119
Freemind (600 classes) Azureus (6600 classes)
User Performance
Recollection
Completion
Time
Finding Outliers
Location and
Quantification
Finding Patterns
Accuracy
Finding Outliers
Location and
Quantification
Finding Patterns
User Experience
Difficulty
Finding Outliers
Finding Patterns
Location and
Quantification
Emotions
120
Freemind (600 classes) Azureus (6600 classes)
User Performance
Recollection
Completion
Time
Finding Outliers
Location and
Quantification
Finding Patterns
Accuracy
Finding Outliers
Location and
Quantification
Finding Patterns
User Experience
Difficulty
Finding Outliers
Finding Patterns
Location and
Quantification
Emotions
121
Freemind (600 classes) Azureus (6600 classes)
User Performance
Recollection
Completion
Time
Finding Outliers
Location and
Quantification
Finding Patterns
Accuracy
Finding Outliers
Location and
Quantification
Finding Patterns
User Experience
Difficulty
Finding Outliers
Finding Patterns
Location and
Quantification
Emotions
122
Freemind (600 classes) Azureus (6600 classes)
User Performance
Recollection
Completion
Time
Finding Outliers
Location and
Quantification
Finding Patterns
Accuracy
Finding Outliers
Location and
Quantification
Finding Patterns
User Experience
Difficulty
Finding Outliers
Finding Patterns
Location and
Quantification
Emotions
123
Freemind (600 classes) Azureus (6600 classes)
User Performance
Recollection
Completion
Time
Finding Outliers
Location and
Quantification
Finding Patterns
Accuracy
Finding Outliers
Location and
Quantification
Finding Patterns
User Experience
Difficulty
Finding Outliers
Finding Patterns
Location and
Quantification
Emotions
124
Freemind (600 classes) Azureus (6600 classes)
User Performance
Recollection
Completion
Time
Finding Outliers
Location and
Quantification
Finding Patterns
Accuracy
Finding Outliers
Location and
Quantification
Finding Patterns
User Experience
Difficulty
Finding Outliers
Finding Patterns
Location and
Quantification
Emotions
125
126
L. Merino, J. Fuchs, M. Blumenschein, C. Anslow, M. Ghafari, O. Nierstrasz,
M. Behrisch, and D. Keim. On the Impact of the Medium in the Effectiveness
of 3D Software Visualization. In VISSOFT'17: Proceedings of the 5th IEEE
Working Conference on Software Visualization, p. 11—21, IEEE, 2017.
L. Merino, M. Ghafari, C. Anslow, and O. Nierstrasz. CityVR: Gameful
Software Visualization. In ICSME'17: Proceedings of the 33rd IEEE
International Conference on Software Maintenance and Evolution (TD
Track), p. 633—637, IEEE, 2017.
127
How do the insights from the reviews and
experiments can be encapsulated?
128
How do the insights from the reviews and
experiments can be encapsulated?
How can developers find suitable visualizations
for particular tasks?
129
2003
2017
Tools
130
2003
2017
Medium
Technique
URL
Task
Audience
Questions
Data
Visualization
Tools
131
2003
2017
Medium
Technique
URL
Task
Audience
Questions
Data
Case Study
Experiment
Usage Scenario
Participants
Systems
Apparatus
Test
Survey
Tools
Visualization Evaluation
132
Software Visualization Ontology
133
Software Visualization Ontology
Metrics #
Axiom 3290
Logic. axioms 2428
Decl. axioms 862
Class count 150
Object prop. 20
Individuals 692
DL expr. ALCH
SubClassOf 143
DisjointClasses 32
SubObjectPropert 1
Obj.Prp.Dom. 2
Obj.Prp.Ran. 3
ClassAssert. 696
Obj.Prp.Asse. 1547
NegativeObjectPr 4
134
MetaVis
Tag	
Tag	
Tag	
Tag	
Tag	
Tag	
Example	
Example	
Tag	
Example	
e.g., Who is the expert for this code?
135
MetaVis
Tag	
Tag	
Tag	
Tag	
Tag	
Tag	
Example	
Example	
Tag	
Example	
e.g., Who is the expert for
this code?
137
MetaVis
Leonel Merino, Mohammad Ghafari, Oscar Nierstrasz, Alexandre
Bergel, and Juraj Kubelka, “MetaVis: Exploring Actionable
Visualization”. In VISSOFT'16: Proceedings of the 4th IEEE Working
Conference on Software Visualization, IEEE, 2016.
Future work
Experimentation in software visualization
displayed in VR & AR
138
Future work
Experimentation in software visualization
displayed in VR & AR
139
Future work
Experimentation in software visualization
displayed in VR & AR
An ontology-based recommender system for
software visualization tools
140
141
Summary
142
Summary
143
Summary
144
Summary
145
Summary
146
Summary
147
Summary
“To increase the effectiveness of software visualization tools, we need to
consider the impact of the medium in user performance and experience.”
Summary
… and …
149
Speculative lightweight visualizations based on
automatic scripts analysis
150
Speculative lightweight visualizations based on
the analysis of scripts
151
Speculative lightweight visualizations based on
the analysis of scripts
152

The Medium of Visualization for Software Comprehension

  • 1.
    1 Leonel Merino PhD Defense Supervisor Prof.Dr. Oscar Nierstrasz 29 June 2018 The Medium of Visualization for Software Comprehension
  • 2.
    2 Price et. al.‘92 “Software visualization is the use of graphics to enhance program understanding”
  • 3.
    “To increase theeffectiveness of software visualization tools, we need to consider the impact of the medium in user performance and experience.” Thesis 3
  • 4.
    4 The medium hasproved useful to increase the effectiveness of visualizations in other domains
  • 5.
  • 6.
    6 The CAVE mediumto visualize neural networks
  • 7.
    6 The CAVE mediumto visualize neural networks
  • 8.
  • 9.
  • 10.
    10 Visualization of votingdata displayed in an Immersive Virtual Reality
  • 11.
    10 Visualization of votingdata displayed in an Immersive Virtual Reality
  • 12.
    12 What is themedium of software visualizations?
  • 13.
  • 14.
  • 15.
  • 16.
  • 17.
  • 18.
  • 19.
    e.g., maintenance e.g.,QA Engineer e.g., source code 19
  • 20.
    e.g., maintenance e.g., densepixel e.g., QA Engineer e.g., source code 20
  • 21.
    e.g., maintenance e.g., walldisplay e.g., dense pixel e.g., QA Engineer e.g., source code 21
  • 22.
    e.g., lviz e.g., maintenance e.g.,wall display e.g., dense pixel e.g., QA Engineer e.g., source code 22
  • 23.
  • 24.
    0 5 10 15 20 25 Running System Source Code Version Control System Documenta:on Changes Spreadsheets 23
  • 25.
    0 5 10 15 20 25 Running System Source Code Version Control System Documenta:on Changes Spreadsheets 23
  • 26.
    0 2 4 6 8 10 12 14 Java C C++ C# Smalltalk VB Pascal 0 5 10 15 20 25 Running System Source Code Version Control System Documenta:on Changes Spreadsheets 26
  • 27.
    0 2 4 6 8 10 12 14 Java C C++ C# Smalltalk VB Pascal 0 5 10 15 20 25 Running System Source Code Version Control System Documenta:on Changes Spreadsheets 27
  • 28.
  • 29.
  • 30.
    OpenGL NetBeans Visual Library. GLUT Java8 Globsym wxWidgets Extractor OpenCloud C++ VR Juggler G4P Roassal Eclipse Visualization Toolkit (Zest) Graphisto ToolkitOpenJDK 1.6.0 18 (64bit) wxWindows FTGL FreeType Viewer abego TreeLayout Qt JFreeChart 30
  • 31.
    NetBeans Visual Library.Java8 Java Control FX Java3D Java FX C++ Graphisto ToolkitOpenJDK 1.6.0 18 (64bit) TreeMap Java Library GraphStream Java 6 G Fre abego TreeLayout yFiles library Qt CCJun Swing 31
  • 32.
    OpenGL NetBeans Visual Library. GLUT Java8 Stencil visualization environment Prefuse toolkit Java Globsym Control FX wxWidgets Extractor Java3D D3 OpenCloud Java FX C++ VR Juggler G4P dot Roassal Eclipse Visualization Toolkit (Zest) Graphisto ToolkitOpenJDK 1.6.0 18 (64bit) wxWindows TreeMap Java Library GraphStream Java 6 MT4j GraphViz Palantir FTGL FreeType Viewer abego TreeLayout Trevis yFiles library Qt jMonkeyEngine JFreeChart CCJun Swing 32
  • 33.
  • 34.
  • 35.
  • 36.
  • 37.
  • 38.
    1% 1% 1% 1% 1% 3D Glasses Immersive 3DEnvironment Multi-touch Table Multi-Monitor Tablet 38
  • 39.
    5% 1% 1% 1% 1% 1% Wall-display 3D Glasses Immersive 3DEnvironment Multi-touch Table Multi-Monitor Tablet 39
  • 40.
    36% 5% 1% 1% 1% 1% 1% Standard Screen Wall-display 3D Glasses Immersive3D Environment Multi-touch Table Multi-Monitor Tablet 40
  • 41.
    53% 36% 5% 1% 1% 1% 1% 1% 0% 10% 20%30% 40% 50% 60% Not Identified Standard Screen Wall-display 3D Glasses Immersive 3D Environment Multi-touch Table Multi-Monitor Tablet 41
  • 42.
    42 The medium hasnot been considered a relevant factor in the effectiveness of software visualizations
  • 43.
    The medium hasnot been considered a relevant factor in the effectiveness of software visualizations 43 What is an effective software visualization?
  • 44.
    The medium hasnot been considered a relevant factor in the effectiveness of software visualizations 44 What is an effective software visualization? How suitable is this definition of effectiveness to evaluate software visualizations?
  • 45.
  • 46.
    28 37 28 11 37 19 13 8 65 56 41 19 Design Study TechniqueSystem Evaluation 0 10 20 30 40 50 60 70 VISSOFT SOFTVIS Total 46
  • 47.
    47 Theoretical, 1% No ExplicitEvaluation, 13% Empirical, 86%
  • 48.
  • 49.
  • 50.
  • 51.
  • 52.
    52 53% 34% 8% 4% 3% 0% 10% 20%30% 40% 50% 60% Usage Scenario Experiment Case Study Anecdotal Evidence Survey
  • 53.
    53 8 12 12 10 5 1 4 2 0 2 4 6 8 10 12 14 1-5 6-1011-20 21-30 31-40 41-50 51-100 >100 Number of participants
  • 54.
    54 8 12 12 10 5 1 4 2 0 2 4 6 8 10 12 14 1-5 6-1011-20 21-30 31-40 41-50 51-100 >100 Number of participants
  • 55.
    55 1 1 1 1 1 1 1 2 2 3 14 1 1 1 2 2 2 15 17 29 0 5 1015 20 25 30 35 Satisfaction Learnability Intuitiveness Enjoyment Confidence Difficulty Acceptability Understandability Engagement Not Explicit Usability Visual Effort Scalability Efficiency Recollection Completion Not Explicit Time Effectiveness Correctness UserExperienceUserPerformance Quality Focus
  • 56.
    1 1 1 1 1 1 1 2 2 3 14 1 1 1 2 2 2 15 17 29 0 5 1015 20 25 30 35 Satisfaction Learnability Intuitiveness Enjoyment Confidence Difficulty Acceptability Understandability Engagement Not Explicit Usability Visual Effort Scalability Efficiency Recollection Completion Not Explicit Time Effectiveness Correctness UserExperienceUserPerformance 56 Quality Focus
  • 57.
    57 1 1 1 1 1 1 1 2 2 3 14 1 1 1 2 2 2 15 17 29 0 5 1015 20 25 30 35 Satisfaction Learnability Intuitiveness Enjoyment Confidence Difficulty Acceptability Understandability Engagement Not Explicit Usability Visual Effort Scalability Efficiency Recollection Completion Not Explicit Time Effectiveness Correctness UserExperienceUserPerformance Quality Focus
  • 58.
    58 1 1 1 1 1 1 1 2 2 3 14 1 1 1 2 2 2 15 17 29 0 5 1015 20 25 30 35 Satisfaction Learnability Intuitiveness Enjoyment Confidence Difficulty Acceptability Understandability Engagement Not Explicit Usability Visual Effort Scalability Efficiency Recollection Completion Not Explicit Time Effectiveness Correctness UserExperienceUserPerformance Quality Focus
  • 59.
    59 1 1 1 1 1 1 1 2 2 3 14 1 1 1 2 2 2 15 17 29 0 5 1015 20 25 30 35 Satisfaction Learnability Intuitiveness Enjoyment Confidence Difficulty Acceptability Understandability Engagement Not Explicit Usability Visual Effort Scalability Efficiency Recollection Completion Not Explicit Time Effectiveness Correctness UserExperienceUserPerformance Quality Focus
  • 60.
    60 1 1 1 1 1 1 1 2 2 3 14 1 1 1 2 2 2 15 17 29 0 5 1015 20 25 30 35 Satisfaction Learnability Intuitiveness Enjoyment Confidence Difficulty Acceptability Understandability Engagement Not Explicit Usability Visual Effort Scalability Efficiency Recollection Completion Not Explicit Time Effectiveness Correctness UserExperienceUserPerformance Quality Focus
  • 61.
    61 1 1 1 1 1 1 1 2 2 3 14 1 1 1 2 2 2 15 17 29 0 5 1015 20 25 30 35 Satisfaction Learnability Intuitiveness Enjoyment Confidence Difficulty Acceptability Understandability Engagement Not Explicit Usability Visual Effort Scalability Efficiency Recollection Completion Not Explicit Time Effectiveness Correctness UserExperienceUserPerformance Quality Focus
  • 62.
    62 1 1 1 1 1 1 1 2 2 3 14 1 1 1 2 2 2 15 17 29 0 5 1015 20 25 30 35 Satisfaction Learnability Intuitiveness Enjoyment Confidence Difficulty Acceptability Understandability Engagement Not Explicit Usability Visual Effort Scalability Efficiency Recollection Completion Not Explicit Time Effectiveness Correctness UserExperienceUserPerformance Quality Focus
  • 63.
    A Framework forReporting on Experiments in Software Visualization 63 “Analyze <3D visualizations> in the <Pharo environment> using the <City metaphor> displayed on a <standard computer screen> for the purpose of <comparison to visualizations displayed in immersive augmented reality> with respect to the <effectiveness> and the <prevalence of usability issues> from the point of view of <maintainers> in the context of <supporting comprehension tasks>.” L. Merino, A. Bergel, O. Nierstrasz. “Overcoming Issues of 3D Software Visualization through Immersive Augmented Reality”. In VISSOFT'18: Proceedings of the 6th IEEE Working Conference on Software Visualization, p. In Press, 2018.
  • 64.
    A Framework forReporting on Experiments in Software Visualization 64 “Analyze <3D visualizations> in the <Pharo environment> using the <City metaphor> displayed on a <standard computer screen> for the purpose of <comparison to visualizations displayed in immersive augmented reality> with respect to the <effectiveness> and the <prevalence of usability issues> from the point of view of <maintainers> in the context of <supporting comprehension tasks>.” L. Merino, A. Bergel, O. Nierstrasz. “Overcoming Issues of 3D Software Visualization through Immersive Augmented Reality”. In VISSOFT'18: Proceedings of the 6th IEEE Working Conference on Software Visualization, p. In Press, 2018.
  • 65.
    A Framework forReporting on Experiments in Software Visualization 65 “Analyze <3D visualizations> in the <Pharo environment> using the <City metaphor> displayed on a <standard computer screen> for the purpose of <comparison to visualizations displayed in immersive augmented reality> with respect to the <effectiveness> and the <prevalence of usability issues> from the point of view of <maintainers> in the context of <supporting comprehension tasks>.” L. Merino, A. Bergel, O. Nierstrasz. “Overcoming Issues of 3D Software Visualization through Immersive Augmented Reality”. In VISSOFT'18: Proceedings of the 6th IEEE Working Conference on Software Visualization, p. In Press, 2018.
  • 66.
    A Framework forReporting on Experiments in Software Visualization 66 “Analyze <3D visualizations> in the <Pharo environment> using the <City metaphor> displayed on a <standard computer screen> for the purpose of <comparison to visualizations displayed in immersive augmented reality> with respect to the <effectiveness> and the <prevalence of usability issues> from the point of view of <maintainers> in the context of <supporting comprehension tasks>.” L. Merino, A. Bergel, O. Nierstrasz. “Overcoming Issues of 3D Software Visualization through Immersive Augmented Reality”. In VISSOFT'18: Proceedings of the 6th IEEE Working Conference on Software Visualization, p. In Press, 2018.
  • 67.
    A Framework forReporting on Experiments in Software Visualization 67 “Analyze <3D visualizations> in the <Pharo environment> using the <City metaphor> displayed on a <standard computer screen> for the purpose of <comparison to visualizations displayed in immersive augmented reality> with respect to the <effectiveness> and the <prevalence of usability issues> from the point of view of <maintainers> in the context of <supporting comprehension tasks>.” L. Merino, A. Bergel, O. Nierstrasz. “Overcoming Issues of 3D Software Visualization through Immersive Augmented Reality”. In VISSOFT'18: Proceedings of the 6th IEEE Working Conference on Software Visualization, p. In Press, 2018.
  • 68.
    A Framework forReporting on Experiments in Software Visualization 68 “Analyze <3D visualizations> in the <Pharo environment> using the <City metaphor> displayed on a <standard computer screen> for the purpose of <comparison to visualizations displayed in immersive augmented reality> with respect to the <effectiveness> and the <prevalence of usability issues> from the point of view of <maintainers> in the context of <supporting comprehension tasks>.” L. Merino, A. Bergel, O. Nierstrasz. “Overcoming Issues of 3D Software Visualization through Immersive Augmented Reality”. In VISSOFT'18: Proceedings of the 6th IEEE Working Conference on Software Visualization, p. In Press, 2018.
  • 69.
    A Framework forReporting on Experiments in Software Visualization 69 “Analyze <3D visualizations> in the <Pharo environment> using the <City metaphor> displayed on a <standard computer screen> for the purpose of <comparison to visualizations displayed in immersive augmented reality> with respect to the <effectiveness> and the <prevalence of usability issues> from the point of view of <maintainers> in the context of <supporting comprehension tasks>.” L. Merino, A. Bergel, O. Nierstrasz. “Overcoming Issues of 3D Software Visualization through Immersive Augmented Reality”. In VISSOFT'18: Proceedings of the 6th IEEE Working Conference on Software Visualization, p. In Press, 2018.
  • 70.
    A Framework forReporting on Experiments in Software Visualization 70 “Analyze <3D visualizations> in the <Pharo environment> using the <City metaphor> displayed on a <standard computer screen> for the purpose of <comparison to visualizations displayed in immersive augmented reality> with respect to the <effectiveness> and the <prevalence of usability issues> from the point of view of <maintainers> in the context of <supporting comprehension tasks>.” L. Merino, A. Bergel, O. Nierstrasz. “Overcoming Issues of 3D Software Visualization through Immersive Augmented Reality”. In VISSOFT'18: Proceedings of the 6th IEEE Working Conference on Software Visualization, p. In Press, 2018.
  • 71.
    A Framework forReporting on Experiments in Software Visualization 71 “Analyze <3D visualizations> in the <Pharo environment> using the <City metaphor> displayed on a <standard computer screen> for the purpose of <comparison to visualizations displayed in immersive augmented reality> with respect to the <effectiveness> and the <prevalence of usability issues> from the point of view of <maintainers> in the context of <supporting comprehension tasks>.” L. Merino, A. Bergel, O. Nierstrasz. “Overcoming Issues of 3D Software Visualization through Immersive Augmented Reality”. In VISSOFT'18: Proceedings of the 6th IEEE Working Conference on Software Visualization, p. In Press, 2018.
  • 72.
    A Framework for Reportingon Experiments in Software Visualization 72 L. Merino, A. Bergel, O. Nierstrasz. “Overcoming Issues of 3D Software Visualization through Immersive Augmented Reality”. In VISSOFT'18: Proceedings of the 6th IEEE Working Conference on Software Visualization, p. In Press, 2018.
  • 73.
    73 Explicit goal ofevaluations Experiments’ tasks must be in-line with evaluations’ goal Use (our) framework to report on experiments in software visualization Take-Home Messages
  • 74.
    74 Explicit goal ofevaluations Experiments’ tasks must be in-line with evaluations’ goal Use (our) framework to report on experiments in software visualization Take-Home Messages
  • 75.
    75 Explicit goal ofevaluations Experiments’ tasks must be in-line with evaluations’ goal Use (our) framework to report on experiments in software visualization Take-Home Messages
  • 76.
    76 Explicit goal ofevaluations Experiments’ tasks must be in-line with evaluations’ goal Use (our) framework to report on experiments in software visualization Take-Home Messages
  • 77.
    77 L.Merino, M.Ghafari, O.Nierstrasz,“Towards Actionable Visualization in Software Development”, in VISSOFT’16: Proceedings of the 4th IEEE Working Conference on Software Visualization. IEEE, 2016. (Best paper award) L. Merino, M. Ghafari, and O. Nierstrasz, “Towards Actionable Visualization for Software Developers”. In Journal of Software: Evolution and Process 30(2) p. e1923—n/a, 2017. L. Merino, M. Ghafari, C. Anslow, and O. Nierstrasz. “A systematic literature review of software visualization evaluation”. The Journal of Systems and Software, 2018. To appear.
  • 78.
    The medium hasnot been considered a relevant factor in the effectiveness of software visualizations 78
  • 79.
    The medium hasnot been considered a relevant factor in the effectiveness of software visualizations 79 What is an effective software visualization?
  • 80.
    The medium hasnot been considered a relevant factor in the effectiveness of software visualizations 80 What is an effective software visualization? How can the medium help to increase the effectiveness of software visualizations?
  • 81.
  • 82.
  • 83.
    83 Immersive Virtual Reality Promotesengagement Commonly available
  • 84.
  • 85.
    85 Widely used Transferable toother media Publicly available City metaphor
  • 86.
    86 Widely used Transferable toother media Publicly available City metaphor
  • 87.
    87 Widely used Transferable toother media Publicly available City metaphor NOM NOA NLOC
  • 88.
    88 Widely used Transferable toother media Publicly available City metaphor
  • 89.
  • 91.
  • 92.
    92 “nice to walk”• curious • immersed • in control • challenged Navigation Emotions Time Perception User Study
  • 93.
  • 94.
    The immersive virtualreality medium might be used to promote engagement in software visualization 94
  • 95.
    95 How does usingdifferent media for software visualization affects their effectiveness? The immersive virtual reality medium might be used to promote engagement in software visualization
  • 96.
  • 97.
  • 98.
  • 99.
  • 100.
  • 101.
  • 102.
  • 103.
    103 Visualization CodeCity inMoose 5 Apparatus Apple MacBook Pro with a resolution of 1440 x 900 pixels Location Konstanz (4) + Bern (5) Participants 1 PostDoc, 3 BA/MA, 5 PhD Subject Freemind, Azureus Deployment: SCS
  • 104.
    104 Deployment: I3D Visualization Customdevelopment in Unity 5.5 Apparatus HTC Vive VR Headset with a 2160 x 1200 combined resolution, 90 Hz refresh rate and 110° field of view Location Konstanz (9) Participants 1 PostDoc, 3 BA/MA, 5 PhD Subject Freemind, Azureus
  • 105.
    105 Visualization Model exported tothe Stereo Lithography (STL) format from the I3D implementation (in Unity) required by the printer using the pb_Stl library Apparatus Form 2 3D printer by formlabs based on stereolithography (SLA) technology Location Bern (9) Participants 1 PostDoc, 3 BA/MA, 5 PhD Subject Freemind, Azureus
  • 106.
  • 107.
  • 108.
  • 109.
  • 110.
    110 Visualization Model exported tothe Stereo Lithography (STL) format from the I3D implementation (in Unity) required by the printer using the pb_Stl library Apparatus Form 2 3D printer by formlabs based on stereolithography (SLA) technology Location Bern (9) Participants 1 PostDoc, 3 BA/MA, 5 PhD Subject Freemind, Azureus
  • 111.
  • 112.
  • 113.
  • 114.
    114 Data Collection User Performance Time Video recordings/ questionnaires Correctness Recollection User Experience Difficulty Emotions
  • 115.
    115 Data Collection User Performance Time Video recordings/ questionnaires Correctness Recollection User Experience Difficulty Emotions
  • 116.
    116 Data Collection User Performance Time Video recording/ questionnaire Correctness Recollection Drawing User Experience Difficulty Questionnaire (5-step Likert scale) Emotions
  • 117.
    117 Data Collection User Performance Time Video recording/ questionnaire Correctness Recollection Drawing User Experience Difficulty Questionnaire (5-step Likert scale) Emotions
  • 118.
    Freemind (600 classes)Azureus (6600 classes) User Performance Recollection Completion Time Finding Outliers Location and Quantification Finding Patterns Accuracy Finding Outliers Location and Quantification Finding Patterns User Experience Difficulty Finding Outliers Finding Patterns Location and Quantification Emotions 118
  • 119.
    Freemind (600 classes)Azureus (6600 classes) User Performance Recollection Completion Time Finding Outliers Location and Quantification Finding Patterns Accuracy Finding Outliers Location and Quantification Finding Patterns User Experience Difficulty Finding Outliers Finding Patterns Location and Quantification Emotions 119
  • 120.
    Freemind (600 classes)Azureus (6600 classes) User Performance Recollection Completion Time Finding Outliers Location and Quantification Finding Patterns Accuracy Finding Outliers Location and Quantification Finding Patterns User Experience Difficulty Finding Outliers Finding Patterns Location and Quantification Emotions 120
  • 121.
    Freemind (600 classes)Azureus (6600 classes) User Performance Recollection Completion Time Finding Outliers Location and Quantification Finding Patterns Accuracy Finding Outliers Location and Quantification Finding Patterns User Experience Difficulty Finding Outliers Finding Patterns Location and Quantification Emotions 121
  • 122.
    Freemind (600 classes)Azureus (6600 classes) User Performance Recollection Completion Time Finding Outliers Location and Quantification Finding Patterns Accuracy Finding Outliers Location and Quantification Finding Patterns User Experience Difficulty Finding Outliers Finding Patterns Location and Quantification Emotions 122
  • 123.
    Freemind (600 classes)Azureus (6600 classes) User Performance Recollection Completion Time Finding Outliers Location and Quantification Finding Patterns Accuracy Finding Outliers Location and Quantification Finding Patterns User Experience Difficulty Finding Outliers Finding Patterns Location and Quantification Emotions 123
  • 124.
    Freemind (600 classes)Azureus (6600 classes) User Performance Recollection Completion Time Finding Outliers Location and Quantification Finding Patterns Accuracy Finding Outliers Location and Quantification Finding Patterns User Experience Difficulty Finding Outliers Finding Patterns Location and Quantification Emotions 124
  • 125.
    Freemind (600 classes)Azureus (6600 classes) User Performance Recollection Completion Time Finding Outliers Location and Quantification Finding Patterns Accuracy Finding Outliers Location and Quantification Finding Patterns User Experience Difficulty Finding Outliers Finding Patterns Location and Quantification Emotions 125
  • 126.
    126 L. Merino, J.Fuchs, M. Blumenschein, C. Anslow, M. Ghafari, O. Nierstrasz, M. Behrisch, and D. Keim. On the Impact of the Medium in the Effectiveness of 3D Software Visualization. In VISSOFT'17: Proceedings of the 5th IEEE Working Conference on Software Visualization, p. 11—21, IEEE, 2017. L. Merino, M. Ghafari, C. Anslow, and O. Nierstrasz. CityVR: Gameful Software Visualization. In ICSME'17: Proceedings of the 33rd IEEE International Conference on Software Maintenance and Evolution (TD Track), p. 633—637, IEEE, 2017.
  • 127.
    127 How do theinsights from the reviews and experiments can be encapsulated?
  • 128.
    128 How do theinsights from the reviews and experiments can be encapsulated? How can developers find suitable visualizations for particular tasks?
  • 129.
  • 130.
  • 131.
  • 132.
  • 133.
    133 Software Visualization Ontology Metrics# Axiom 3290 Logic. axioms 2428 Decl. axioms 862 Class count 150 Object prop. 20 Individuals 692 DL expr. ALCH SubClassOf 143 DisjointClasses 32 SubObjectPropert 1 Obj.Prp.Dom. 2 Obj.Prp.Ran. 3 ClassAssert. 696 Obj.Prp.Asse. 1547 NegativeObjectPr 4
  • 134.
  • 135.
  • 137.
    137 MetaVis Leonel Merino, MohammadGhafari, Oscar Nierstrasz, Alexandre Bergel, and Juraj Kubelka, “MetaVis: Exploring Actionable Visualization”. In VISSOFT'16: Proceedings of the 4th IEEE Working Conference on Software Visualization, IEEE, 2016.
  • 138.
    Future work Experimentation insoftware visualization displayed in VR & AR 138
  • 139.
    Future work Experimentation insoftware visualization displayed in VR & AR 139
  • 140.
    Future work Experimentation insoftware visualization displayed in VR & AR An ontology-based recommender system for software visualization tools 140
  • 141.
  • 142.
  • 143.
  • 144.
  • 145.
  • 146.
  • 147.
  • 148.
    “To increase theeffectiveness of software visualization tools, we need to consider the impact of the medium in user performance and experience.” Summary
  • 149.
  • 150.
    Speculative lightweight visualizationsbased on automatic scripts analysis 150
  • 151.
    Speculative lightweight visualizationsbased on the analysis of scripts 151
  • 152.
    Speculative lightweight visualizationsbased on the analysis of scripts 152