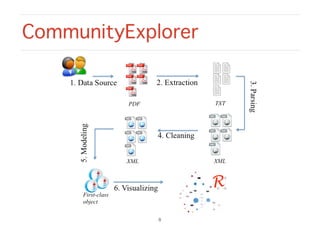
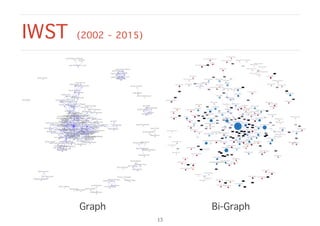
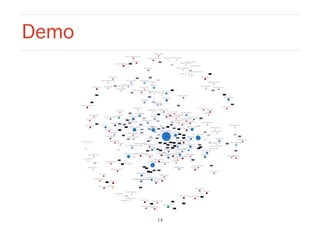
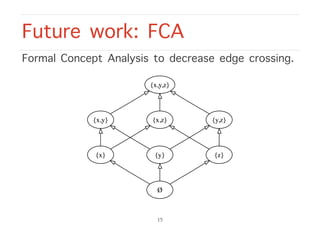
CommunityExplorer
A Framework for
Visualizing Collaboration Networks
Leonel Merino
Mohammad Ghafari
Oscar Nierstrasz
Software Composition Group
University of Bern
CommunityExplorer
A Framework for
Visualizing Collaboration Networks
Leonel Merino
Mohammad Ghafari
Oscar Nierstrasz
Software Composition Group
University of Bern
Support users to analyze and identify:
RQ1) Groups of collaboration
RQ2) Evolution of groups
RQ3) New & key authors
Visualization of Collaboration
3
Author
Affiliation
Paper
Support users to analyze and identify:
RQ1) Groups of collaboration
RQ2) Evolution of groups
RQ3) New & key authors
Visualization of Collaboration
4
Author
Affiliation
Paper
Edge crossing obstructs
comprehension !!
Collaboration in Scientific Communities
5
IWST and VISSOFT
Collaboration in Scientific Communities
6
IWST and VISSOFTPapers and Authors
Collaboration in Scientific Communities
7
IWST and VISSOFTPapers and Authors
Search engines and Digital Libraries
CommunityExplorer
8
Decreasing EC: Graph vs Bi-Graph
9
Author
Paper
Author
Graph Bi-Graph
Paper
AuthorAuthor
Graph vs. Bi-Graph
10
#Authors:2
#Papers:5
#Authors:5
#Papers:1
Case Study: VISSOFT vs IWST
11
0	
1000	
2000	
3000	
4000	
5000	
6000	
7000	
8000	
9000	
10000	
Graph	 Bi-Graph	 Graph	 Bi-Graph	
VISSOFT	(346)	 IWST	(104)	
Nodes	
Edges	
Crossing
VISSOFT (2002 - 2015)
Graph Bi-Graph
12
IWST (2002 - 2015)
Graph Bi-Graph
13
Demo
14
Future work: FCA
15
Formal Concept Analysis to decrease edge crossing.
Future work: Extending Pipeline
16
• Extend the pipeline to extract other fields such
as paper’s sections, figures, listings.
• Add visualizations for these types of data.
e.g., visualize how popular is Smalltalk across
collaboration groups?
Summary

http://scg.unibe.ch/research/CommunityExplorer
merino@inf.unibe.ch @leonel_merino

CommunityExplorer IWST 2016