This study investigated the relationship between amino acid profiles and lipid profiles in overweight and obese subjects. 200 subjects were classified as healthy or obese based on BMI. Serum samples were analyzed for 14 amino acids and 22 lipid species. Results found ornithine, tyrosine, valine and leucine were significantly elevated in obese subjects. Certain lipids including C3 and C5 were also higher. Pearson correlation found strong relationships between branched chain amino acids and lipids like C3 and C5. Linear regression showed additional positive correlations between some amino acids and lipids. The study suggests a combination of amino acids and lipids could help predict insulin resistance and type 2 diabetes.
1. L. Whitney 1,A. O’Gorman 2 and L. Brennan 2
1 UCD School of Medicine,UniversityCollege Dublin, Belfield,Dublin 4.2 UCD SchoolofAgricultureand Food Science,Instituteof Food and Health,UCD Conway Institute,Belfield,Dublin 4
Introduction
Emerging evidence has shown that alterations in
amino acids and lipid profiles are linked to obesity.1
In particular there appears to be a direct link between
elevated levels of branched chain amino acids
(BCAAs), obesity and insulin resistance (IR).
This information could potentially allow for the use of
such biomarkers in the development and progression
of weight related diseases.
The objective of this study was to examine the
interplay between amino acids and the lipid profiles in
healthy subjects with a range of BMI.
References
1. Newgard CB, An J, Bain JR, et al. A Branched-Chain Amino Acid-Related Metabolic
Signature that Differentiates Obese and Lean Human and Contributes to Insulin
Resistance. Cell Metabolism. 2009;9(4):311-326.
Investigation into the relationship between amino acid profiles and
lipid profiles in overweight and obese subjects
Materials & Methods
200 healthy adults aged 18-65 were recruited to a
metabolic challenge (MECHE) study.
Subjects were classed based on their BMI as healthy
(18.5-24.9kg/m2) or obese (>30kg/m2).
Baseline serum samples were collected and analysed
by Biocrates Life Science AG using ESI/MS/MS.
Independent t tests of amino acids & lipids were
examined between groups (healthy vs obese).
Pearson correlation analysis & linear regression were
performed to asses relationships between
metabolites.
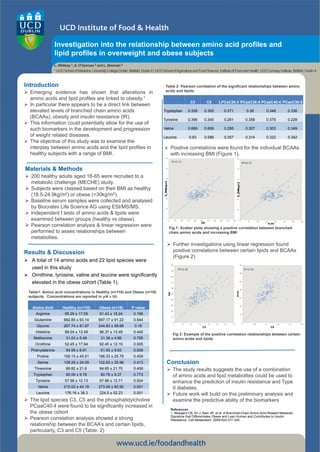
Positive correlations were found for the individual BCAAs
with increasing BMI (Figure 1).
Conclusion
The study results suggests the use of a combination
of amino acids and lipid metabolites could be used to
enhance the prediction of insulin resistance and Type
II diabetes.
Future work will build on this preliminary analysis and
examine the predictive ability of the biomarkers
Table1: Amino acid concentrations in Healthy (n=110) and Obese (n=18)
subjects. Concentrations are reported in µM ± SD.
Fig 2: Example of the positive correlation relationships between certain
amino acids and lipids
Fig.1: Scatter plots showing a positive correlation between branched
chain amino acids and increasing BMI
Results & Discussion
A total of 14 amino acids and 22 lipid species were
used in this study
Ornithine, tyrosine, valine and leucine were significantly
elevated in the obese cohort (Table 1).
The lipid species C3, C5 and the phosphatidylcholine
PCaaC40:4 were found to be significantly increased in
the obese cohort
Pearson correlation analysis showed a strong
relationship between the BCAA’s and certain lipids,
particularly, C3 and C5 (Table. 2)
Amino Acid Healthy (n=110) Obese (n=18) P value
Arginine 85.29 ± 17.09 91.43 ± 18.24 0.196
Glutamine 682.85 ± 93.14 697.17 ± 91.22 0.544
Glycine 267.74 ± 81.97 244.83 ± 58.66 0.16
Histidine 89.04 ± 13.49 86.37 ± 13.49 0.445
Methionine 31.03 ± 5.49 31.36 ± 4.86 0.795
Ornithine 52.45 ± 17.94 62.45 ± 12.19 0.005
Phenylalanine 54.99 ± 8.81 61.93 ± 9.63 0.009
Proline 158.15 ± 45.51 166.33 ± 25.78 0.459
Serine 108.28 ± 24.09 102.83 ± 25.96 0.413
Threonine 88.82 ± 21.6 84.65 ± 21.75 0.458
Tryptophan 80.06 ± 9.78 80.76 ± 9.37 0.773
Tyrosine 57.58 ± 12.13 67.96 ± 12.71 0.004
Valine 215.02 ± 44.19 273.06 ± 60.92 0.001
Leucine 176.16 ± 38.3 224.5 ± 52.23 0.001
C3 C5 LPCaC20:4 PCaaC38:4 PCaaC40:4 PCaeC38:5
Tryptophan 0.339 0.305 0.371 0.36 0.348 0.336
Tyrosine 0.396 0.345 0.261 0.358 0.375 0.229
Valine 0.669 0.606 0.295 0.307 0.303 0.349
Leucine 0.63 0.586 0.357 0.314 0.322 0.342
Table 2: Pearson correlation of the significant relationships between amino
acids and lipids
0
10
20
30
40
50
60
0 50 100 150 200 250 300 350 400 450 500
S_BMIkgm2
Val
R2=0.12
0
10
20
30
40
50
60
0 50 100 150 200 250 300 350
S_BMIkgm2
xLeu
R2=0.12
0
50
100
150
200
250
300
350
400
450
500
0 0.1 0.2 0.3 0.4 0.5 0.6 0.7
Val
C3
Further investigations using linear regression found
positive correlations between certain lipids and BCAAs
(Figure 2)
R2=0.45
0
50
100
150
200
250
300
350
0 0.05 0.1 0.15 0.2 0.25
xLeu
C5
R2=0.34