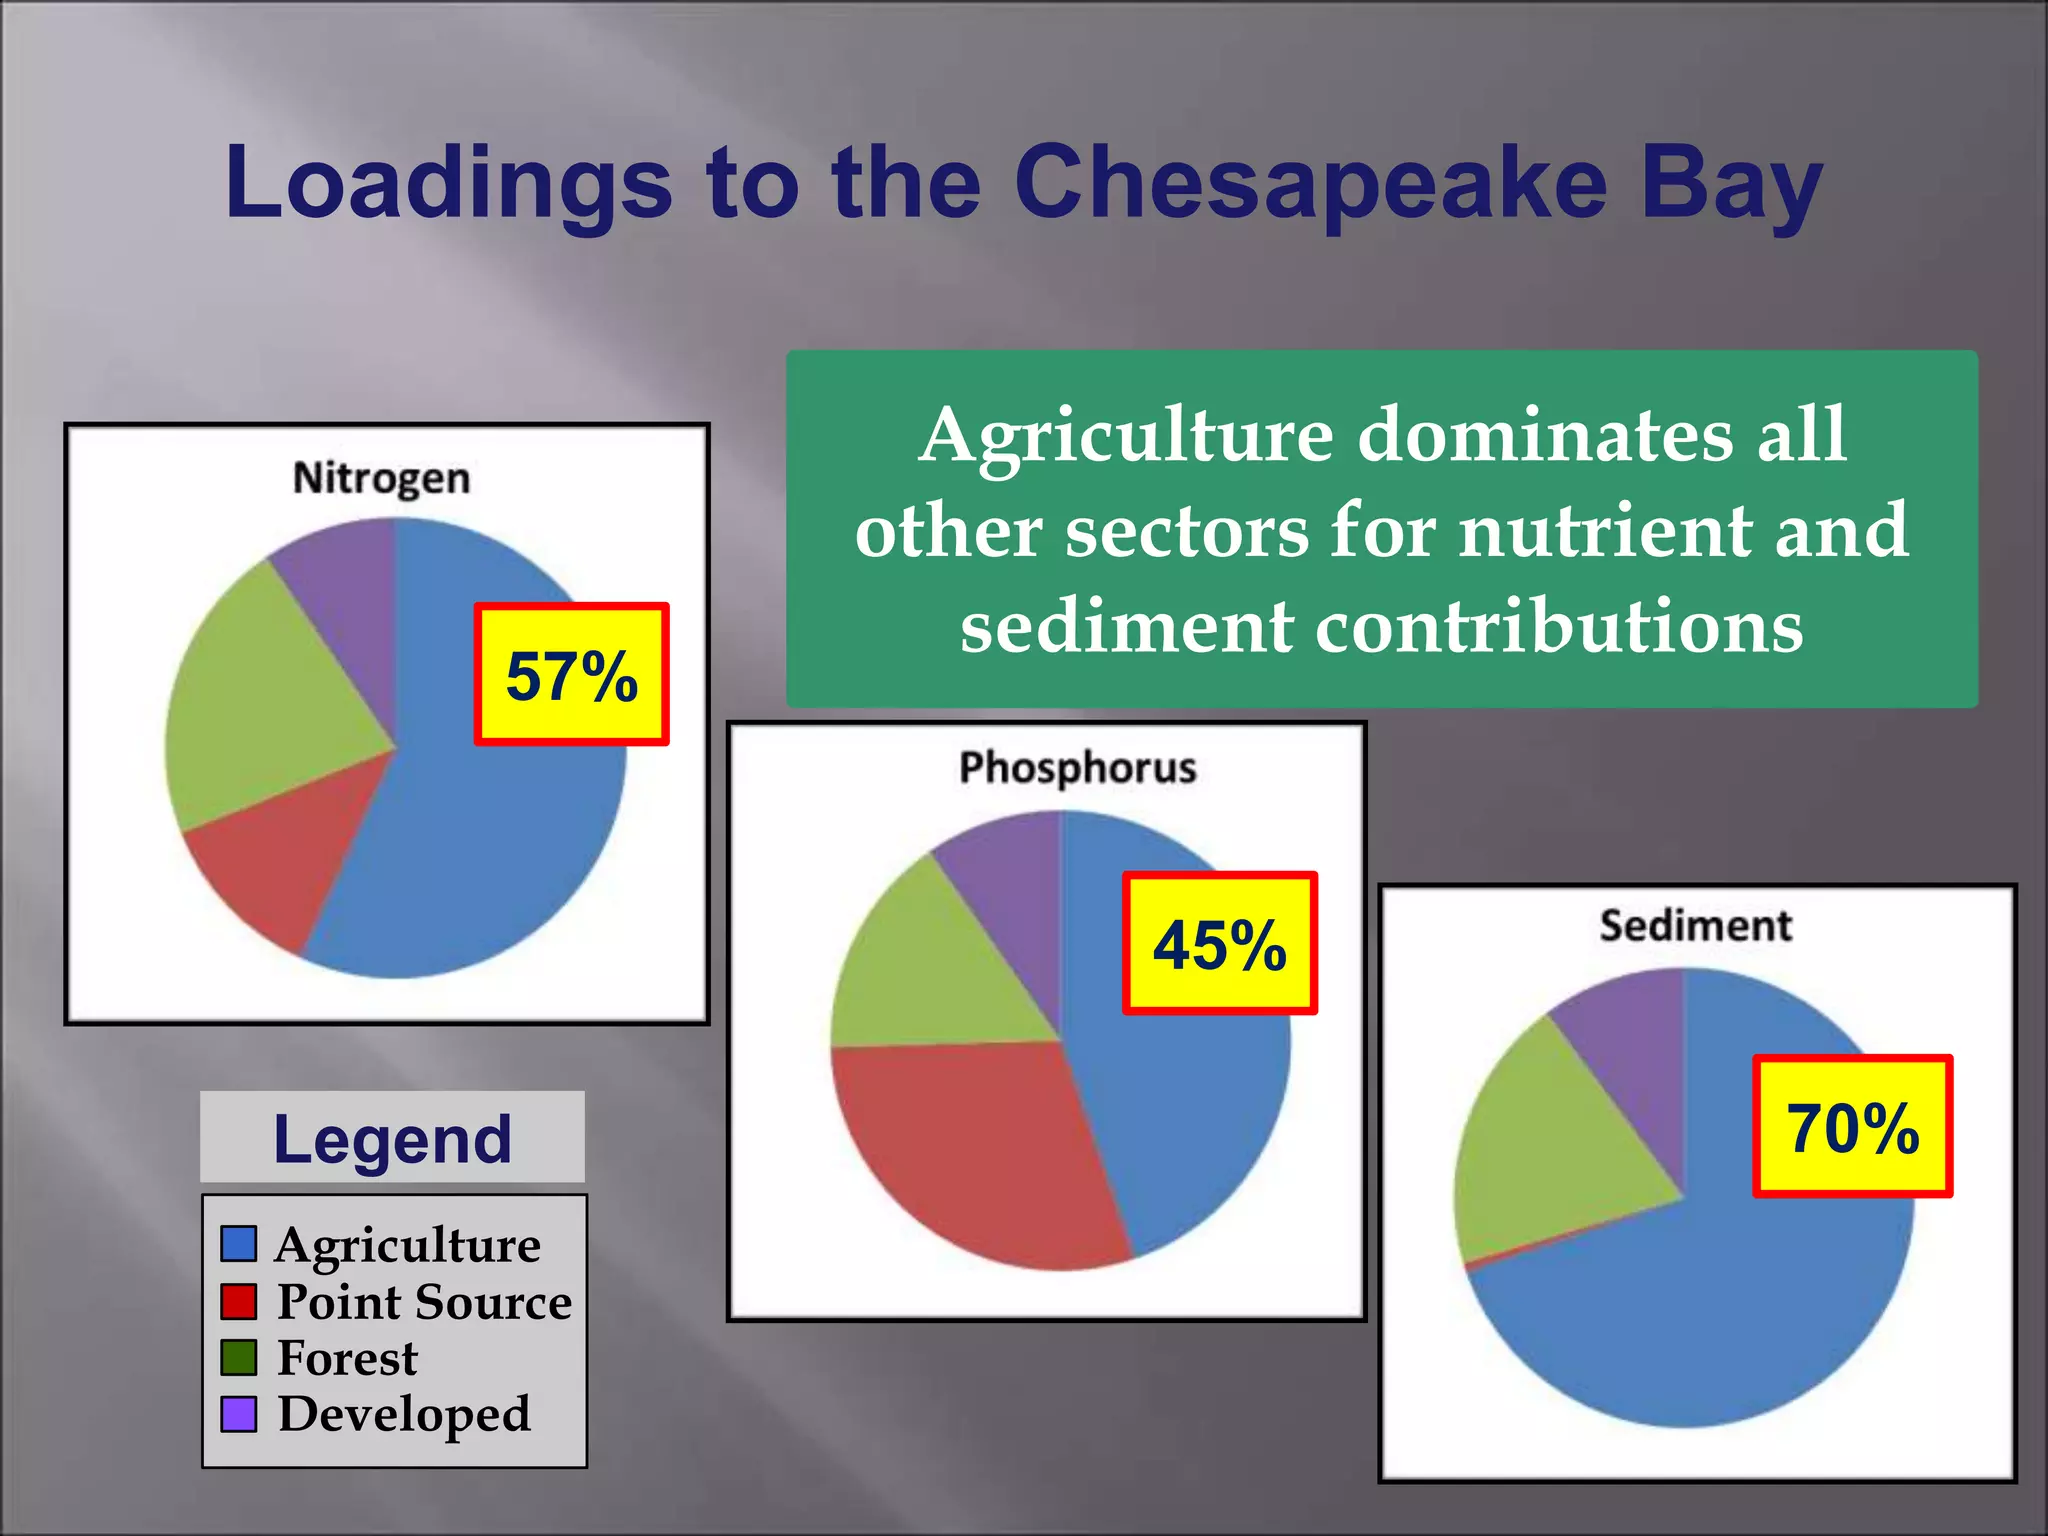
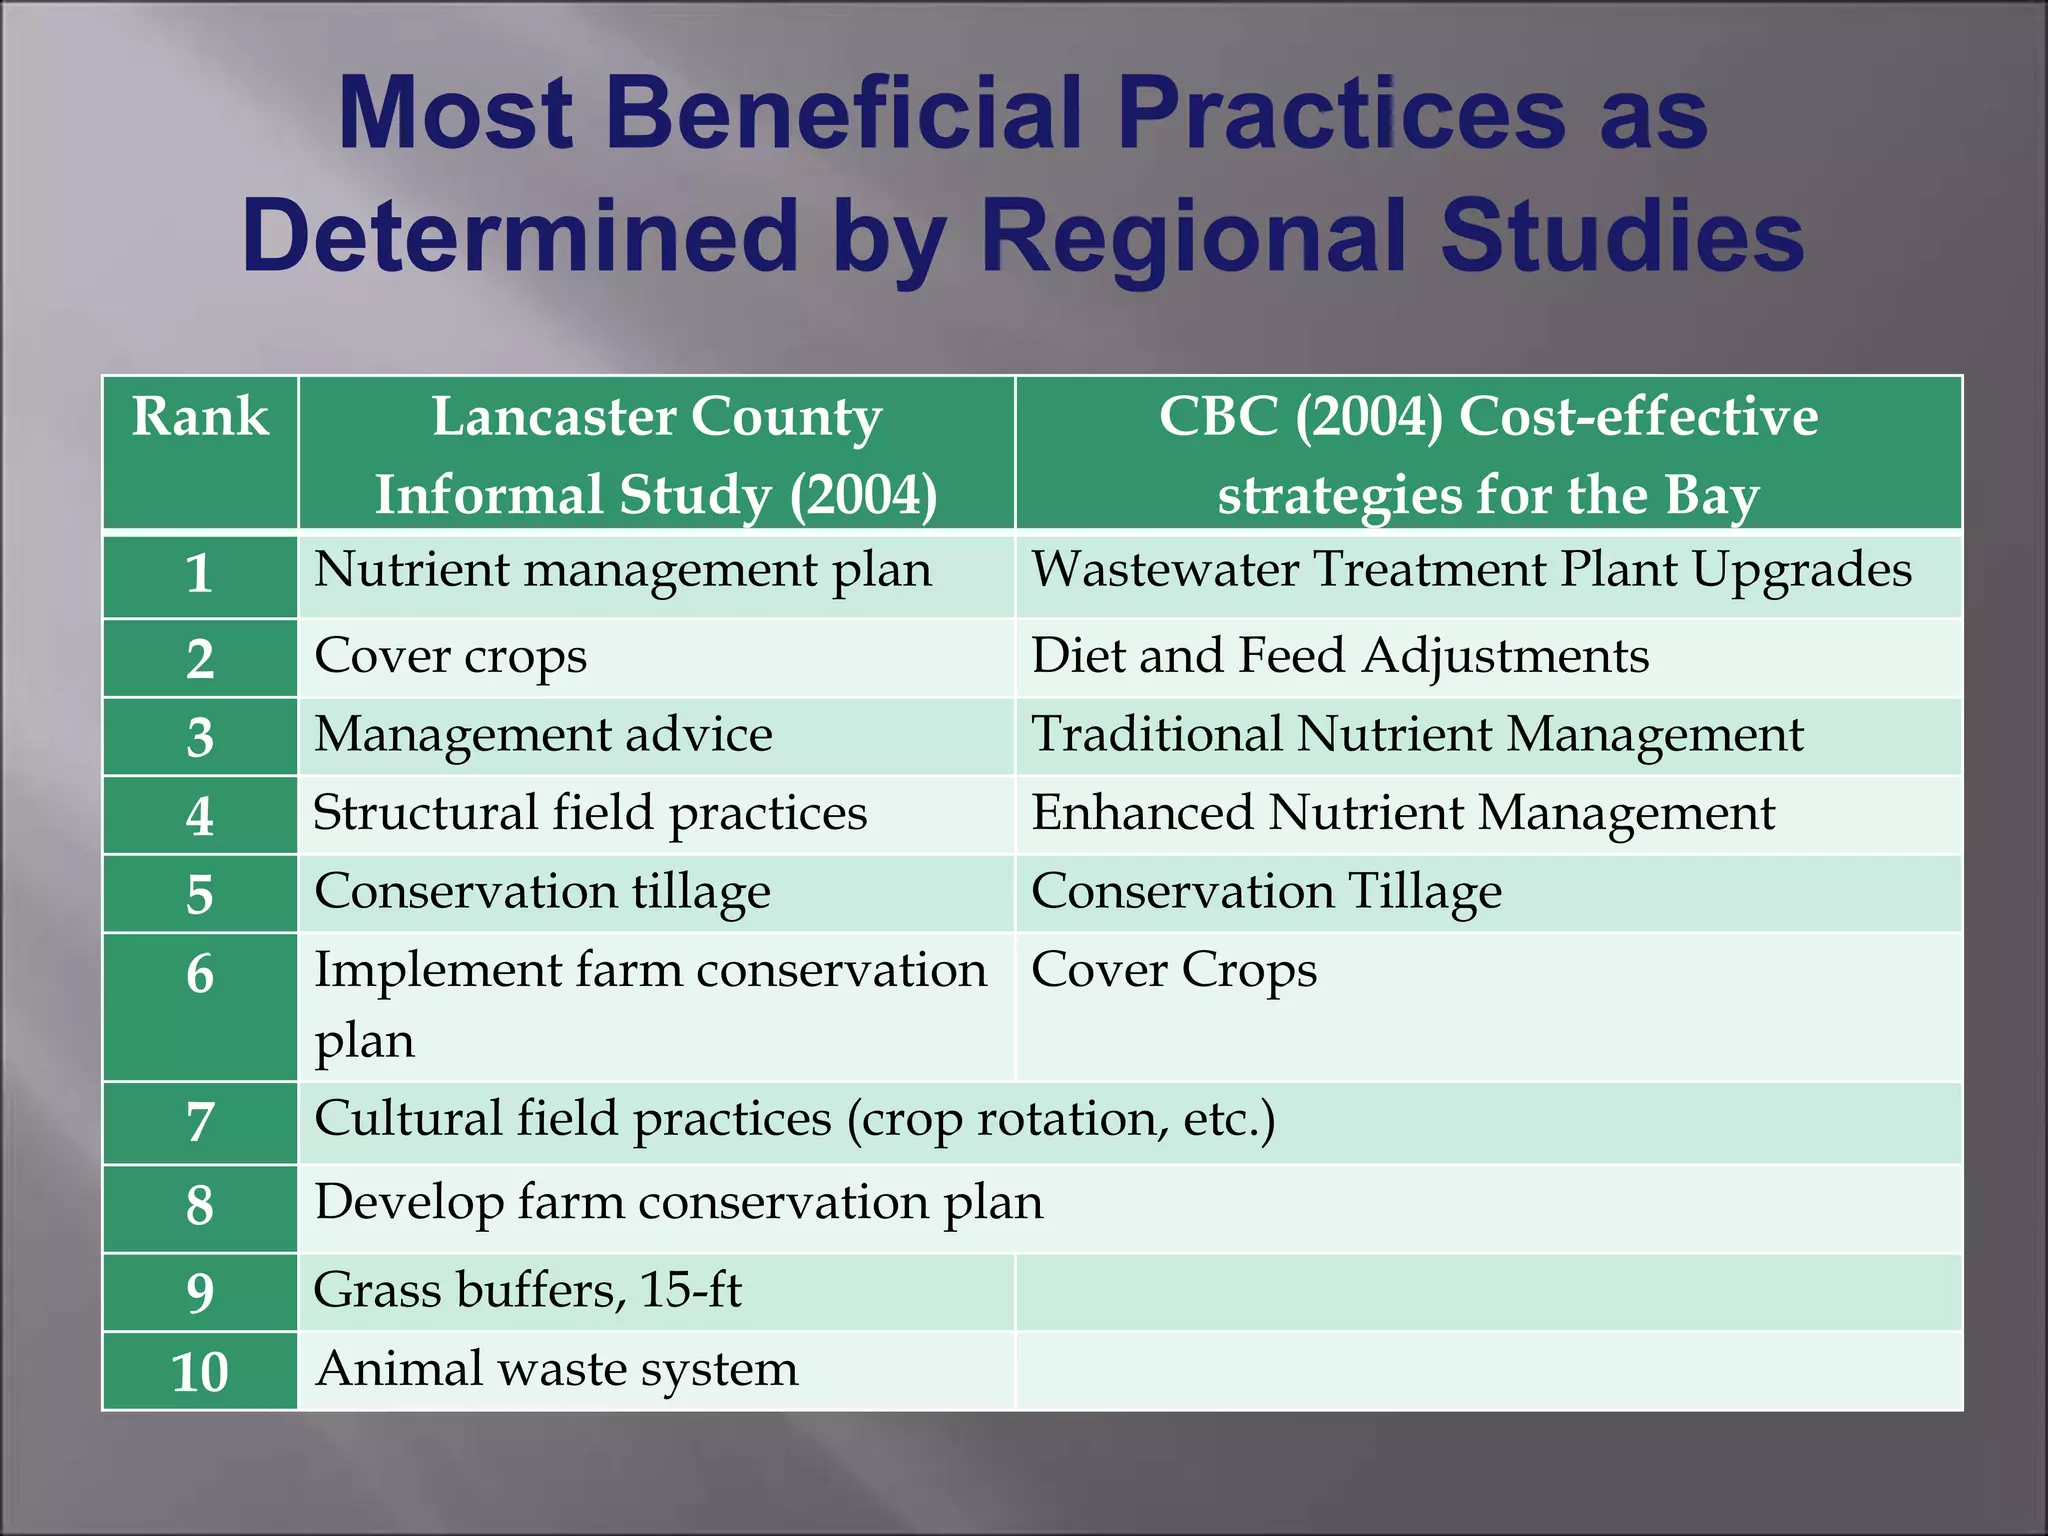
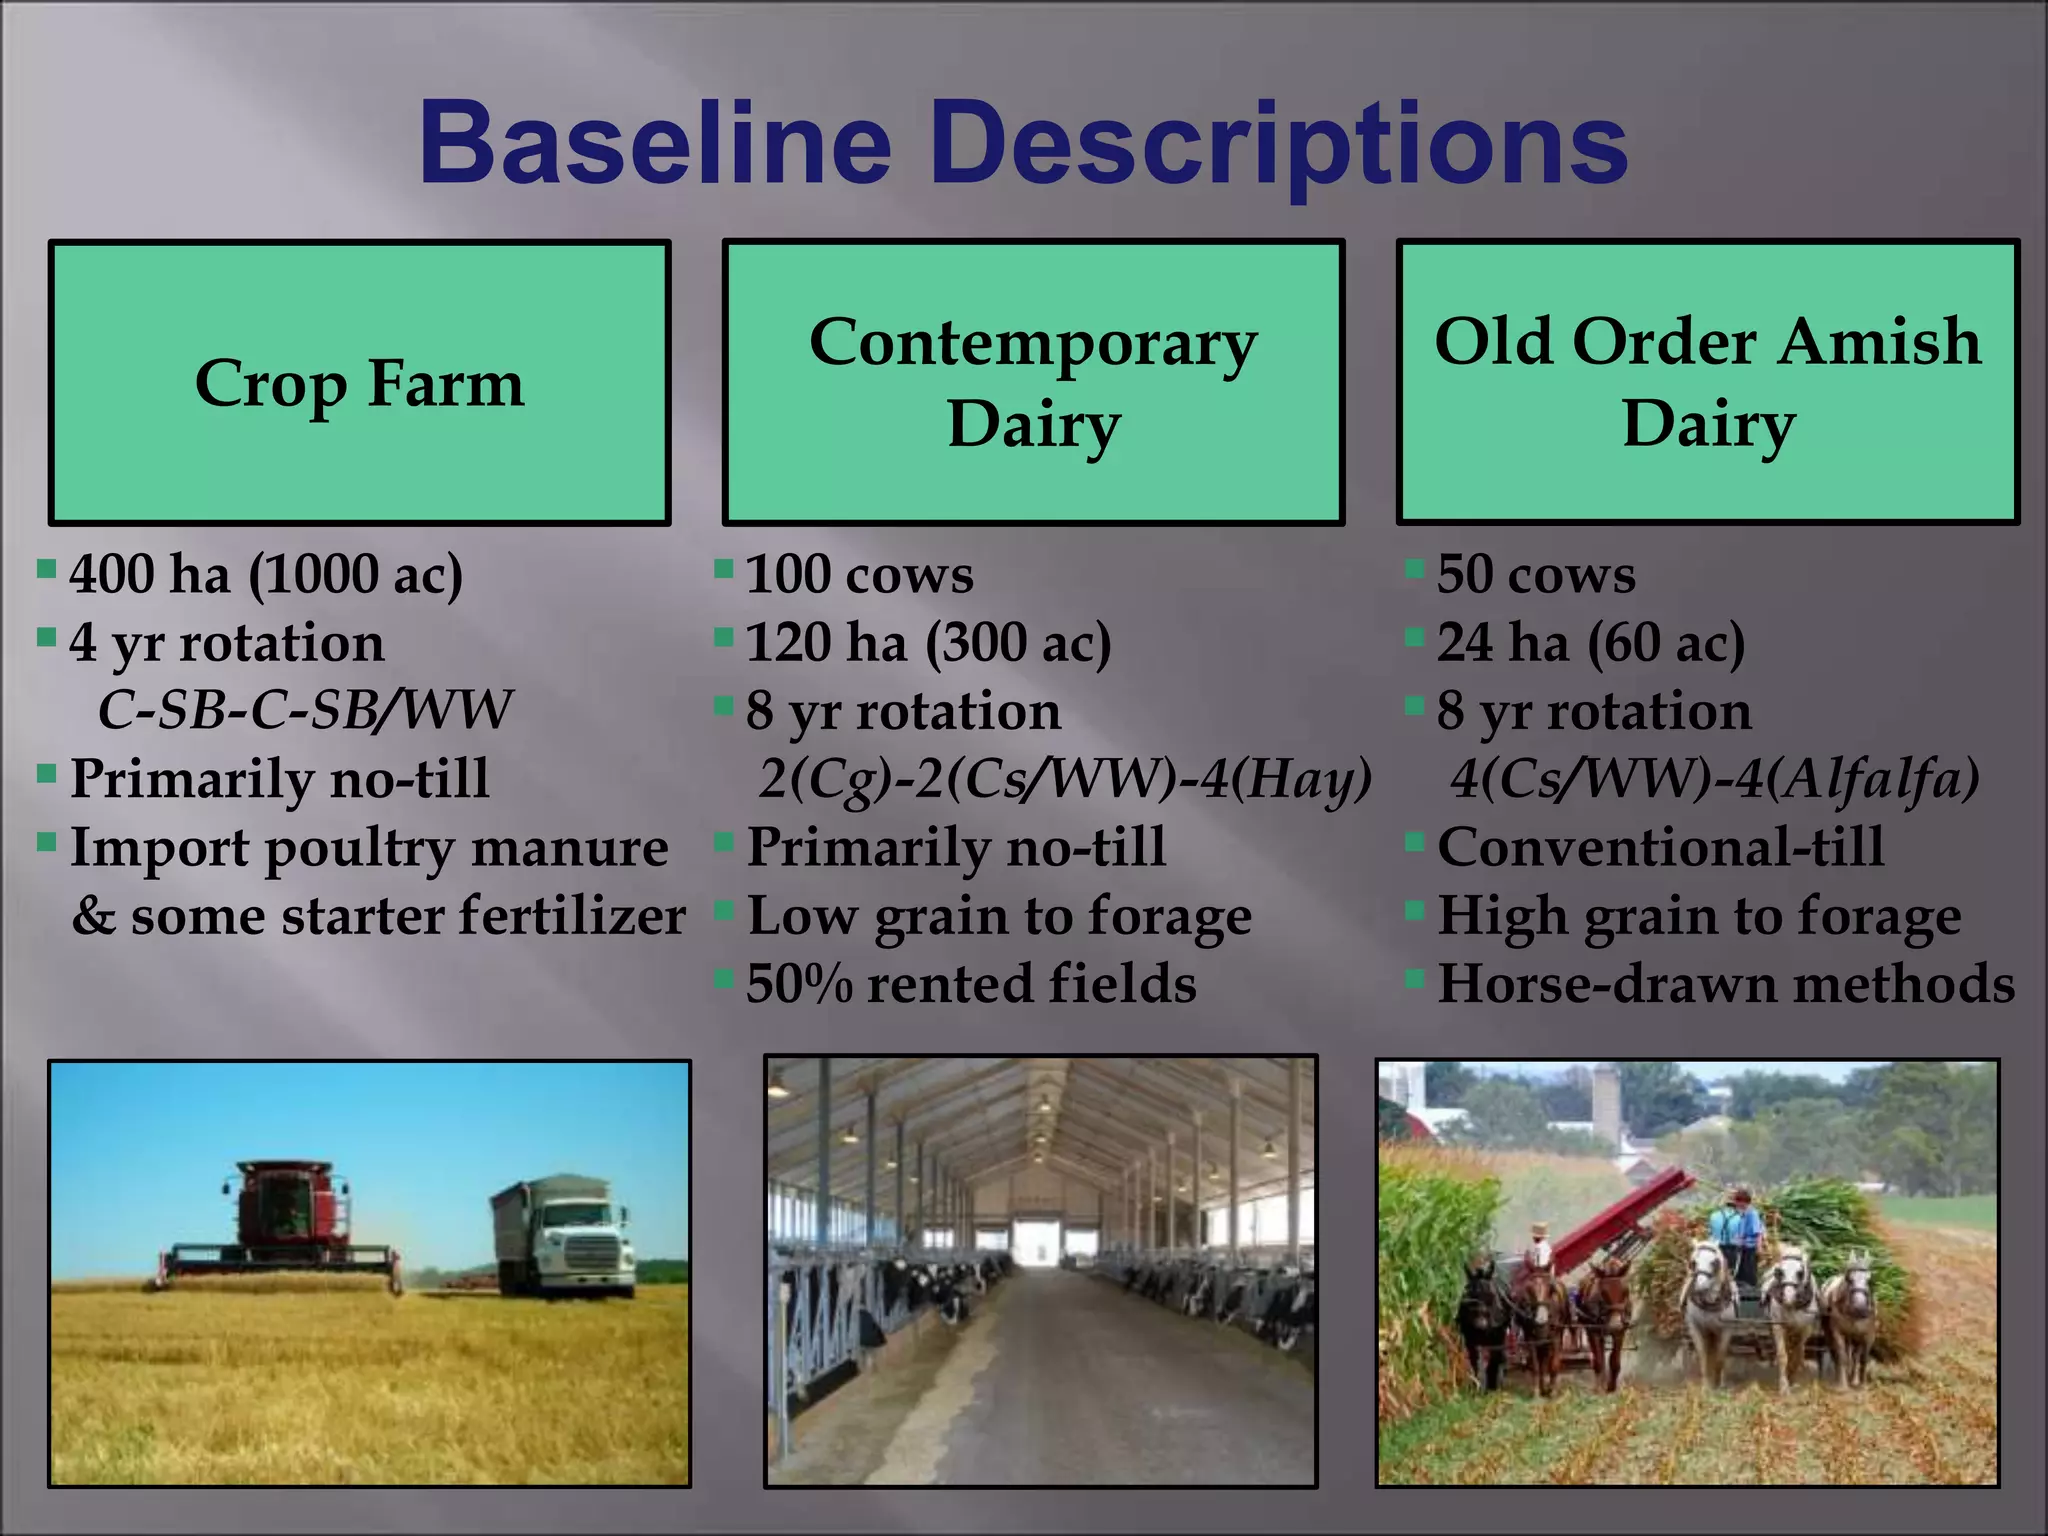
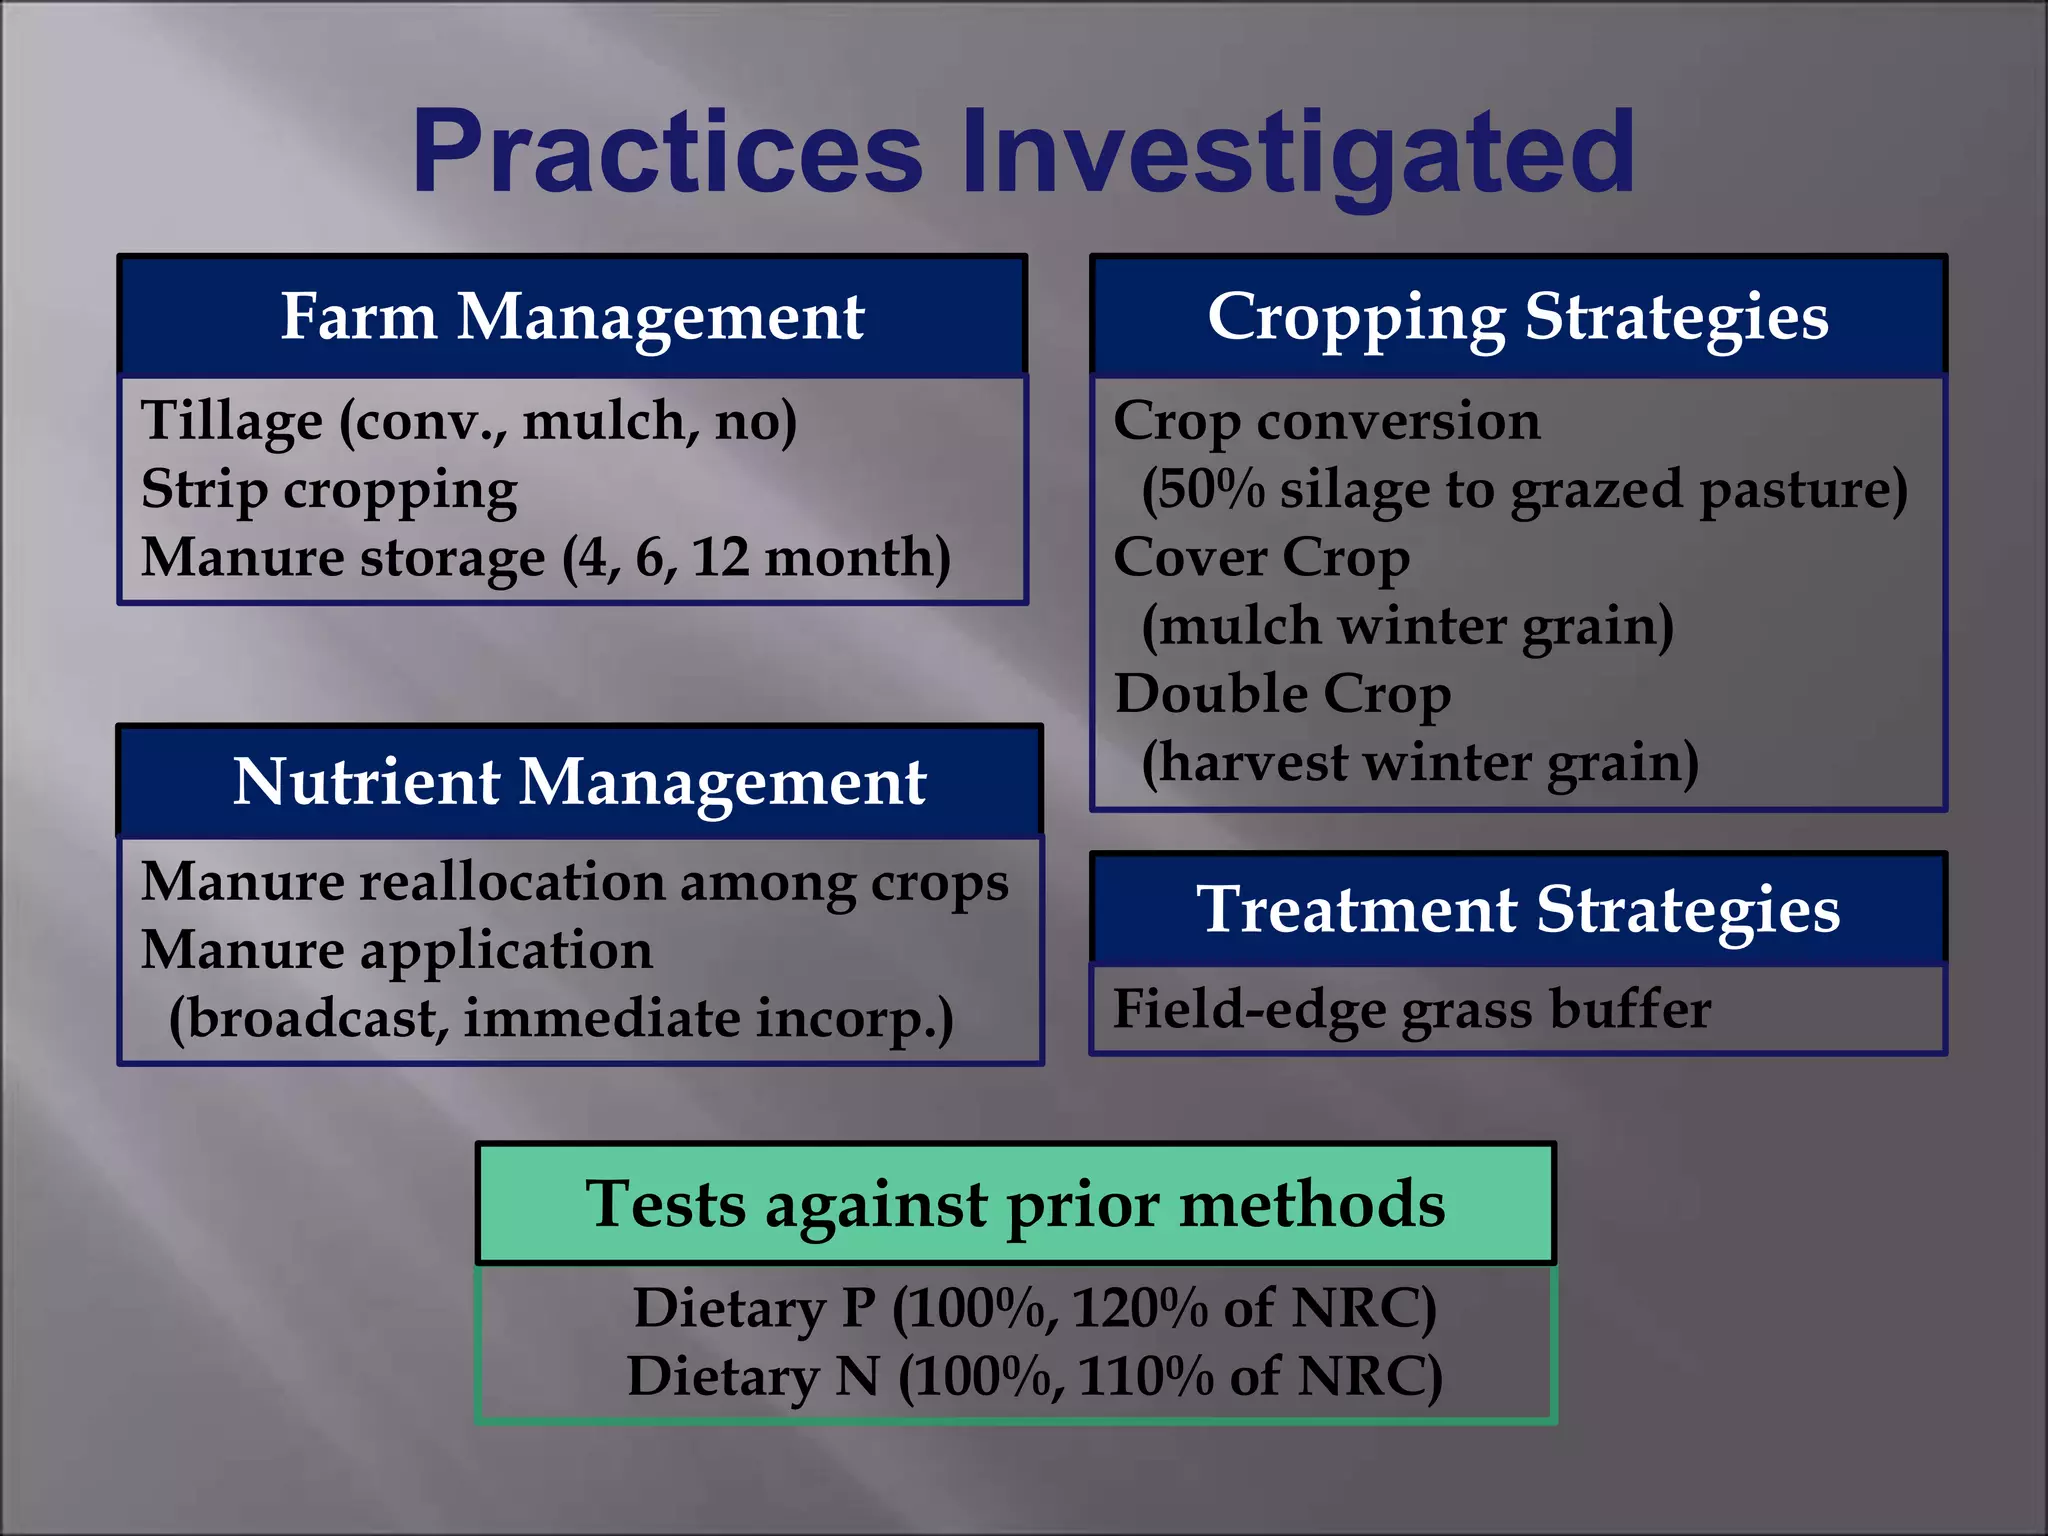
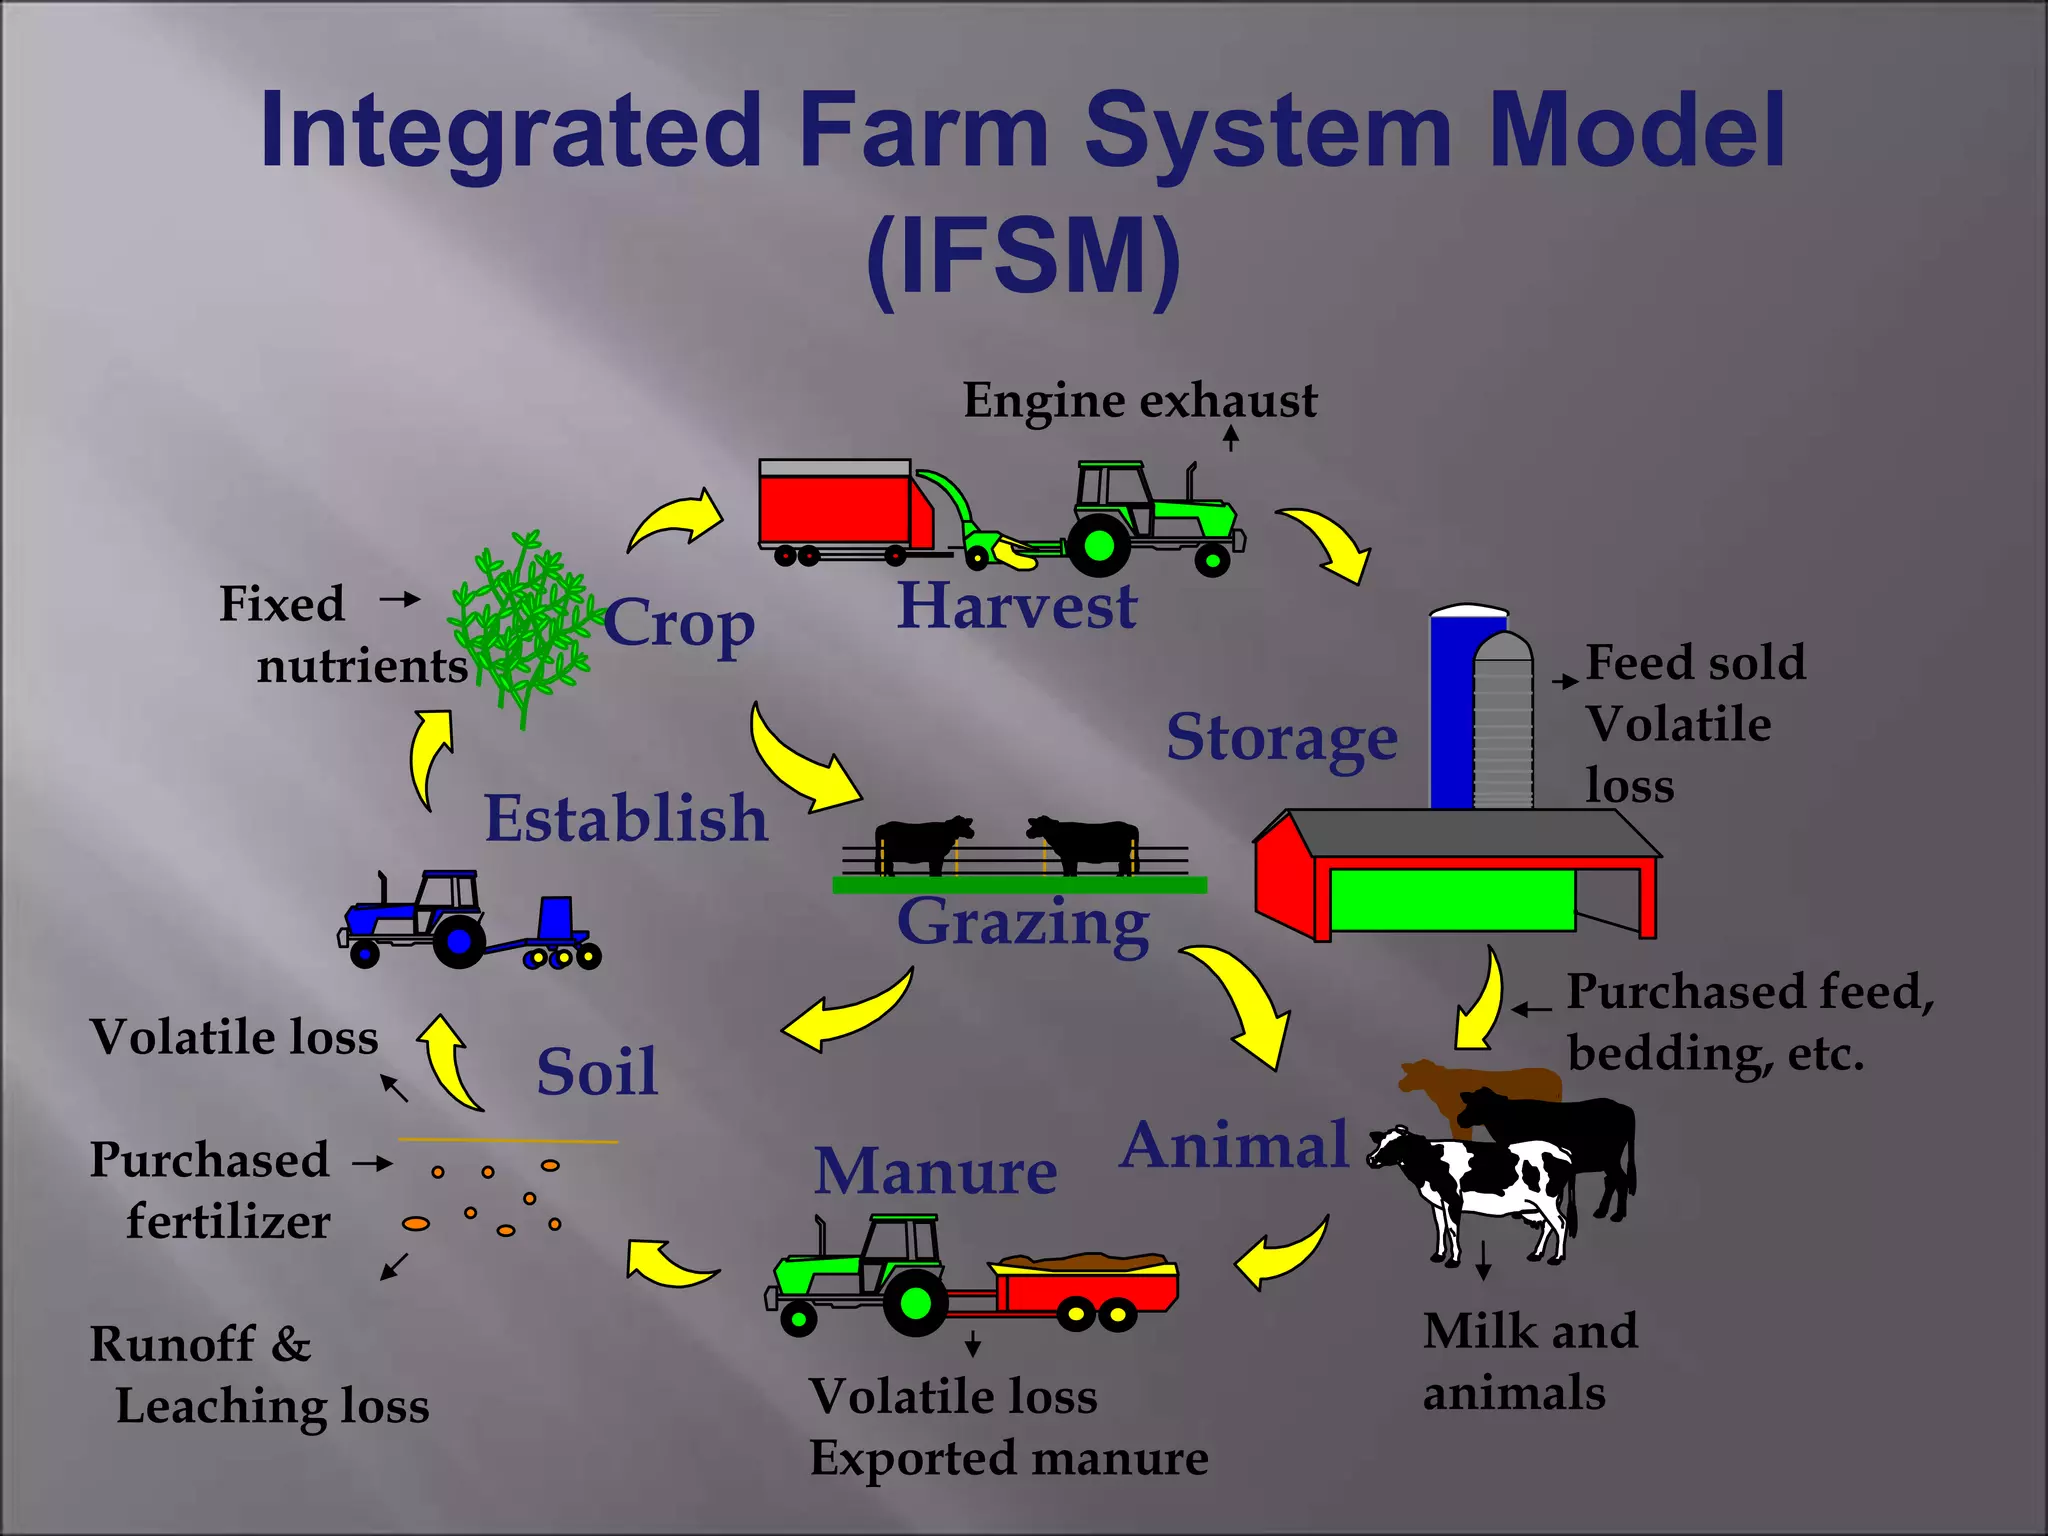
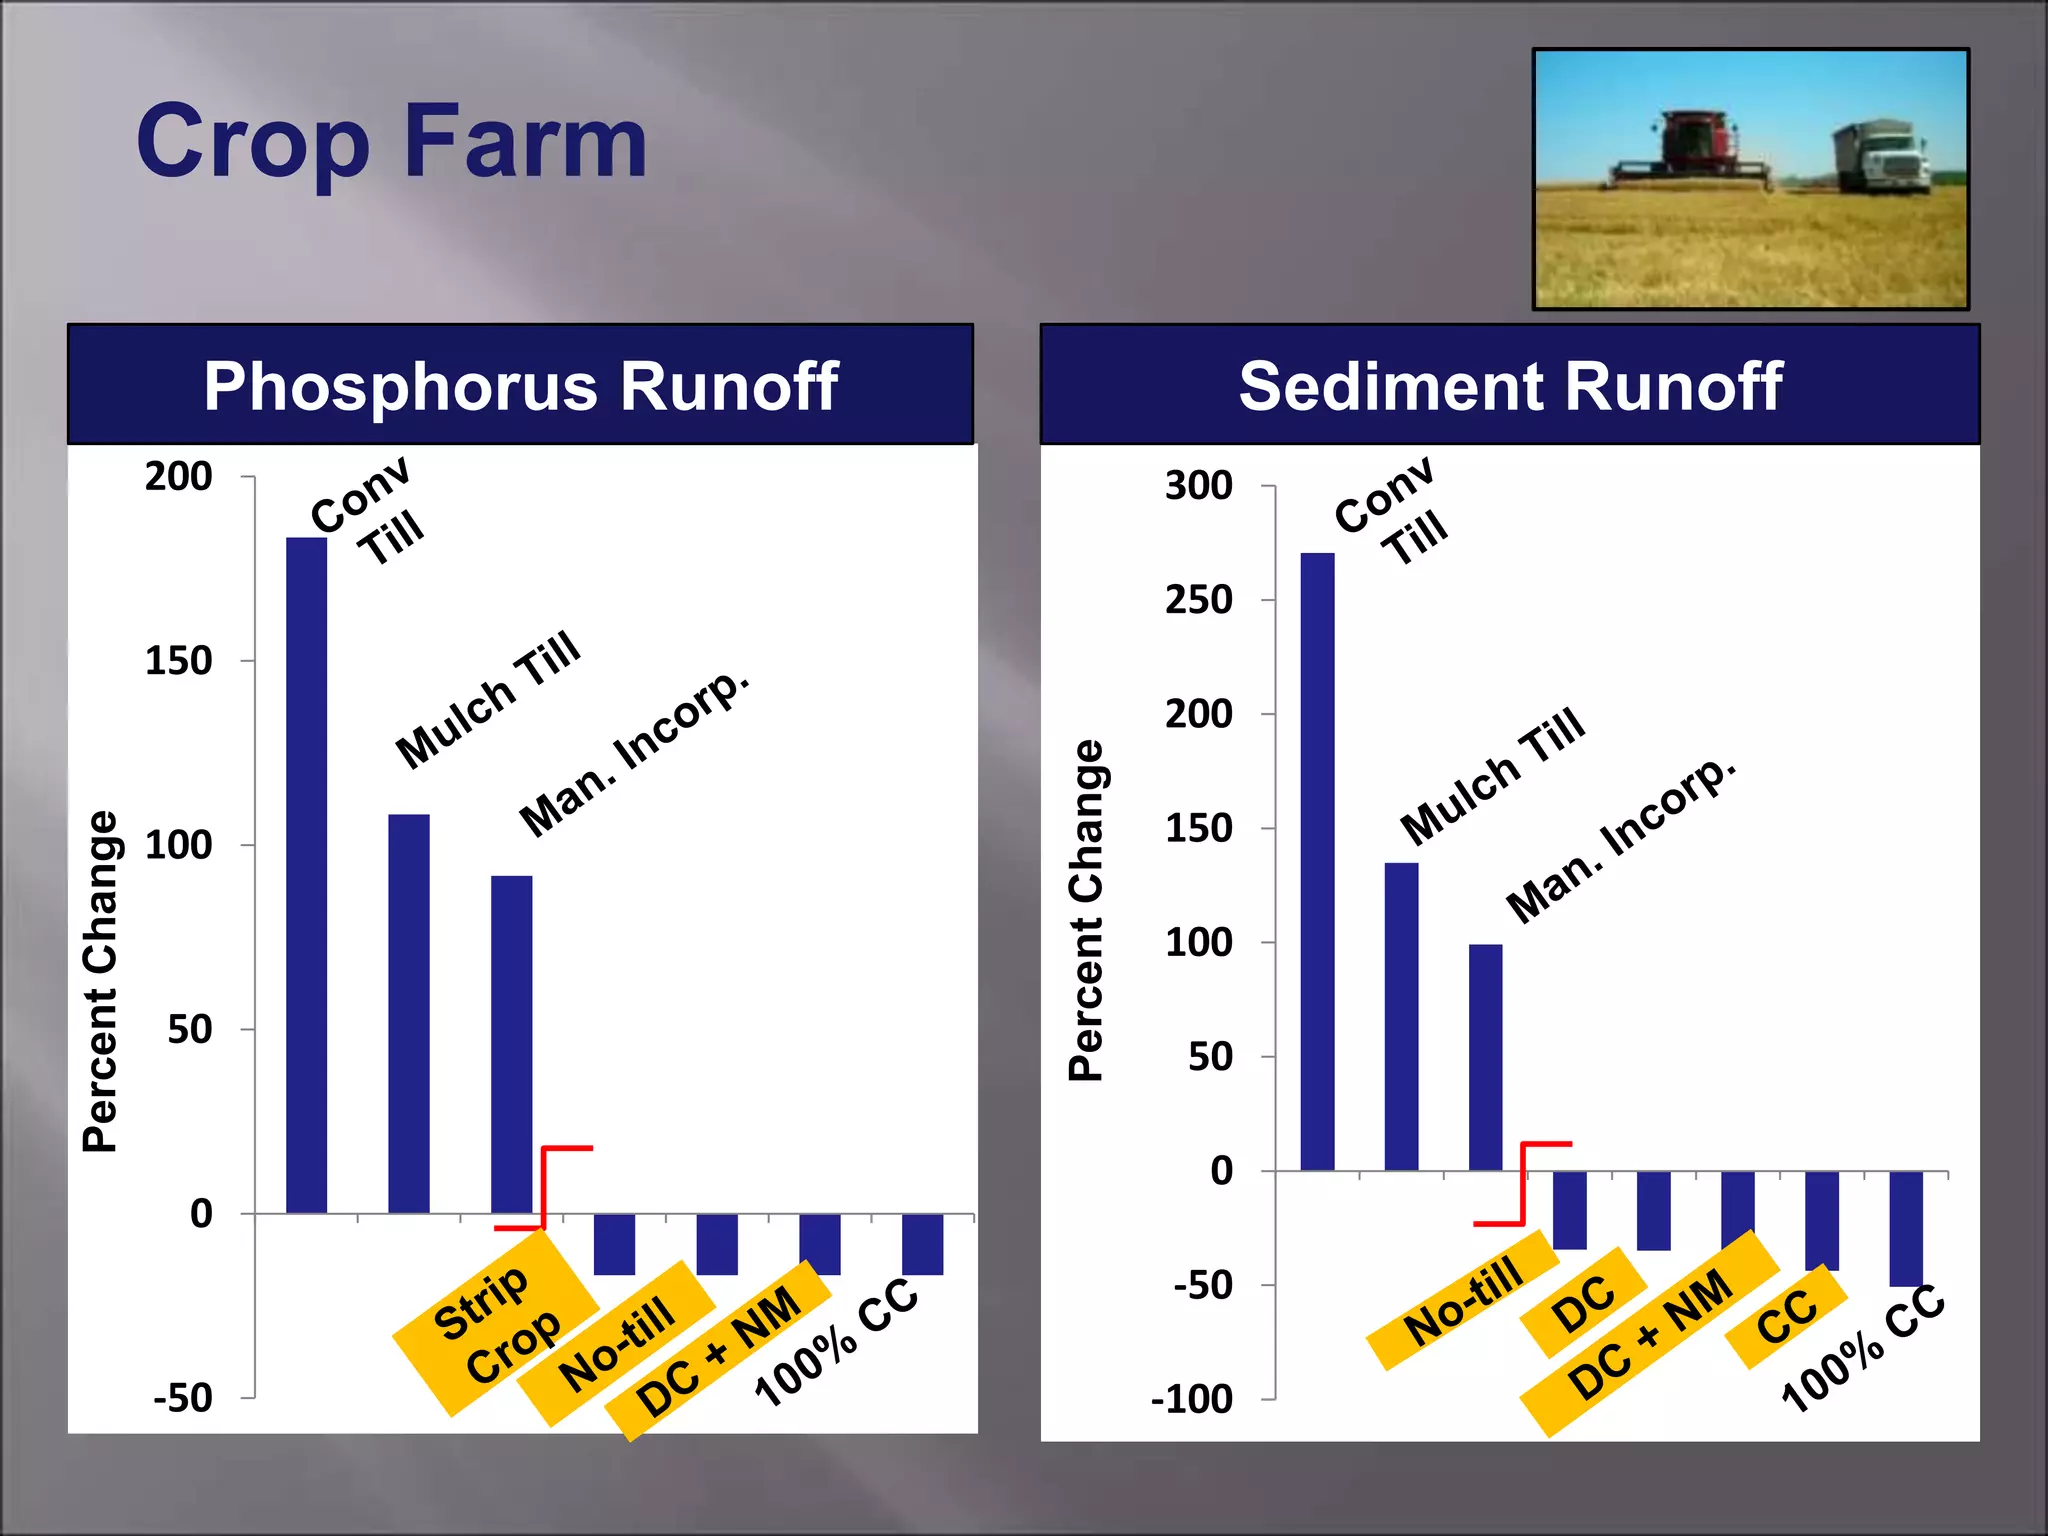
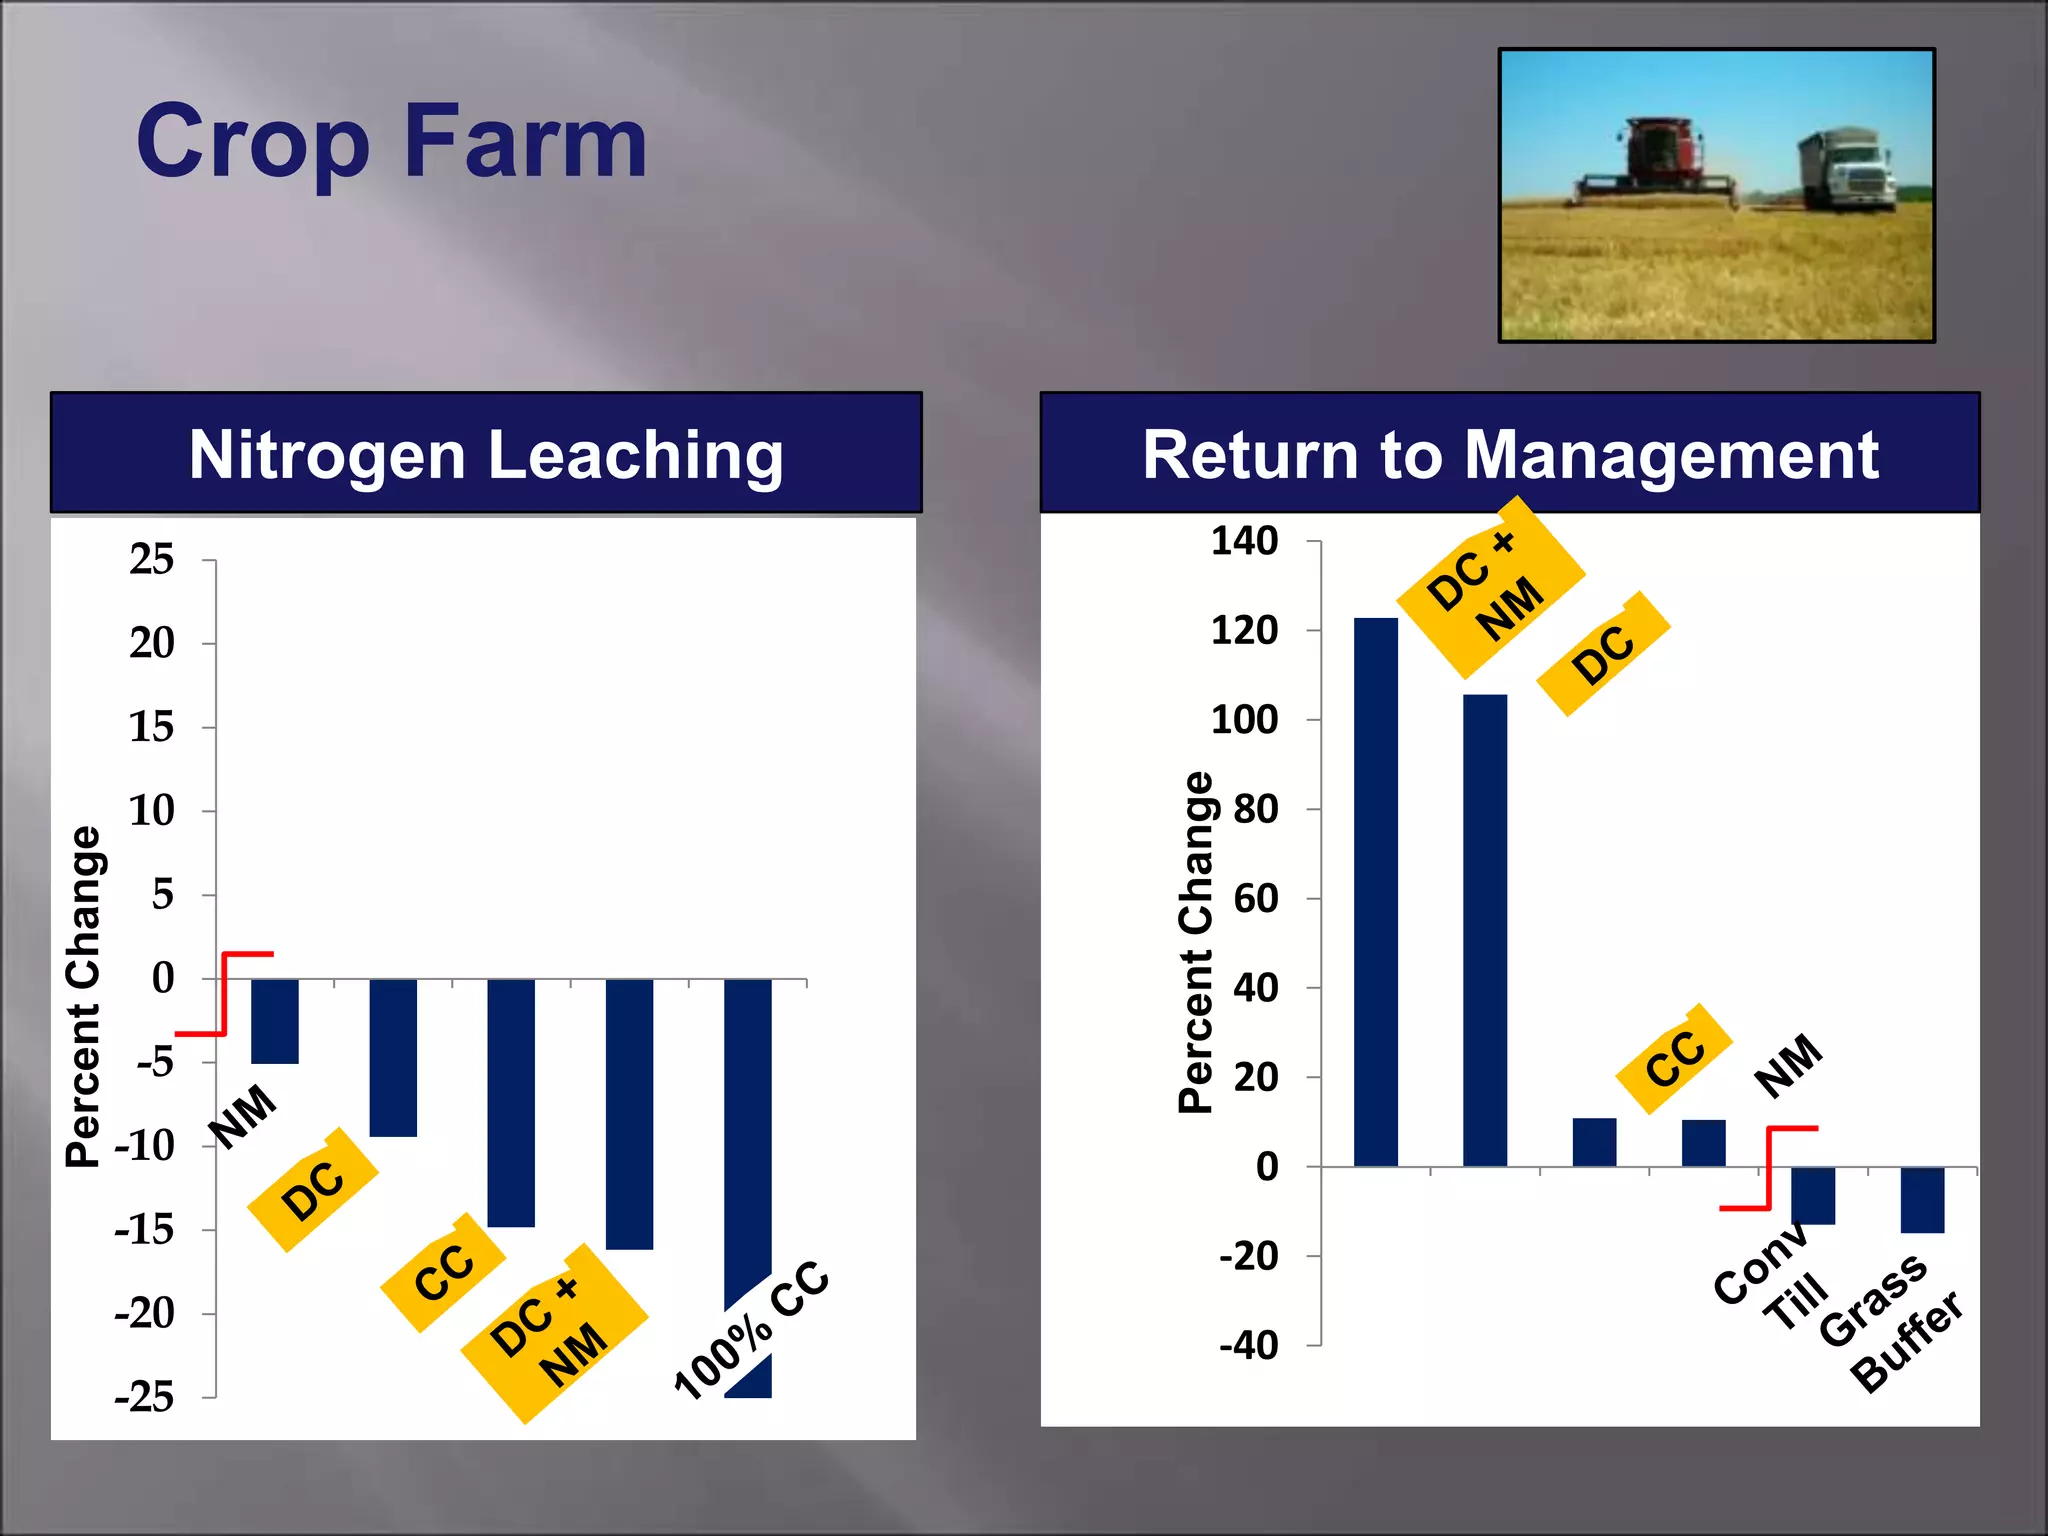
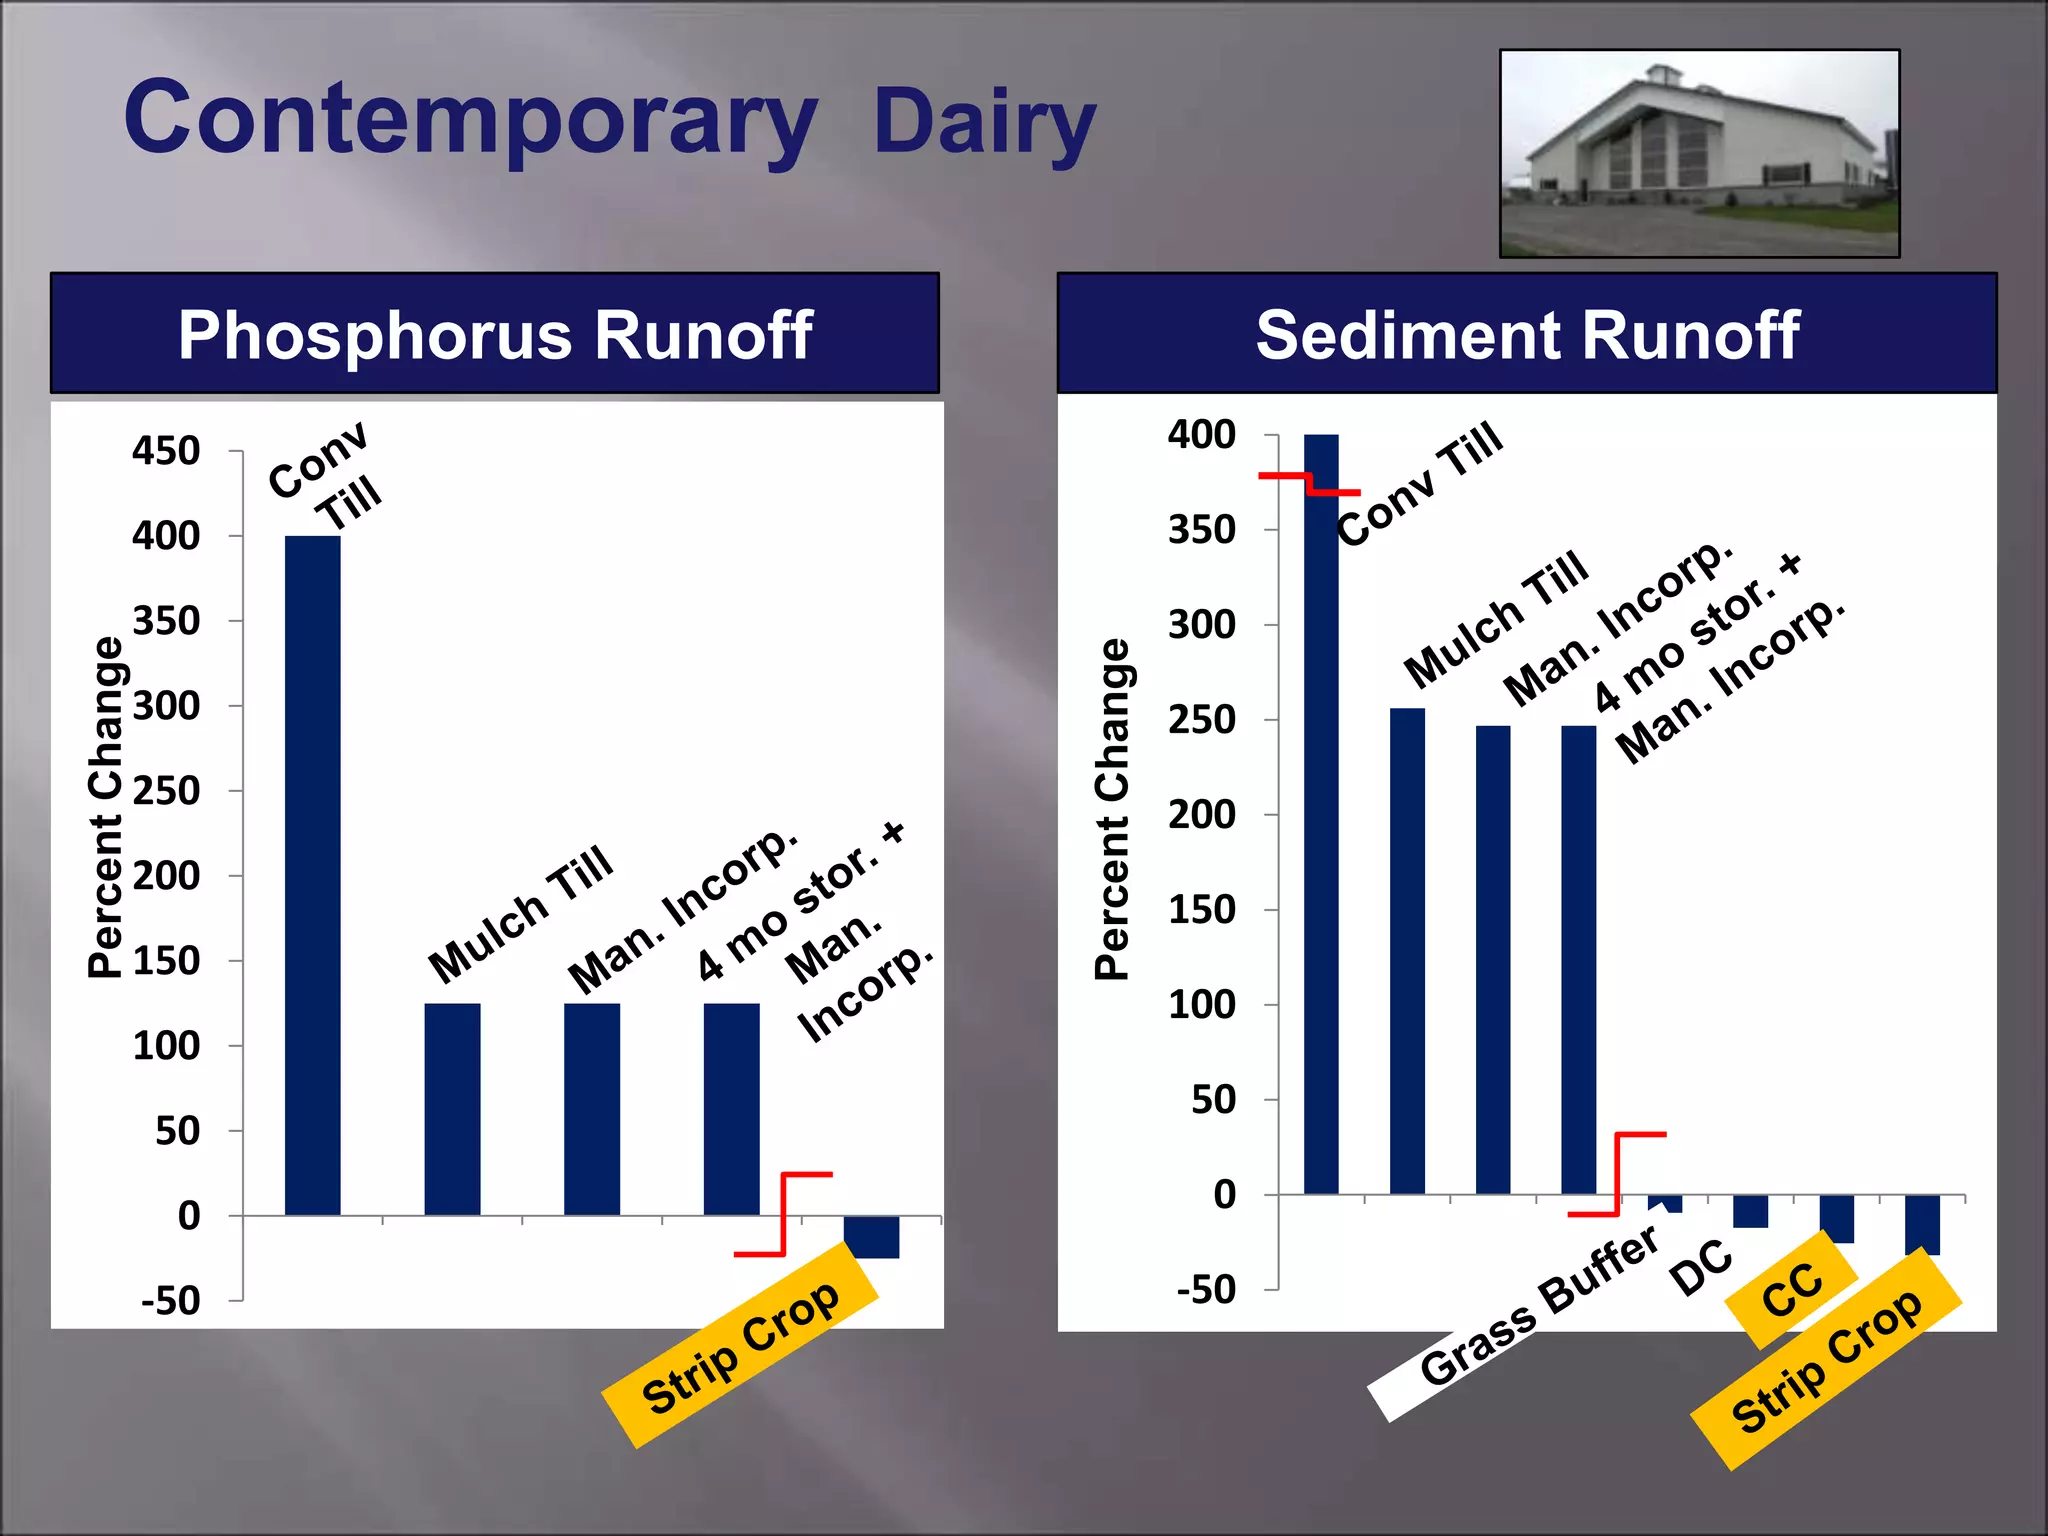
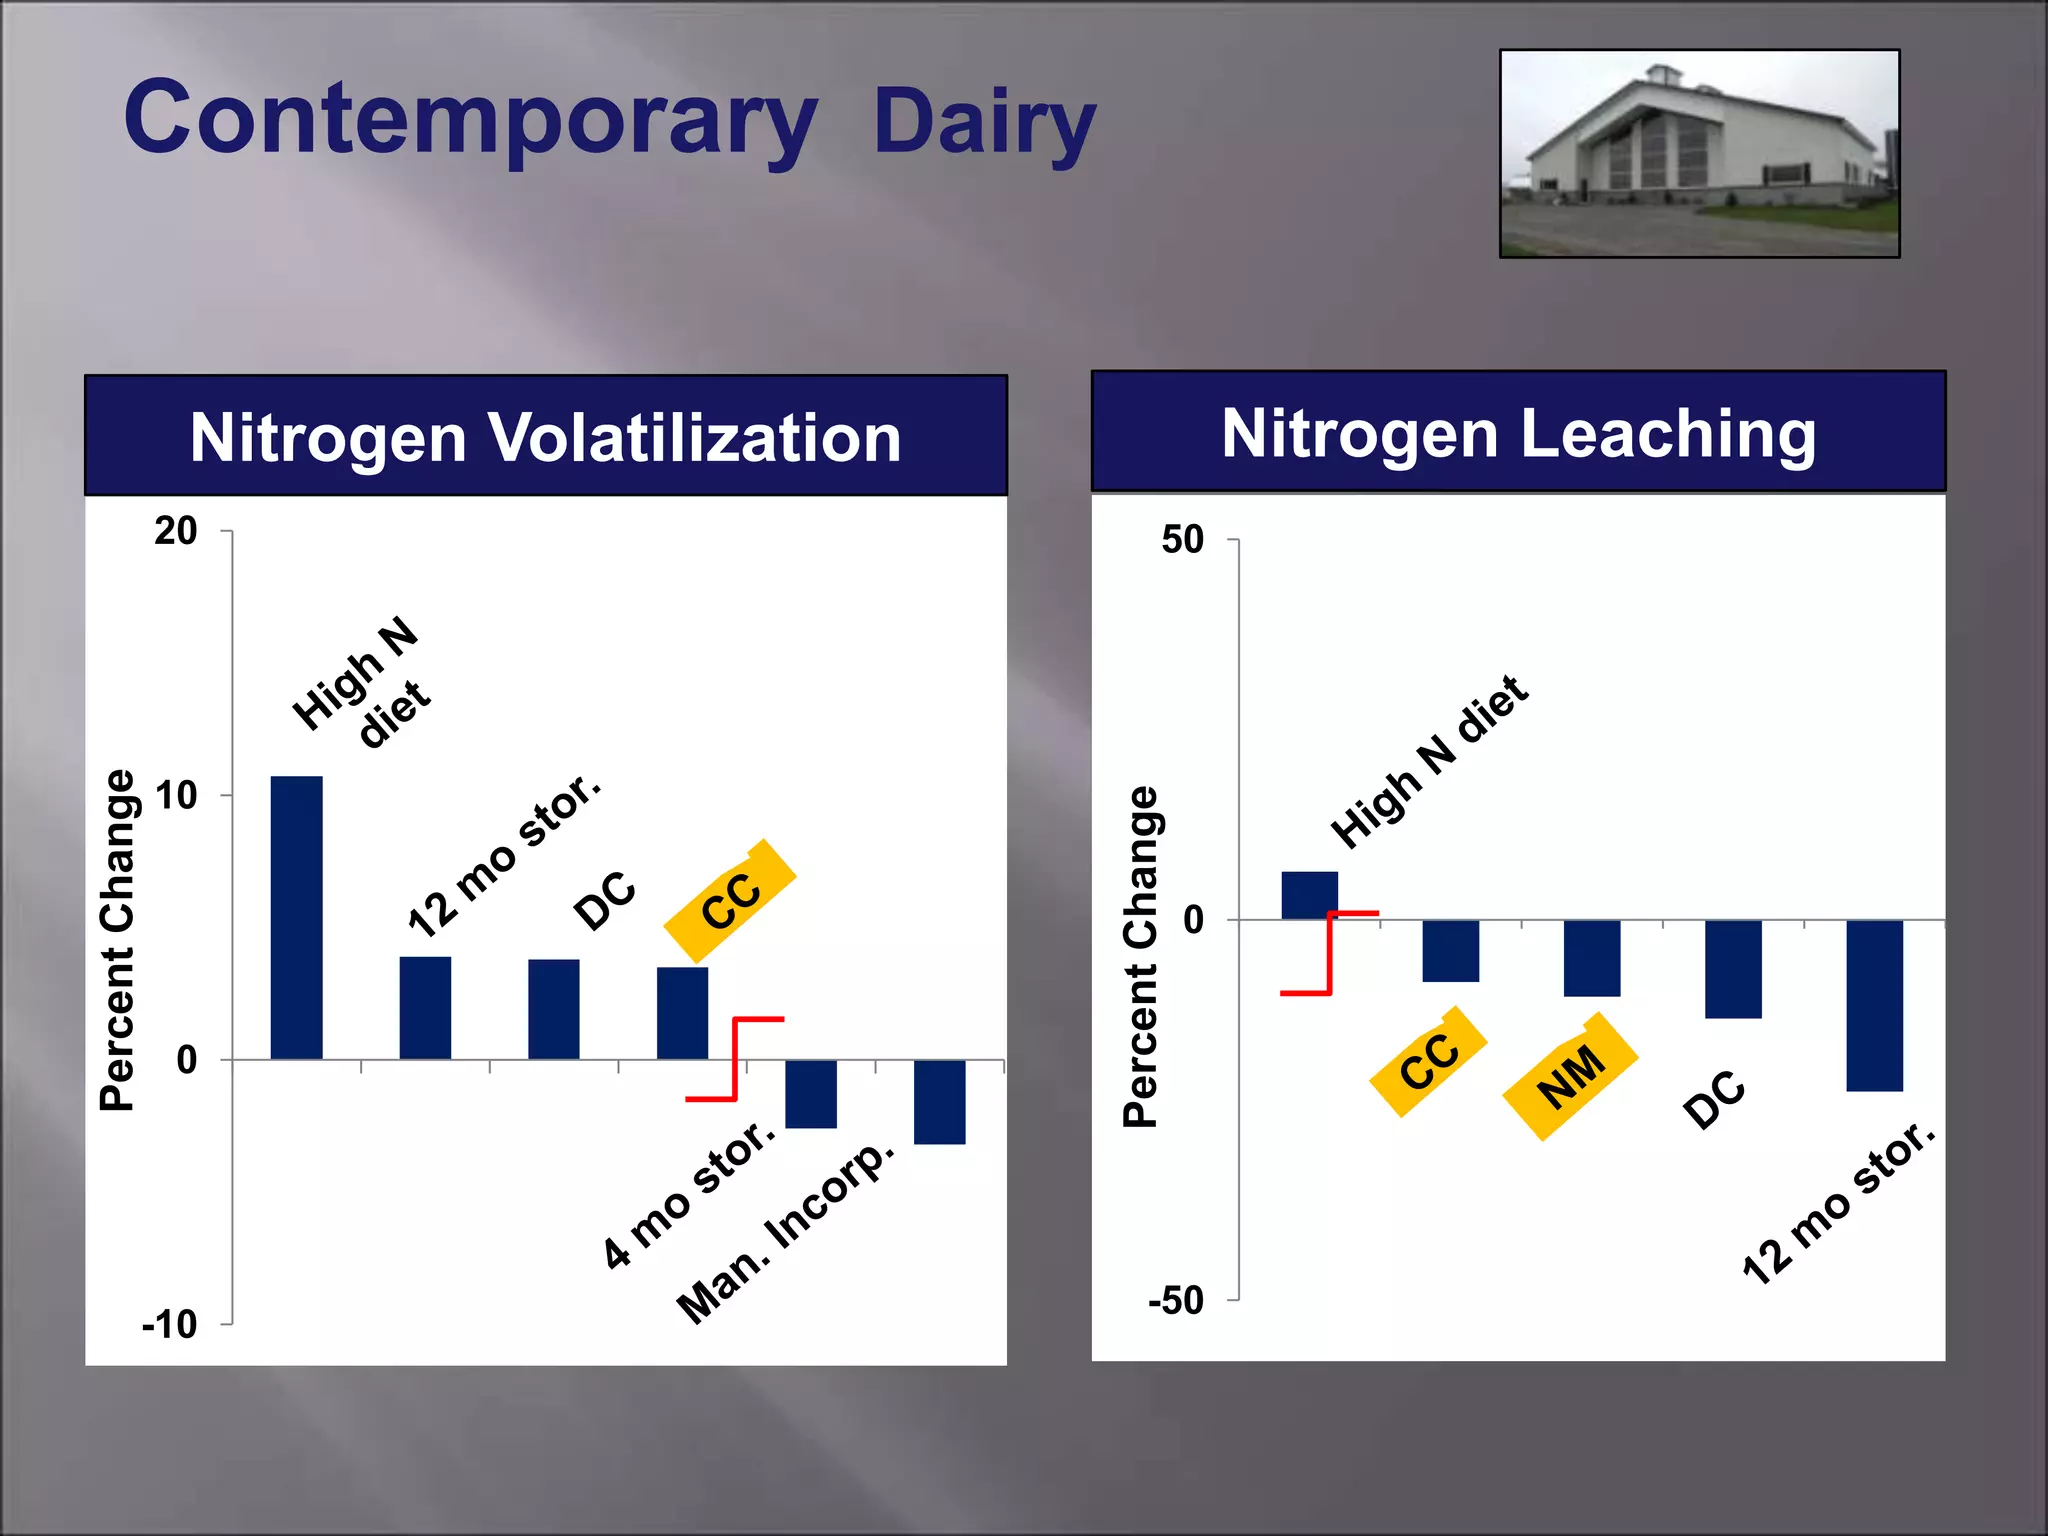
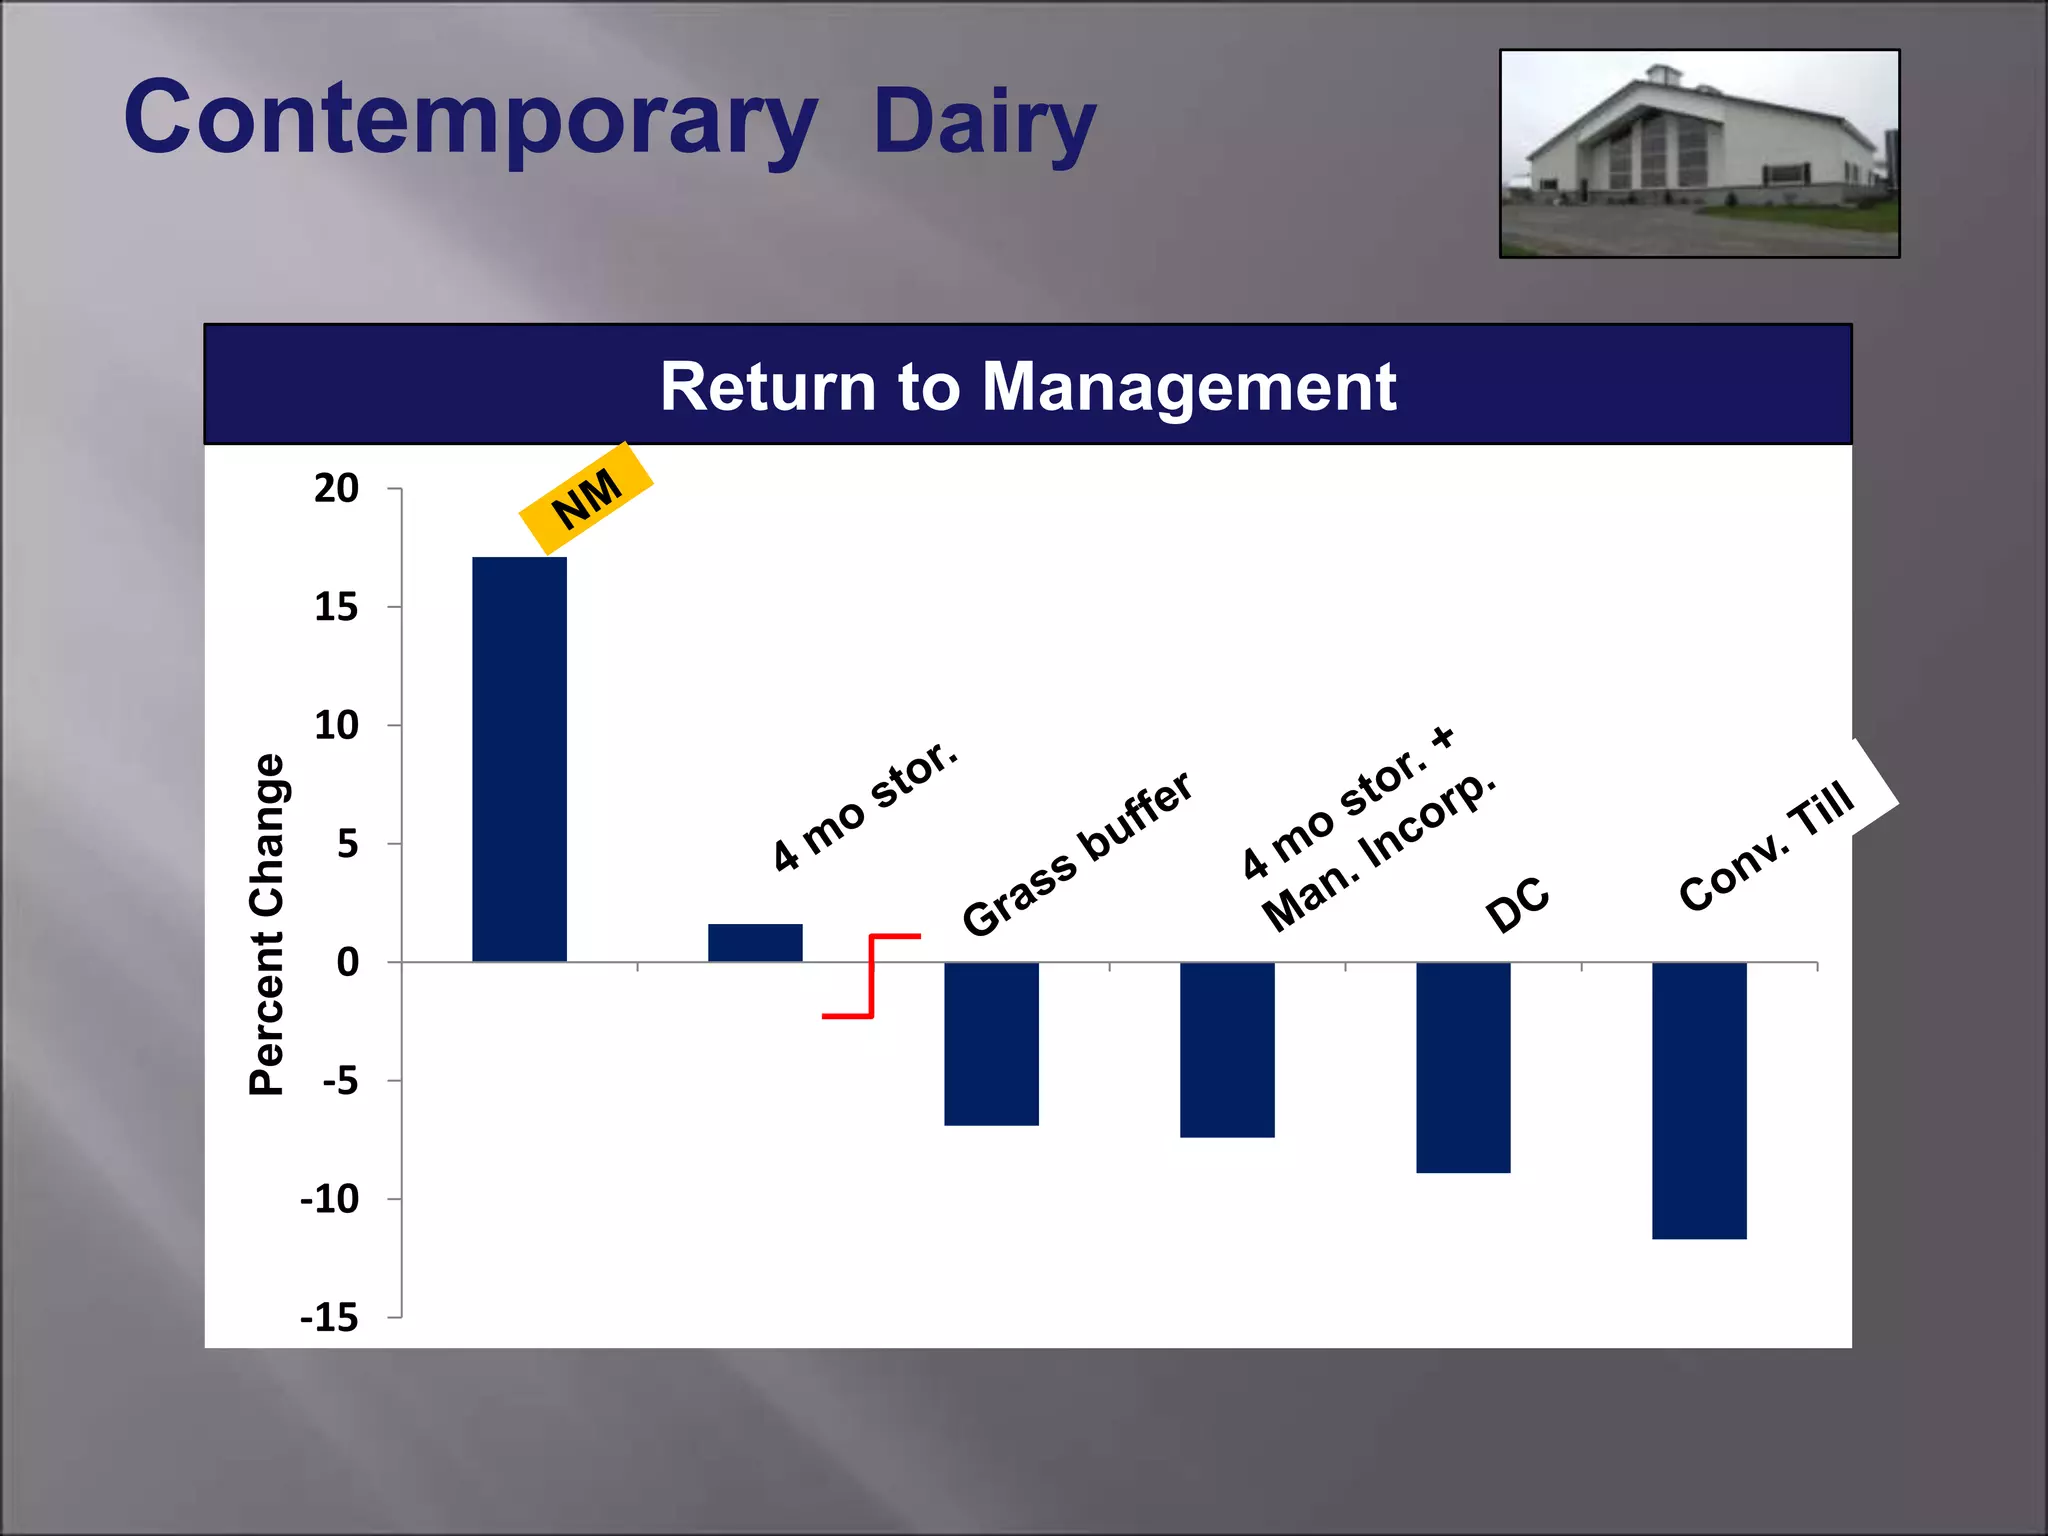
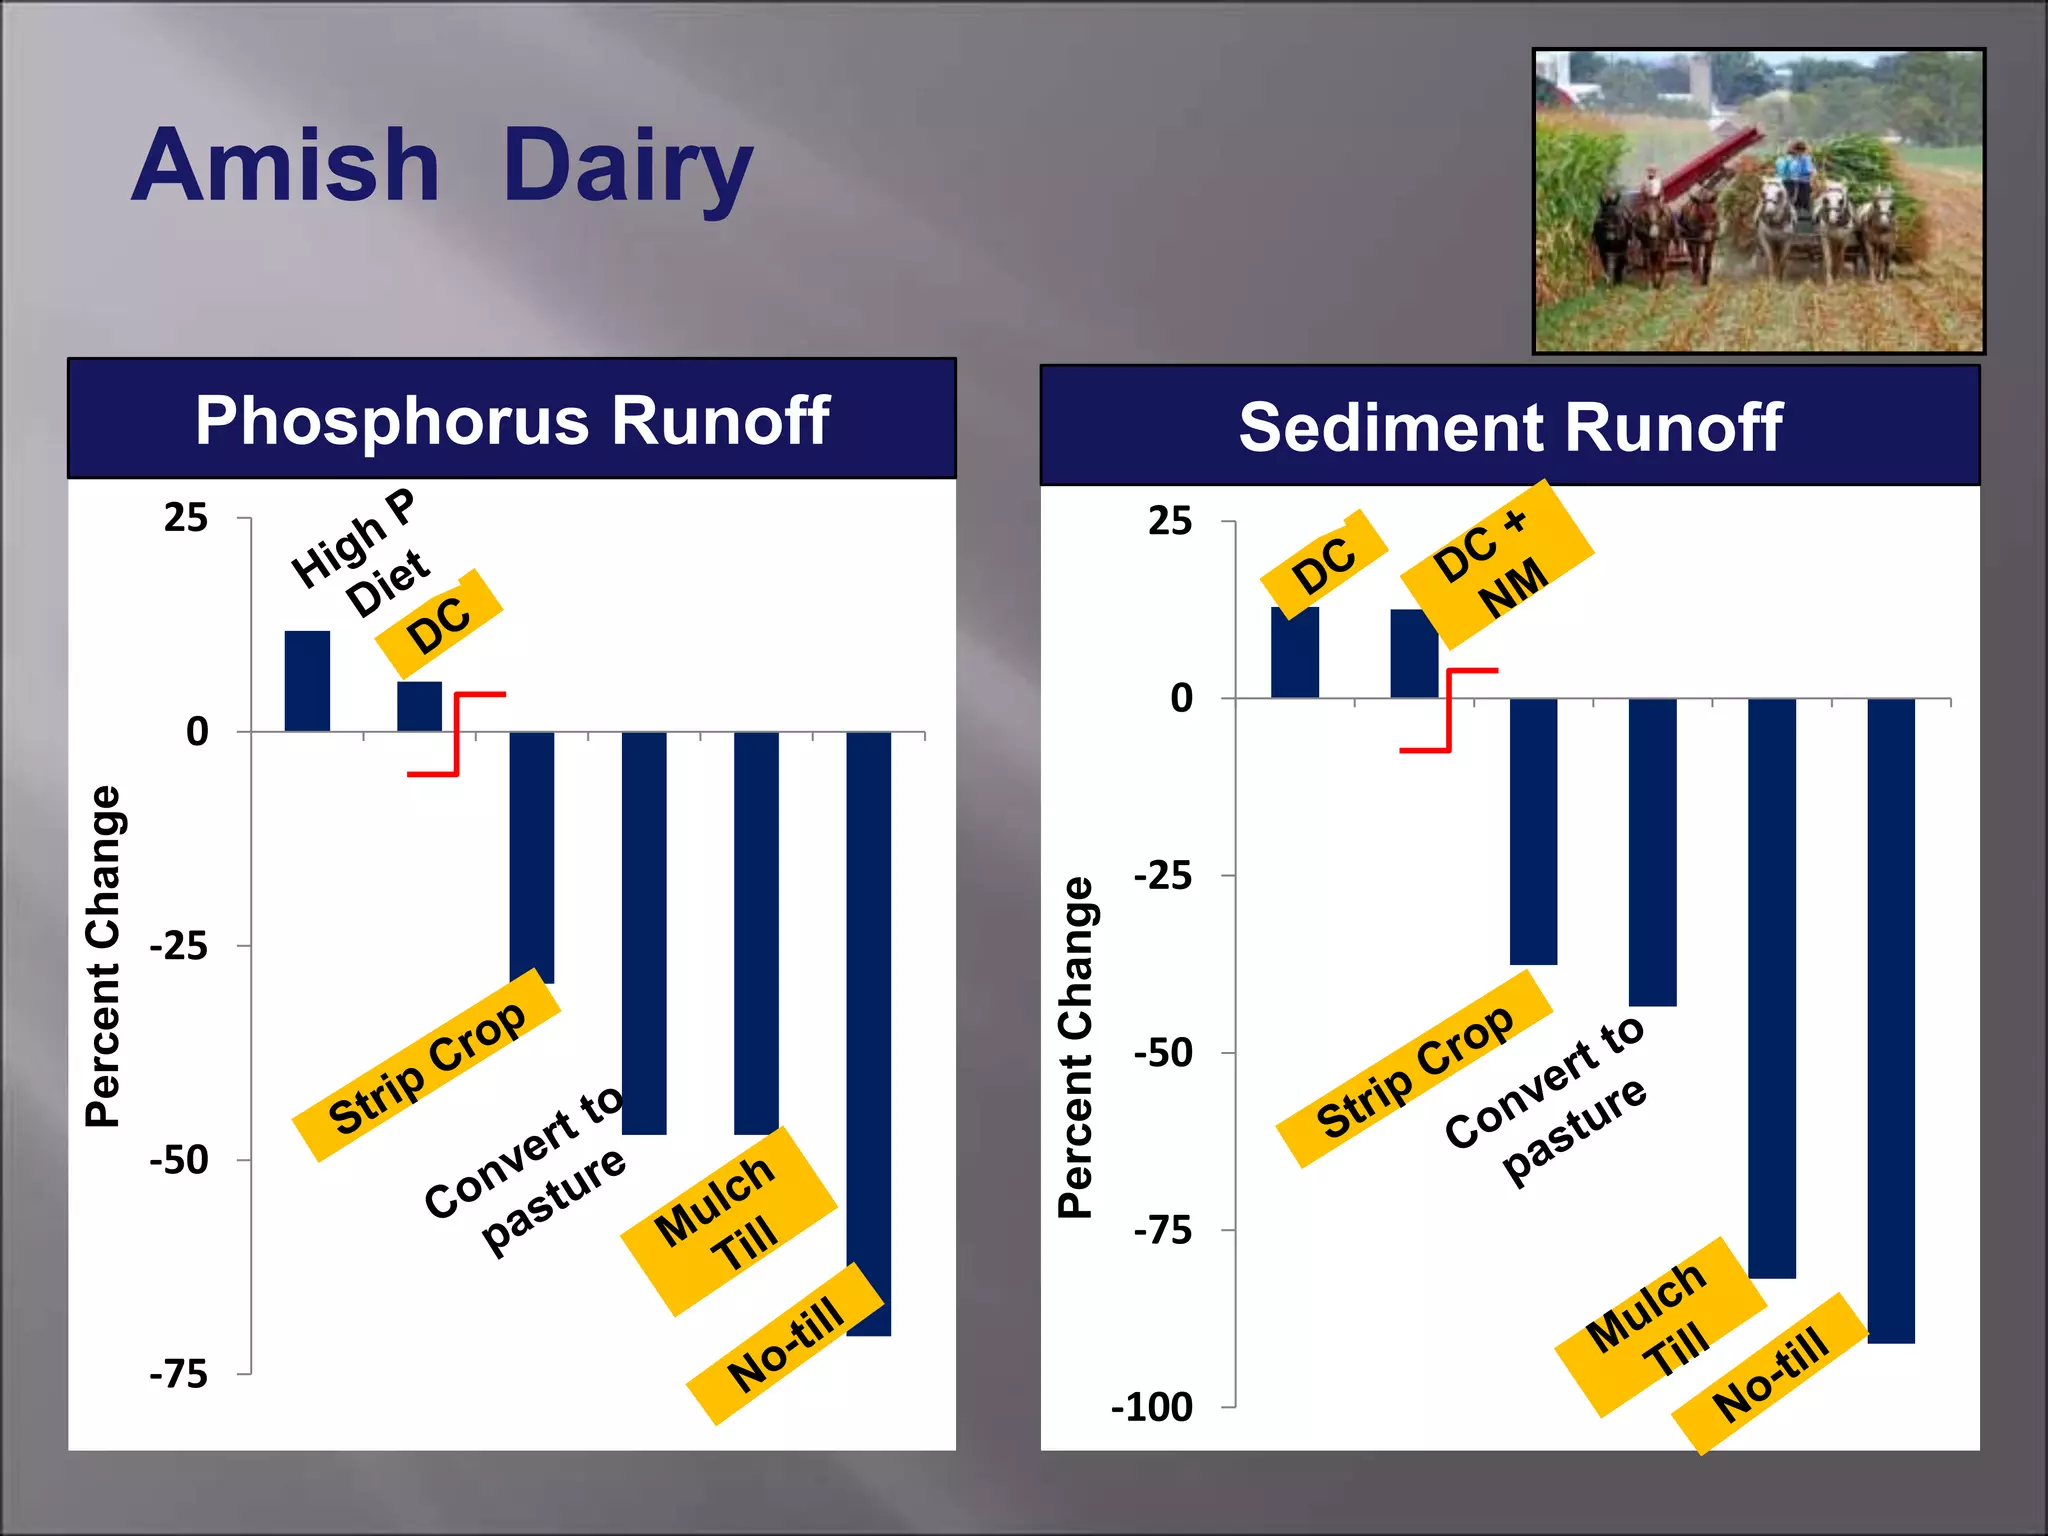
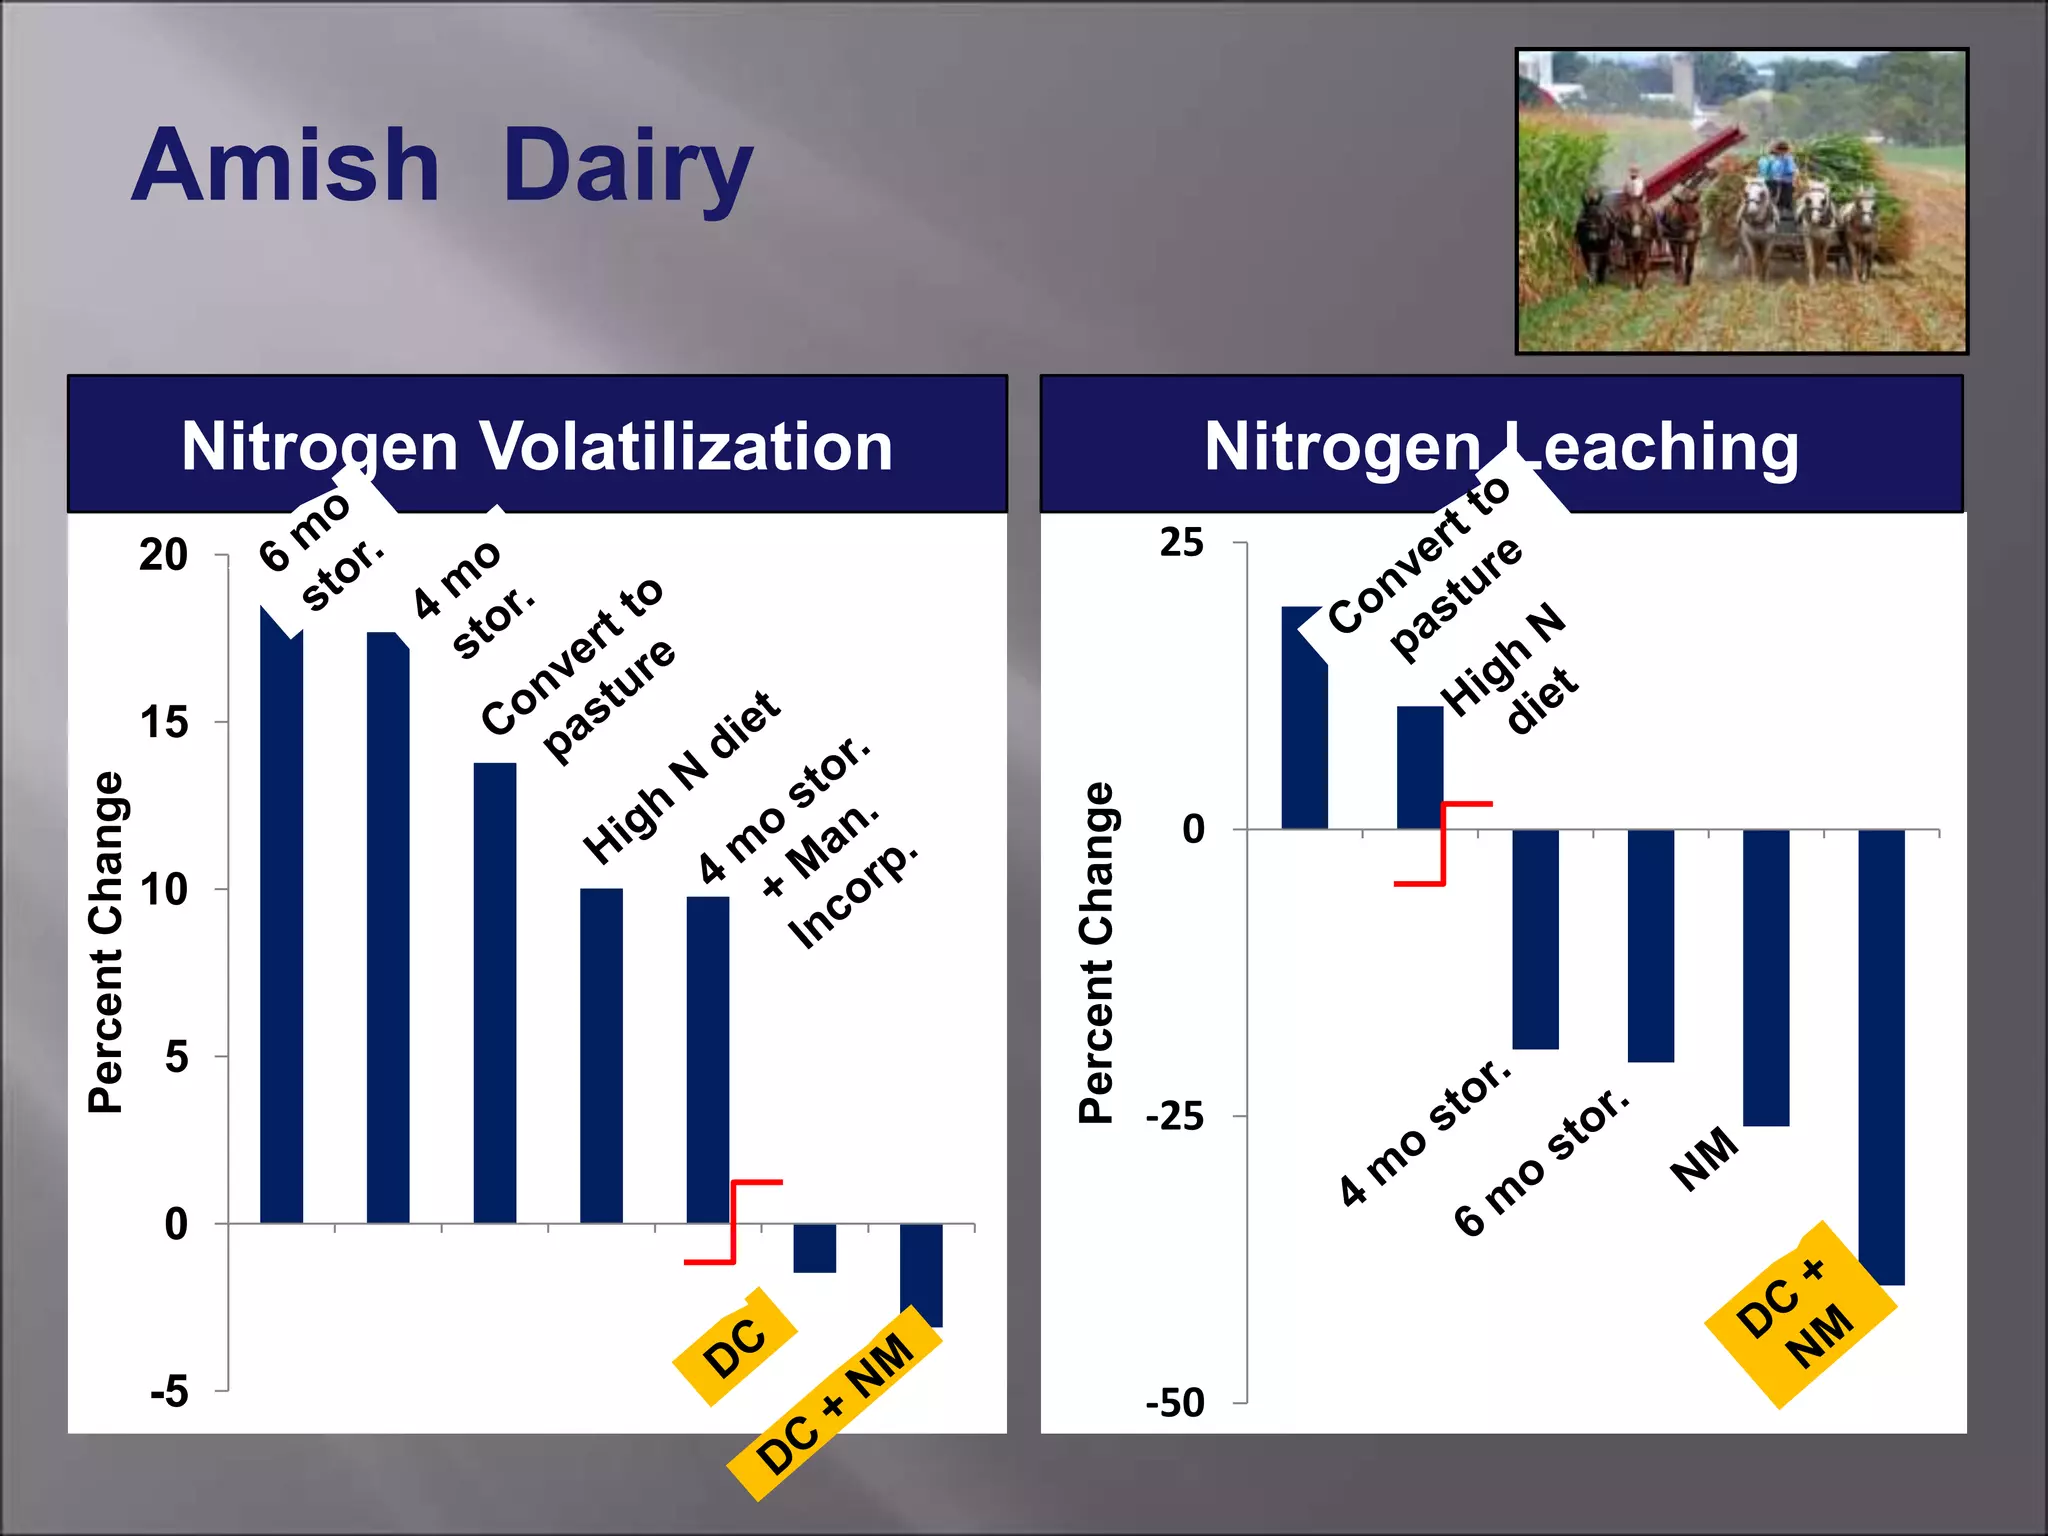
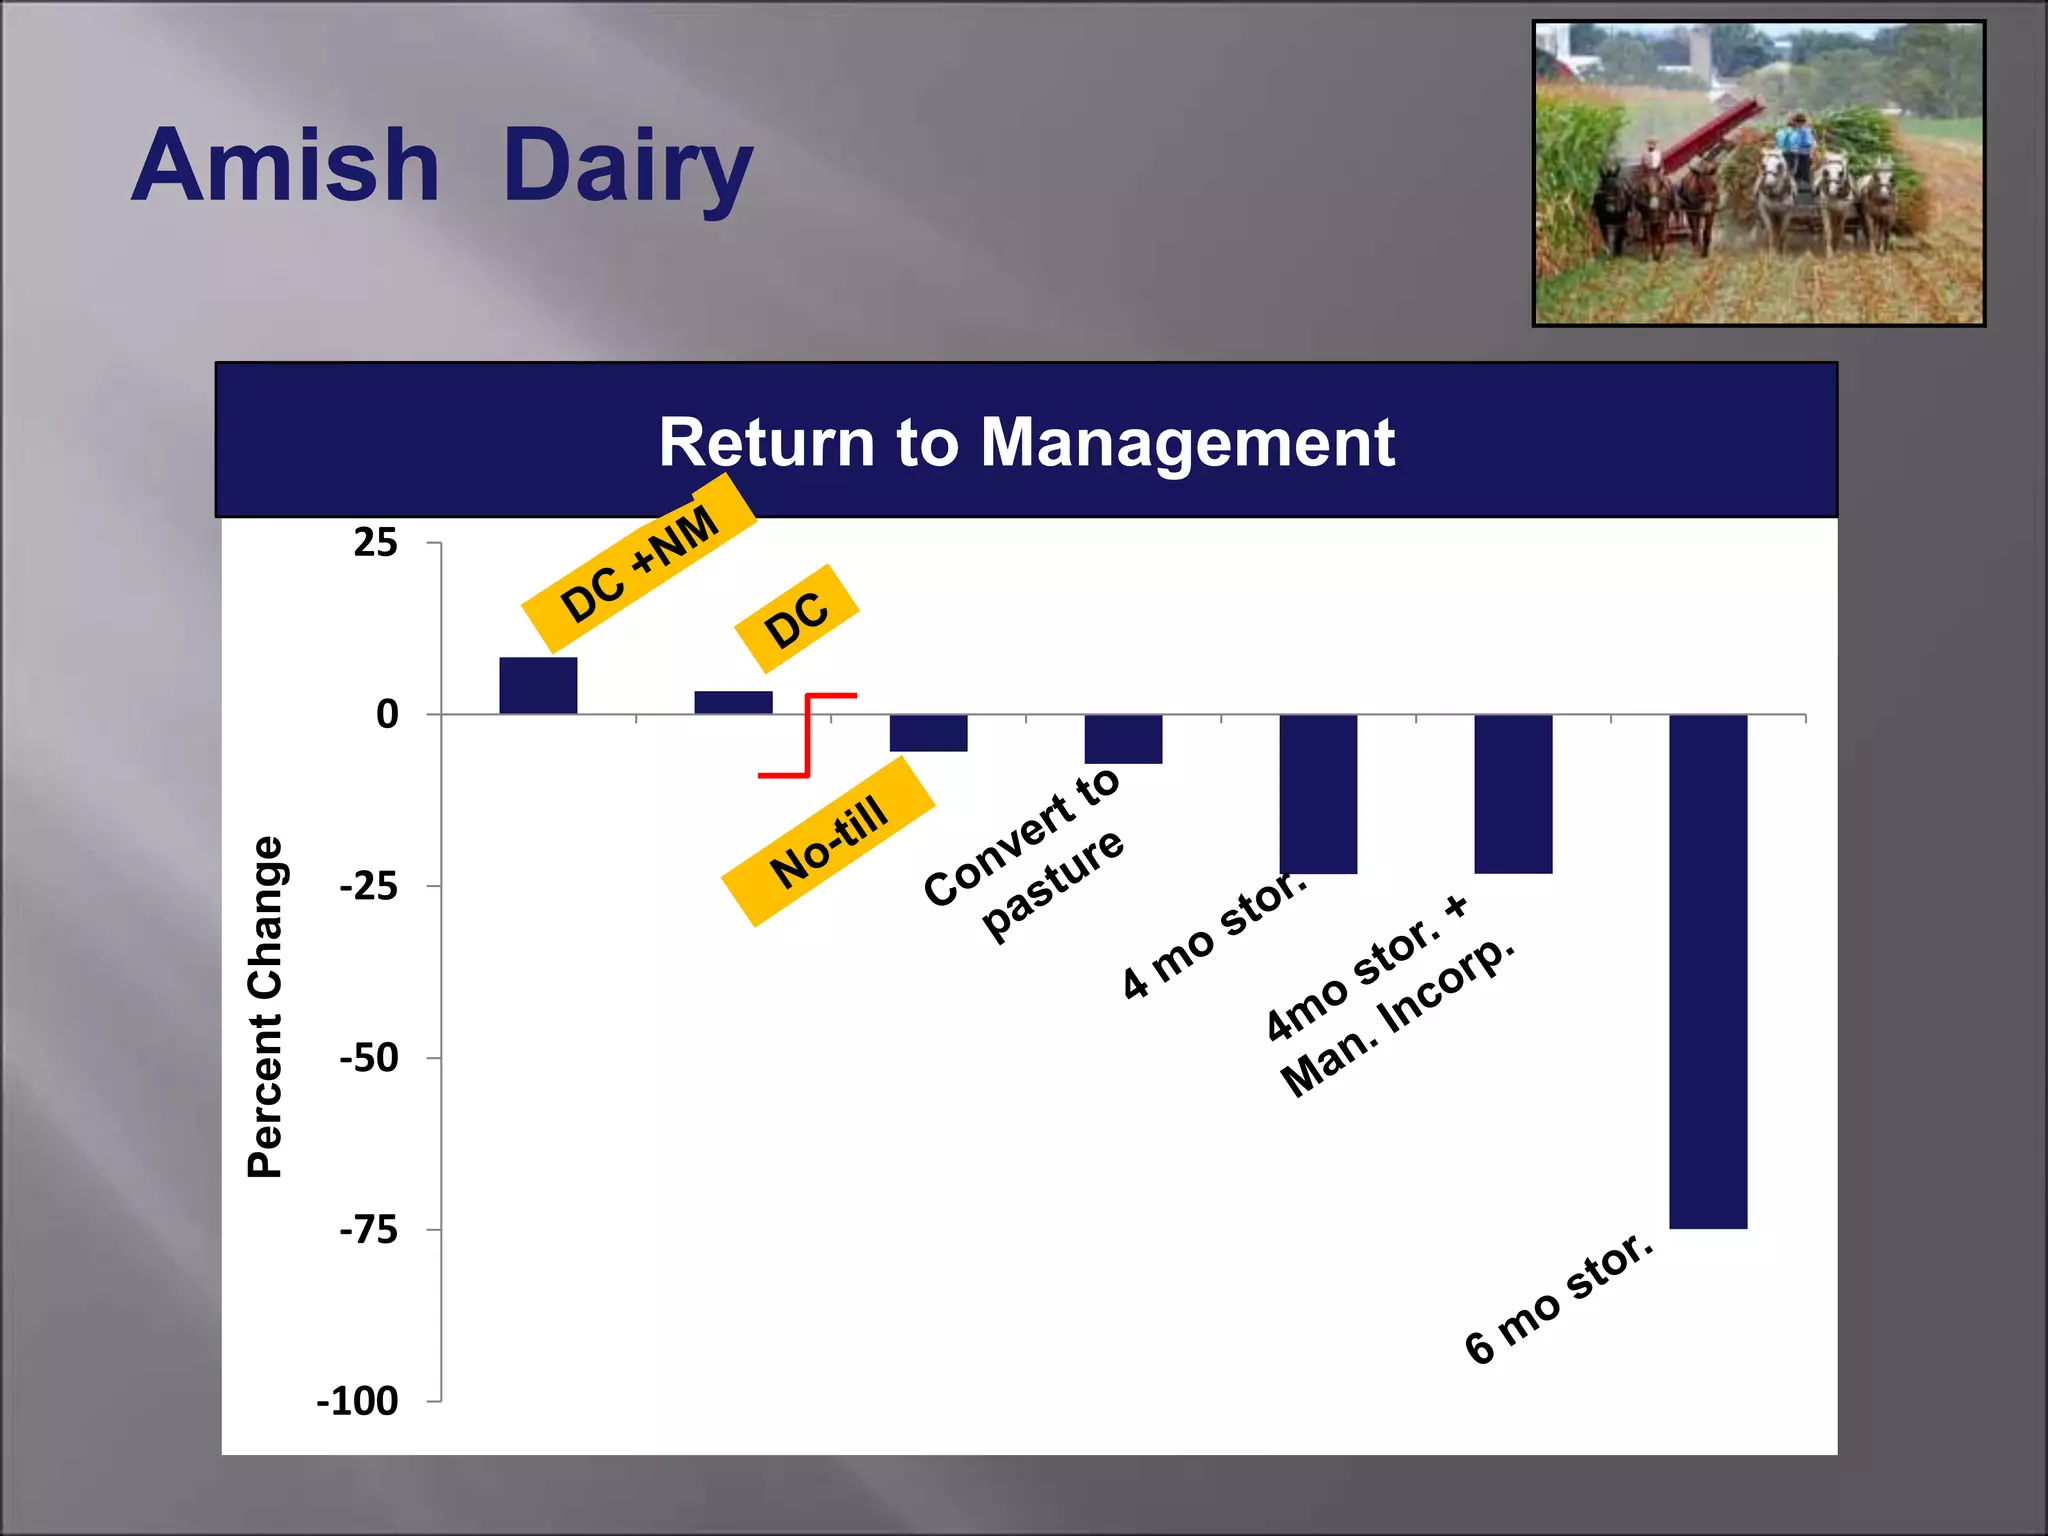
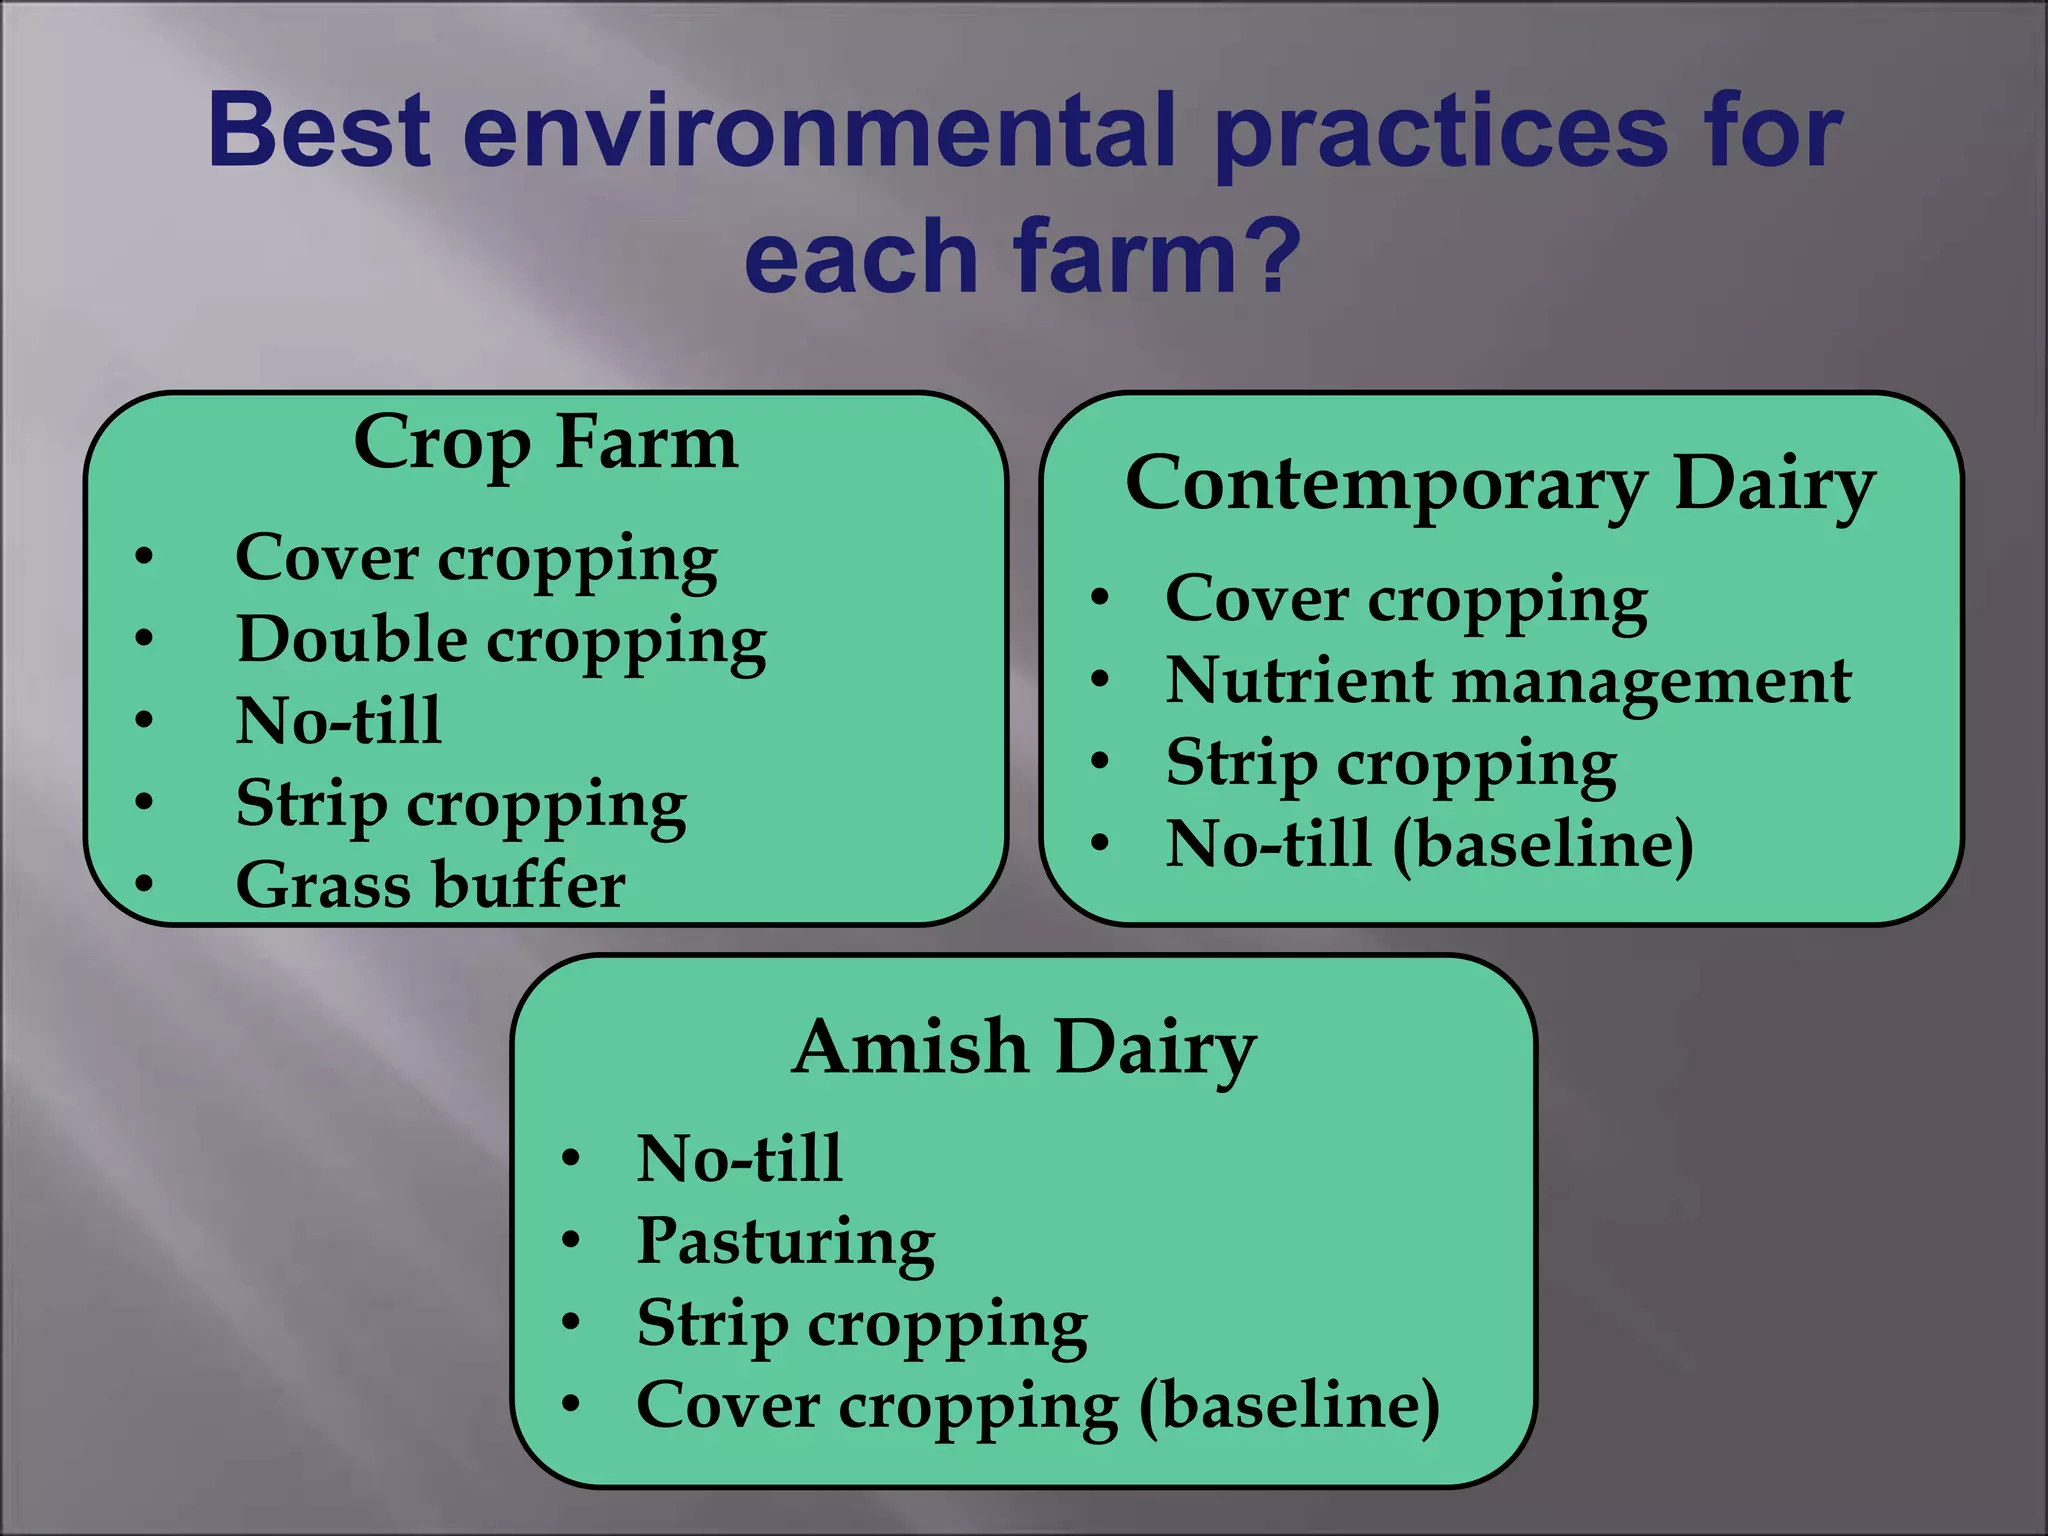
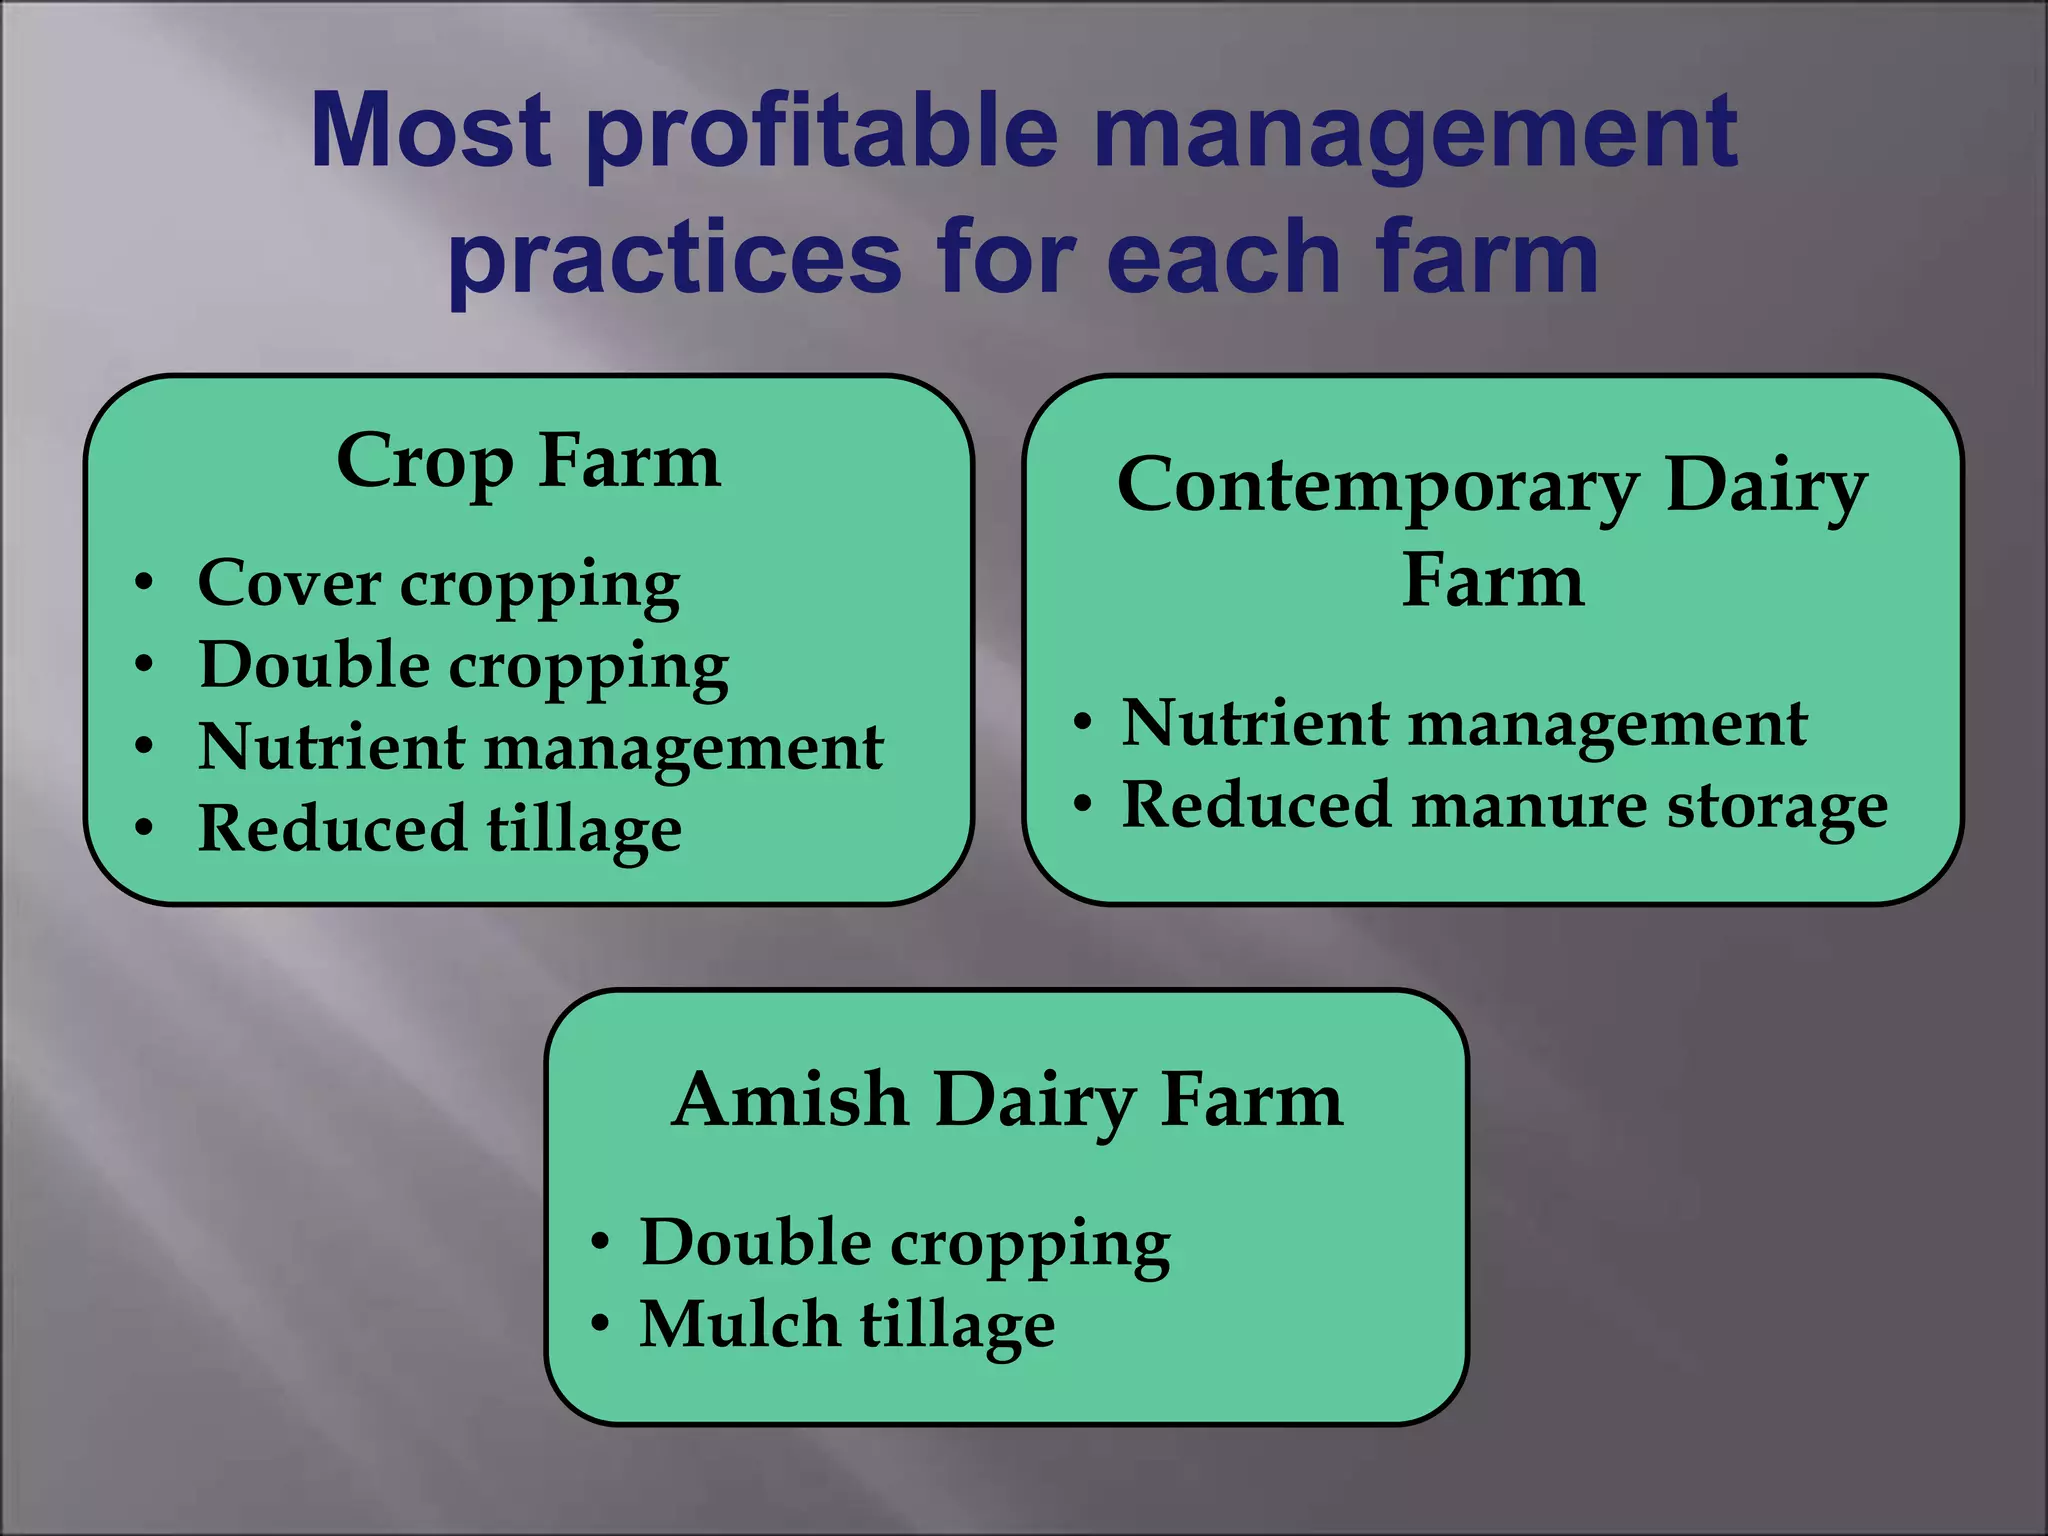
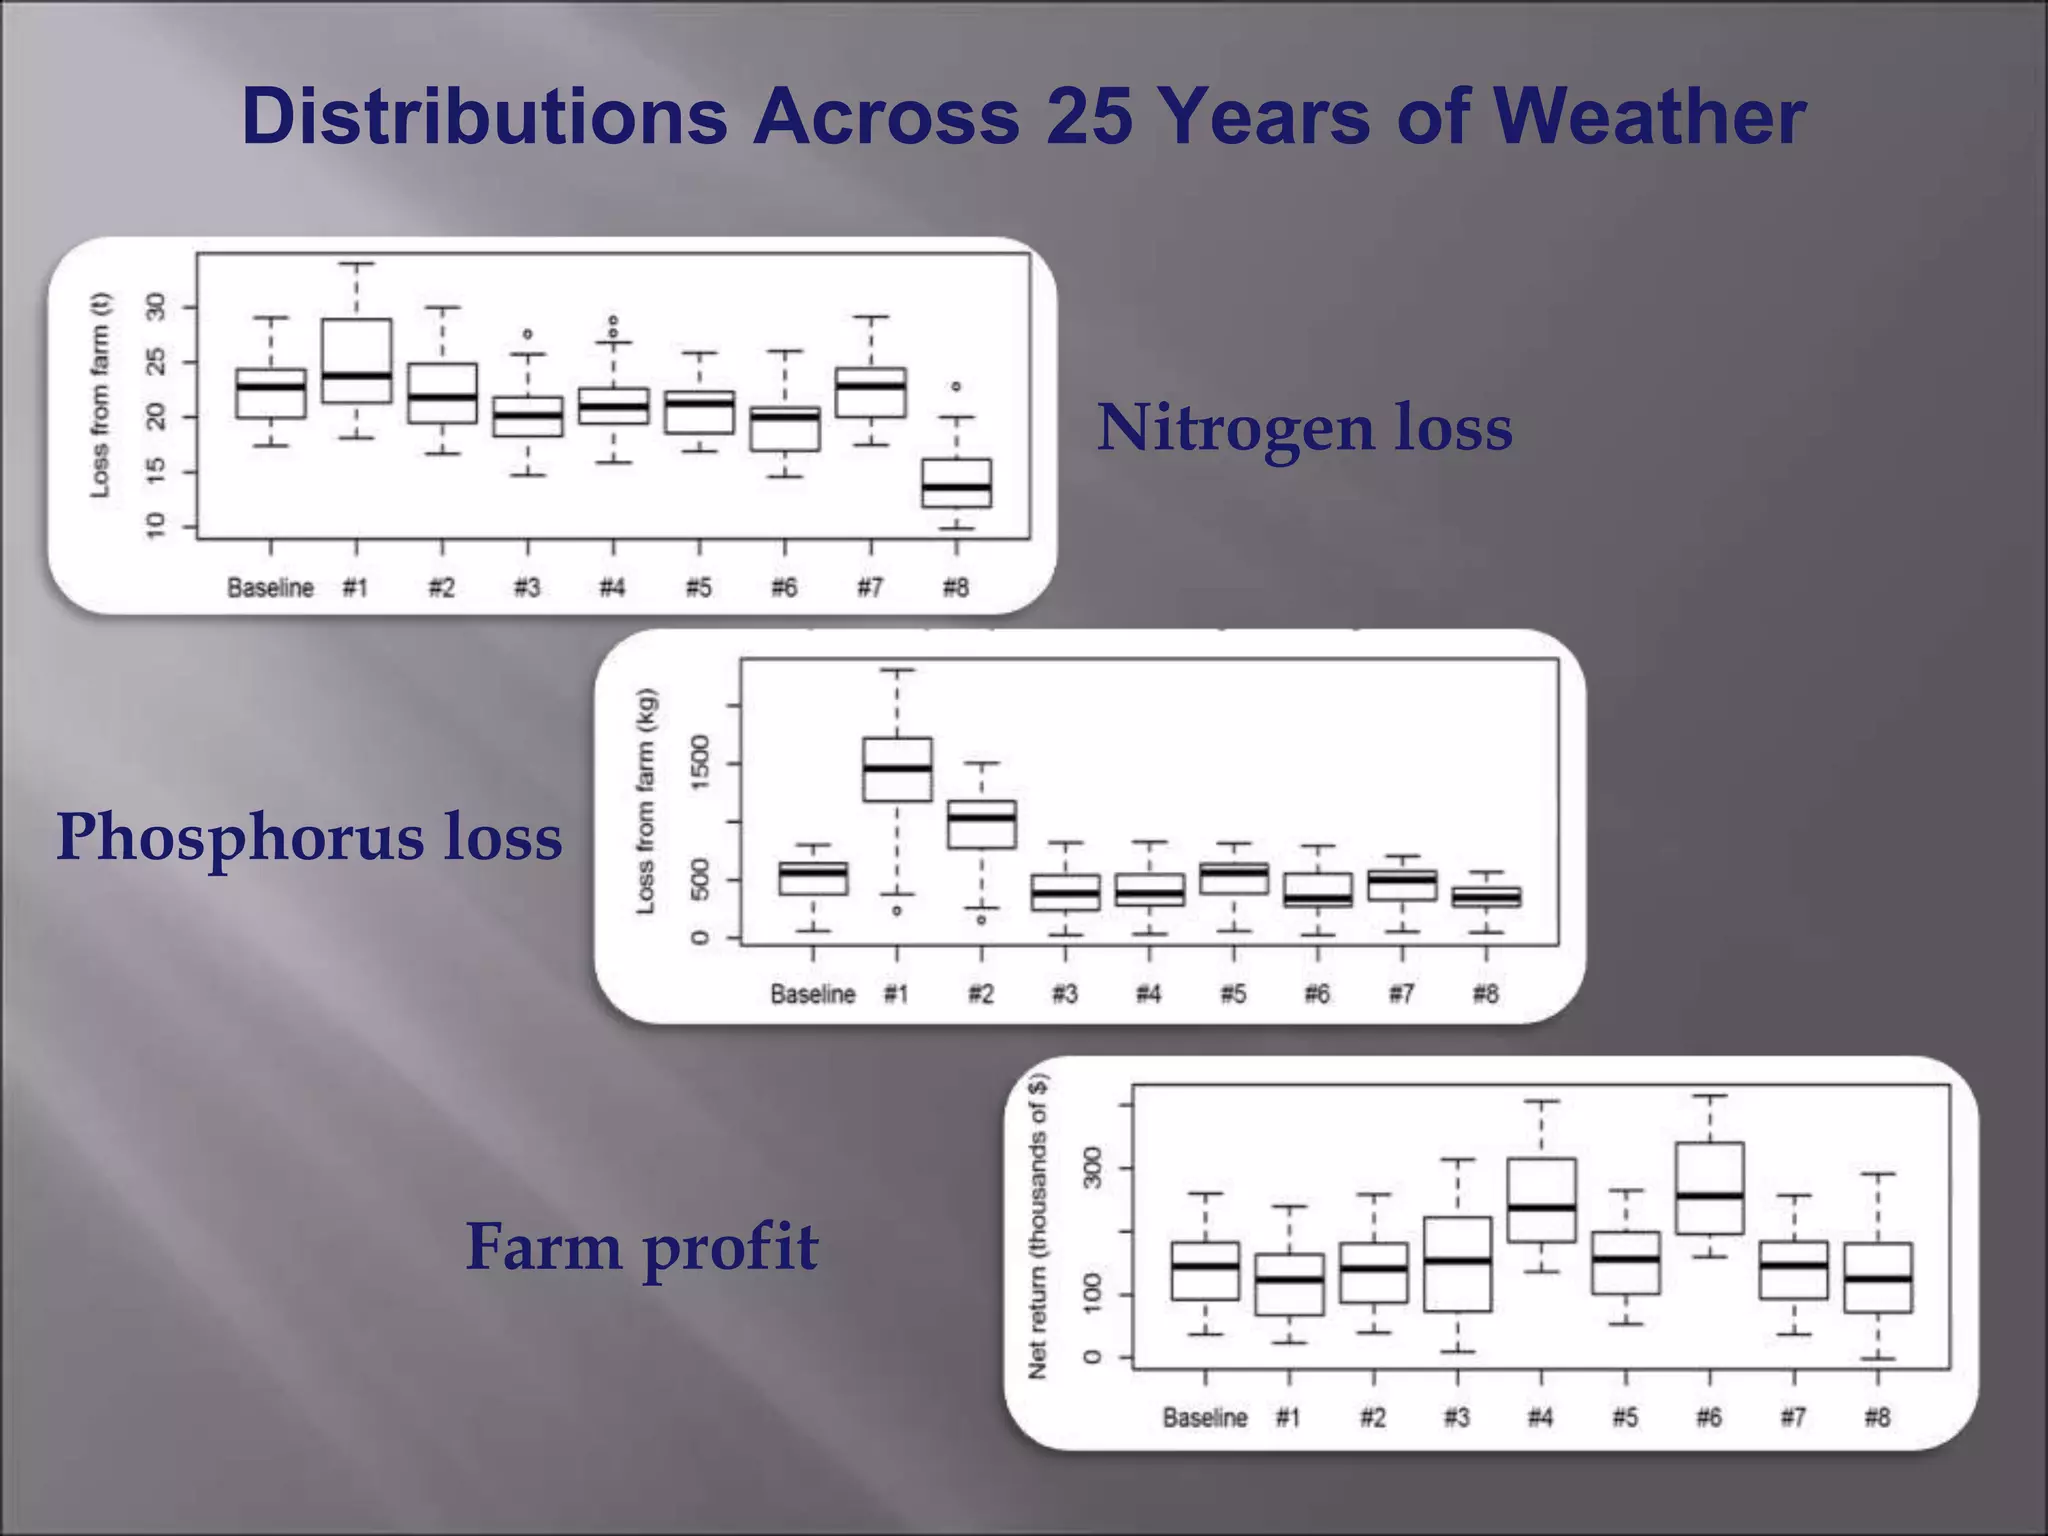
Farm-System Modeling to Evaluate
Environmental Losses and Management
Practice Cost-Effectiveness
Andy McLean, Tamie Veith, Al Rotz,
Jim Hamlett, Jim Shortle
USDA-ARS Pasture Systems and Watershed
Management Research Unit & The
Pennsylvania State University
Loadings to the Chesapeake Bay
Agriculture dominates all
other sectors for nutrient and
sediment contributions
57%
45%
70%Legend
Agriculture
Point Source
Forest
Developed
Study Region
Chesapeake Bay
Susquehanna River
Dauphin County
Lebanon County
Lancaster
County
Most Beneficial Practices as
Determined by Regional Studies
Rank Lancaster County
Informal Study (2004)
CBC (2004) Cost-effective
strategies for the Bay
1 Nutrient management plan Wastewater Treatment Plant Upgrades
2 Cover crops Diet and Feed Adjustments
3 Management advice Traditional Nutrient Management
4 Structural field practices Enhanced Nutrient Management
5 Conservation tillage Conservation Tillage
6 Implement farm conservation
plan
Cover Crops
7 Cultural field practices (crop rotation, etc.)
8 Develop farm conservation plan
9 Grass buffers, 15-ft
10 Animal waste system
Objective
Simulate representative farming
systems for this region to determine
the environmental benefit of
management practices and determine
their economic value to the producer
Baseline Descriptions
Crop Farm
Old Order Amish
Dairy
Contemporary
Dairy
400 ha (1000 ac)
4 yr rotation
C-SB-C-SB/WW
Primarily no-till
Import poultry manure
& some starter fertilizer
100 cows
120 ha (300 ac)
8 yr rotation
2(Cg)-2(Cs/WW)-4(Hay)
Primarily no-till
Low grain to forage
50% rented fields
50 cows
24 ha (60 ac)
8 yr rotation
4(Cs/WW)-4(Alfalfa)
Conventional-till
High grain to forage
Horse-drawn methods
Practices Investigated
Farm Management Cropping Strategies
Nutrient Management
Treatment Strategies
Tillage (conv., mulch, no)
Strip cropping
Manure storage (4, 6, 12 month)
Manure reallocation among crops
Manure application
(broadcast, immediate incorp.) Field-edge grass buffer
Crop conversion
(50% silage to grazed pasture)
Cover Crop
(mulch winter grain)
Double Crop
(harvest winter grain)
Dietary P (100%, 120% of NRC)
Dietary N (100%, 110% of NRC)
Tests against prior methods
Integrated Farm System Model
(IFSM)
Soil
Establish
Crop Harvest
Storage
AnimalManure
Grazing
Volatile loss
Exported manure
Purchased feed,
bedding, etc.
Feed sold
Volatile
loss
Fixed
nutrients
Volatile loss
Purchased
fertilizer
Runoff &
Leaching loss
Milk and
animals
Engine exhaust
Challenges of Modeling an Amish
Dairy Farm
Machinery Differences
 Machine specifications
 Operational efficiency
 Power requirements
 Costs
 Horses vs. Tractors
Corn Harvest
Challenges of Modeling an Amish
Dairy Farm
Operational Differences
 Labor requirements
 Timing of operations
 Representing horses
BASELINE RESULTS
Yield Comparison (t DM/ha)
IFSM
Crop
IFSM
Cont.
Dairy
NASS
District
Cons.
Corn grain 8.7 (2.0) 7.8 (1.6) 5.9 – 7.9 8.5
Corn silage — 16 (2.3) 16 16 – 21
Soybeans 2.8 (0.3) — 2.2 – 2.7 2.9
Small grain 4.2 (0.4) 1.8 (0.2) 3.0 – 3.9 5.2
Alfalfa — 9.4 7.7 11 – 13.5
Operational Timing (day of year)
IFSM
Crop
IFSM Cont.
Dairy
District
Cons.
Corn plant 129 116 110
Corn harvest 284-289 247-286 283
Wheat plant 297 309 293
Wheat harvest 183-184 118-116 176-186
Soybean plant 133 130
Soybean harvest 289-294 288-298
Hay harvest 4 cuttings 3-5 cuttings
Amish Dairy
Labor Requirements (hour)
IFSM Total
Labor
Extension
Estimate
Corn planting 65 99
Hay harvest 71 60
Corn silage harvest 335 270
Small grain planting 55 40
Manure handling 349 360
Avg. Nutrient Loss (kg/ha-yr)
IFSM
Crop
IFSM
Contemp.
Dairy
IFSM
Amish
Dairy
Chesapeake
model
N volatilized 10.4 69.2 122.7
N leaching 29.7 20.8 44.8
N denitrified 16 14.5 35.3
P runoff
(sed+sol)
1.2 0.4 1.7 0.19-0.84
P buildup 8.9 -4.6 28.2
Erosion 2132 294 2381 1424-2376
MANAGEMENT PRACTICE
PERFORMANCE
-100
-50
0
50
100
150
200
250
300
PercentChange
-50
0
50
100
150
200
PercentChange
Phosphorus Runoff Sediment Runoff
Crop Farm
-25
-20
-15
-10
-5
0
5
10
15
20
25
PercentChange
-40
-20
0
20
40
60
80
100
120
140
PercentChange
Nitrogen Leaching Return to Management
Crop Farm
-50
0
50
100
150
200
250
300
350
400
PercentChange
-50
0
50
100
150
200
250
300
350
400
450
PercentChange
Phosphorus Runoff Sediment Runoff
Contemporary Dairy
-50
0
50
PercentChange
-10
0
10
20
PercentChange
Nitrogen Volatilization Nitrogen Leaching
Contemporary Dairy
-15
-10
-5
0
5
10
15
20
PercentChange
Return to Management
Contemporary Dairy
-100
-75
-50
-25
0
25
PercentChange
-75
-50
-25
0
25
PercentChange
Phosphorus Runoff Sediment Runoff
Amish Dairy
-50
-25
0
25
PercentChange
-5
0
5
10
15
20
PercentChange
Nitrogen Volatilization Nitrogen Leaching
Amish Dairy
-100
-75
-50
-25
0
25
PercentChange
Return to Management
Amish Dairy
Amish Dairy
• No-till
• Pasturing
• Strip cropping
• Cover cropping (baseline)
Contemporary Dairy
• Cover cropping
• Nutrient management
• Strip cropping
• No-till (baseline)
Crop Farm
• Cover cropping
• Double cropping
• No-till
• Strip cropping
• Grass buffer
Best environmental practices for
each farm?
Most profitable management
practices for each farm
Amish Dairy Farm
• Double cropping
• Mulch tillage
Contemporary Dairy
Farm
• Nutrient management
• Reduced manure storage
Crop Farm
• Cover cropping
• Double cropping
• Nutrient management
• Reduced tillage
Distributions Across 25 Years of Weather
Nitrogen loss
Phosphorus loss
Farm profit
Cost Effectiveness
Phosphorus loss Nitrogen loss
Conclusions
 Most management practices have a nutrient
tradeoff - at least as they are modeled in this study
 Farm operation/strategy/location may have a
significant impact on which practices are best
 Double cropping shows great potential
 Cost-effective reductions from ―low-hanging
fruit‖
 Corn appears to be water limited, not nutrient
limited, therefore we may be over-applying nutrients to
corn
 Profitability and the environment benefited from
transferring manure nutrients from corn to small grain
Application of Results
 Provide a basis for recommendations by
conservation district officials and policymakers
 Hopefully encourages farmers to experiment with
these practices
USDA
Pasture Systems and Watershed
Management Research Unit
University Park, Pennsylvania
Agricultural Research Service

Farm System Modeling to Evaluate Environmental Losses, Profitability, and BMP Cost-Effectiveness

Editor's Notes

  • #2 Mike Hubler and Larry Baum from the Dauphin County Conservation District and officials at the Lancaster and Lebanon County Conservation Districts helped categorize and characterize farms.
  • #3 Source of PA nutrient loadings, as calculated by the Chesapeake Bay Model
  • #4 Study region is 3 counties on East side of Susquehanna River. Loadings drain to river and straight down into Bay.~2500 farmsThe larger farms are feed crop farms (corn/soybean). Average farm size = 40 ha But median = 20 haThe green (good) N area is mountain top forest.
  • #6 Need to properly characterize current and suggested management impacts at the FARM level.If practice changes aren’t economically feasible, or practical with available labor, then they aren’t going to be implemented well and the anticipated pollution reduction will be overstated.
  • #7 Define and characterize categories of farms for Dauphin, Lancaster, and Lebanon Counties of Southeastern PA, so that farms typical of theregion may be represented in IFSM.Simulate current farm conditions as baseline models
  • #8 Apply BMP scenarios to the baseline farm models to evaluate BMP impact on nutrient/sediment losses and farm profitability.4 categories of BMPs investigated, based (roughly) on EPA’s “core four” BMP list. (i.e., the types that EPA has identified as necessary to meet goals)
  • #9 Process-based, farm-scale Outputs are annualaverages over 25 years varying weather Simulates the economics of farm operations- costs, revenues, profit (return)Simulates flow of nutrients in and out of farm boundaries
  • #13 Yields compared well with NASS and local conservation officialsTable 1. Yield comparison (tDM ha-1) based on USDA-NASS (2012) reports, conservation district estimates, and IFSM simulations*. * USDA-NASS (2012): 10-yr averages; Conservation District (personal communication): estimates of recent past; IFSM 25-yr mean (SD).# USDA-NASS = hay; IFSM = 2 cuts hay, 2 cuts silage.
  • #14 Also evaluated operational performance of farms (timing of operations, labor requirements)
  • #15 And
  • #18 Graphs show percentage change from baseline for select scenariosHighlighted scenarios seemed to be the most cost-effective overall for each farm typeCC = Corn (200 ha) and soybeans (200 ha) are only cash crops. A cover crop of winter rye is grown on 100% of the corn land (200 ha) after corn harvest and killed in the spring before soybean planting.100% CC = (100% soybean land has a winter rye cover crop. 100% of corn land is cover cropped with grass. Cover crops are killed in the spring.)
  • #28 Nitrogen:Contemporary Dairy seems to be more consistent but less precise (wider ranges, all centered around roughly the same median) than the crop farm. BUT the crop farm y-axis has a 20t range and the dairy y-axis range is only 10t
  • #33 Distribution and density of agricultural land, elevation, and physiographic regions within a representative subregion of the study area (PennDOT 2012, USDA 2002).
  • #36 A variety of sources were used to gather data and to evaluate model output, to make sure that we were accurately representing these specific farm types in southeastern PA.
  • #37 Output parameters evaluated for determining the impact of the change in management practice
  • #41 SPARROW estimated loadings from agricultural sources delivered to streams and rivers in the Bay watershed (1997 conditions)Total N: red category = 6 to 33 kg/ha/yrP: red = 0.2 to 0.85 kg/ha/yrSed: red = 30 to 238 Mg/km = 3,000 to 23,800 t/ha (or 300 to 2,380 kg/ha)http://stat.chesapeakebay.net/?q=node/130&quicktabs_10=1&quicktabs_15=1