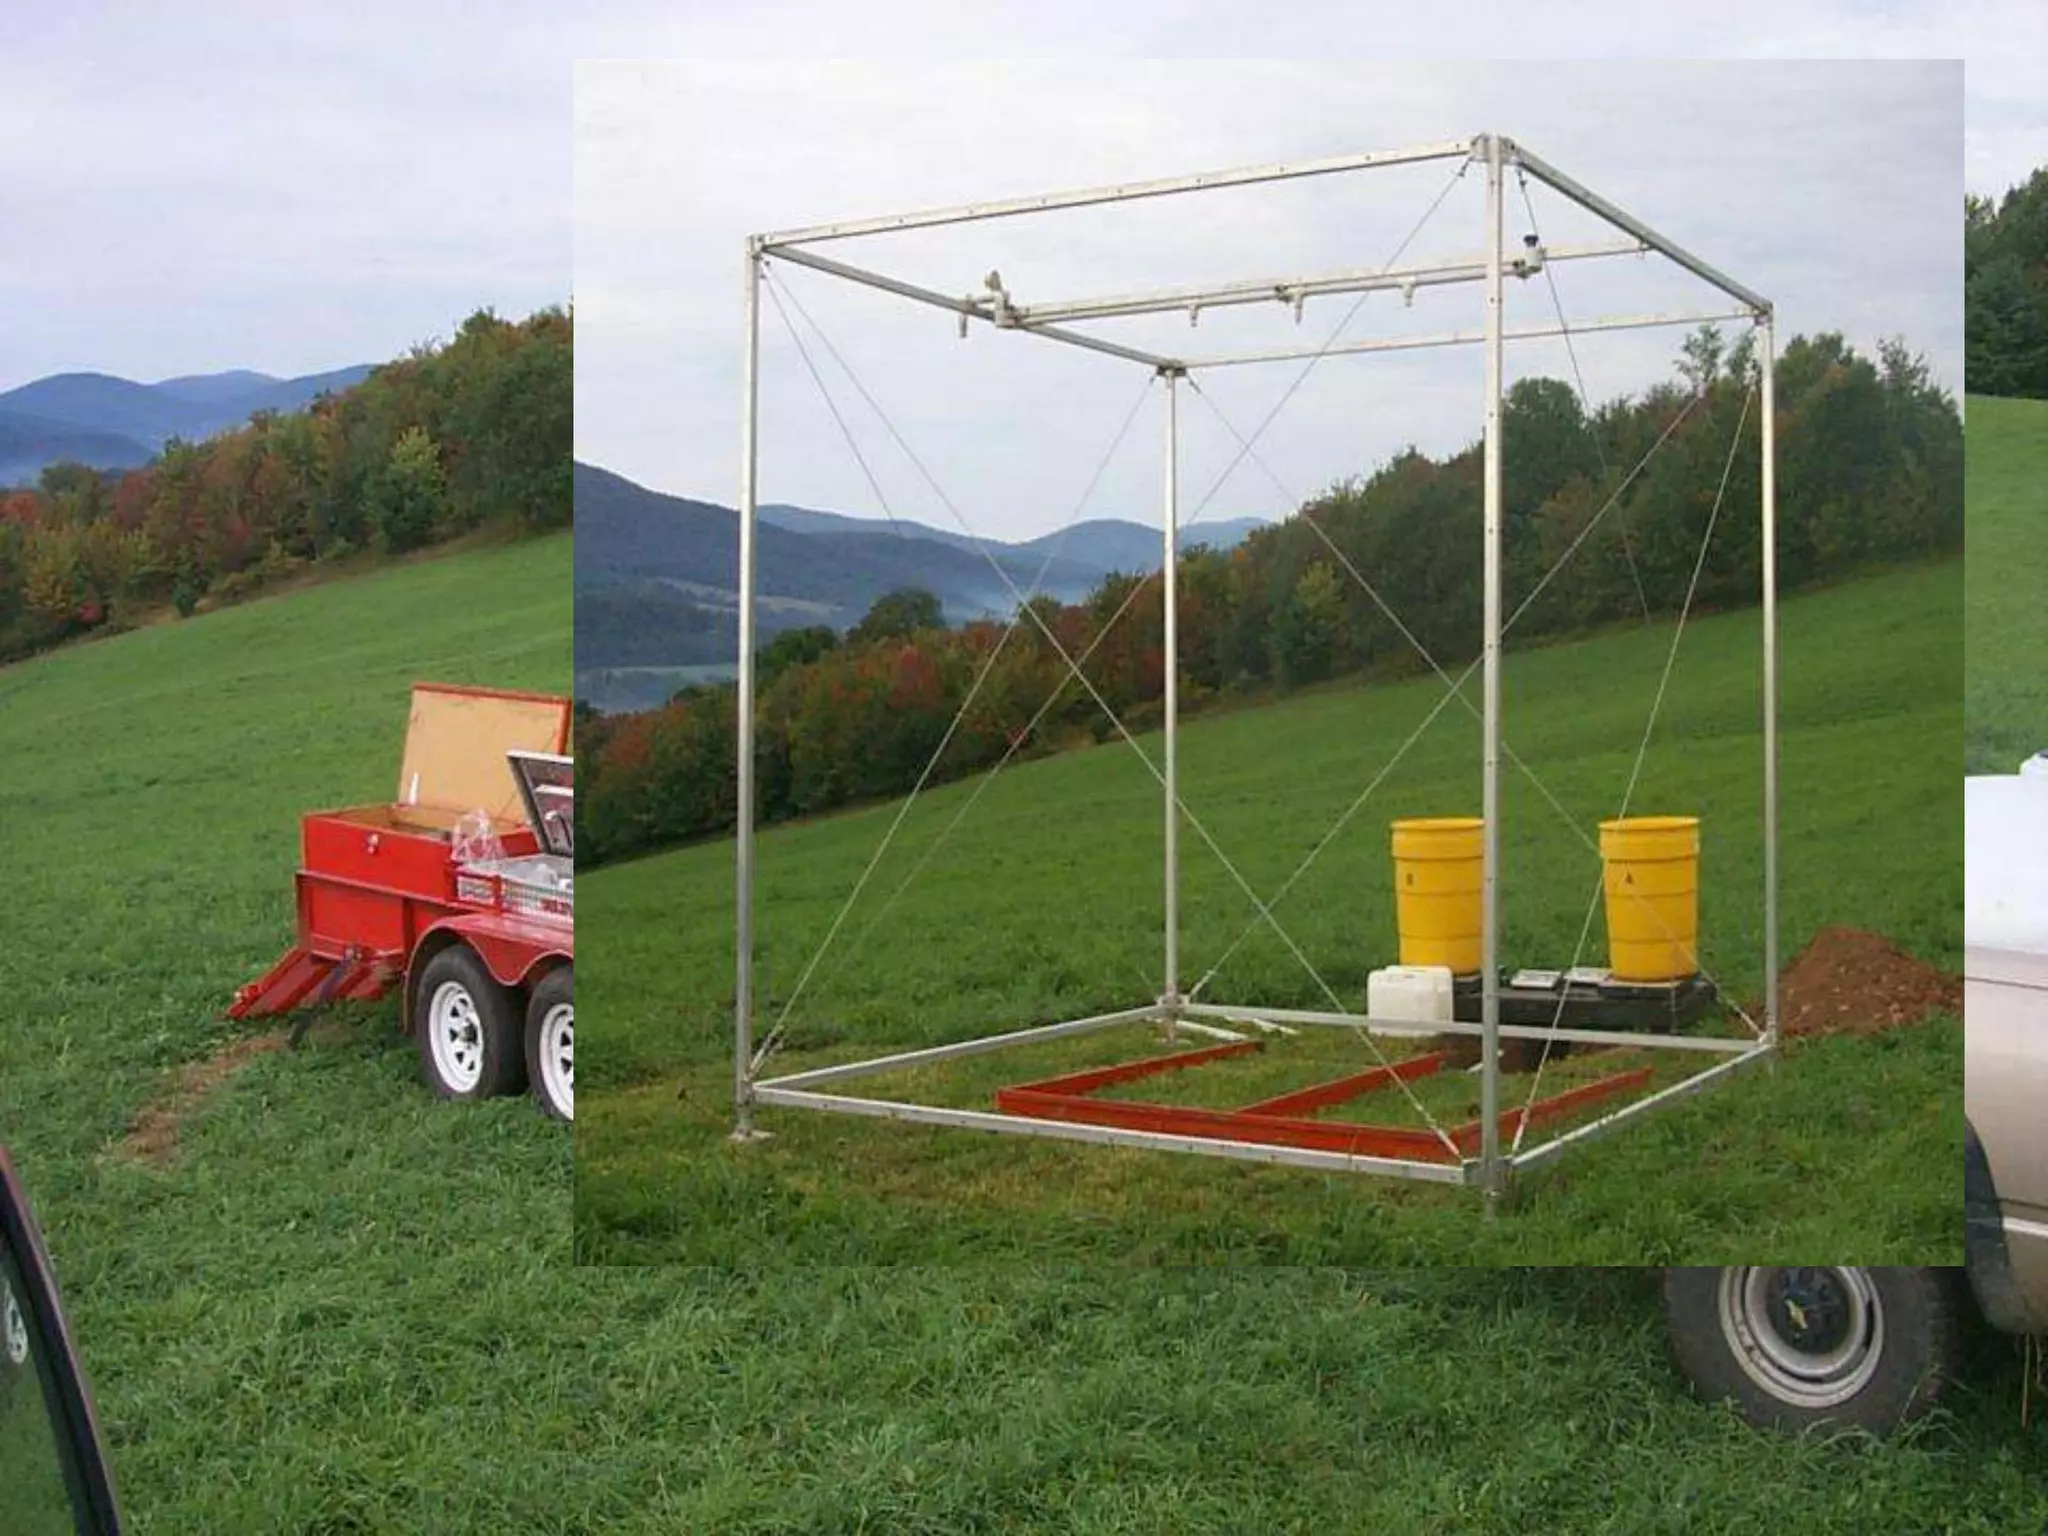
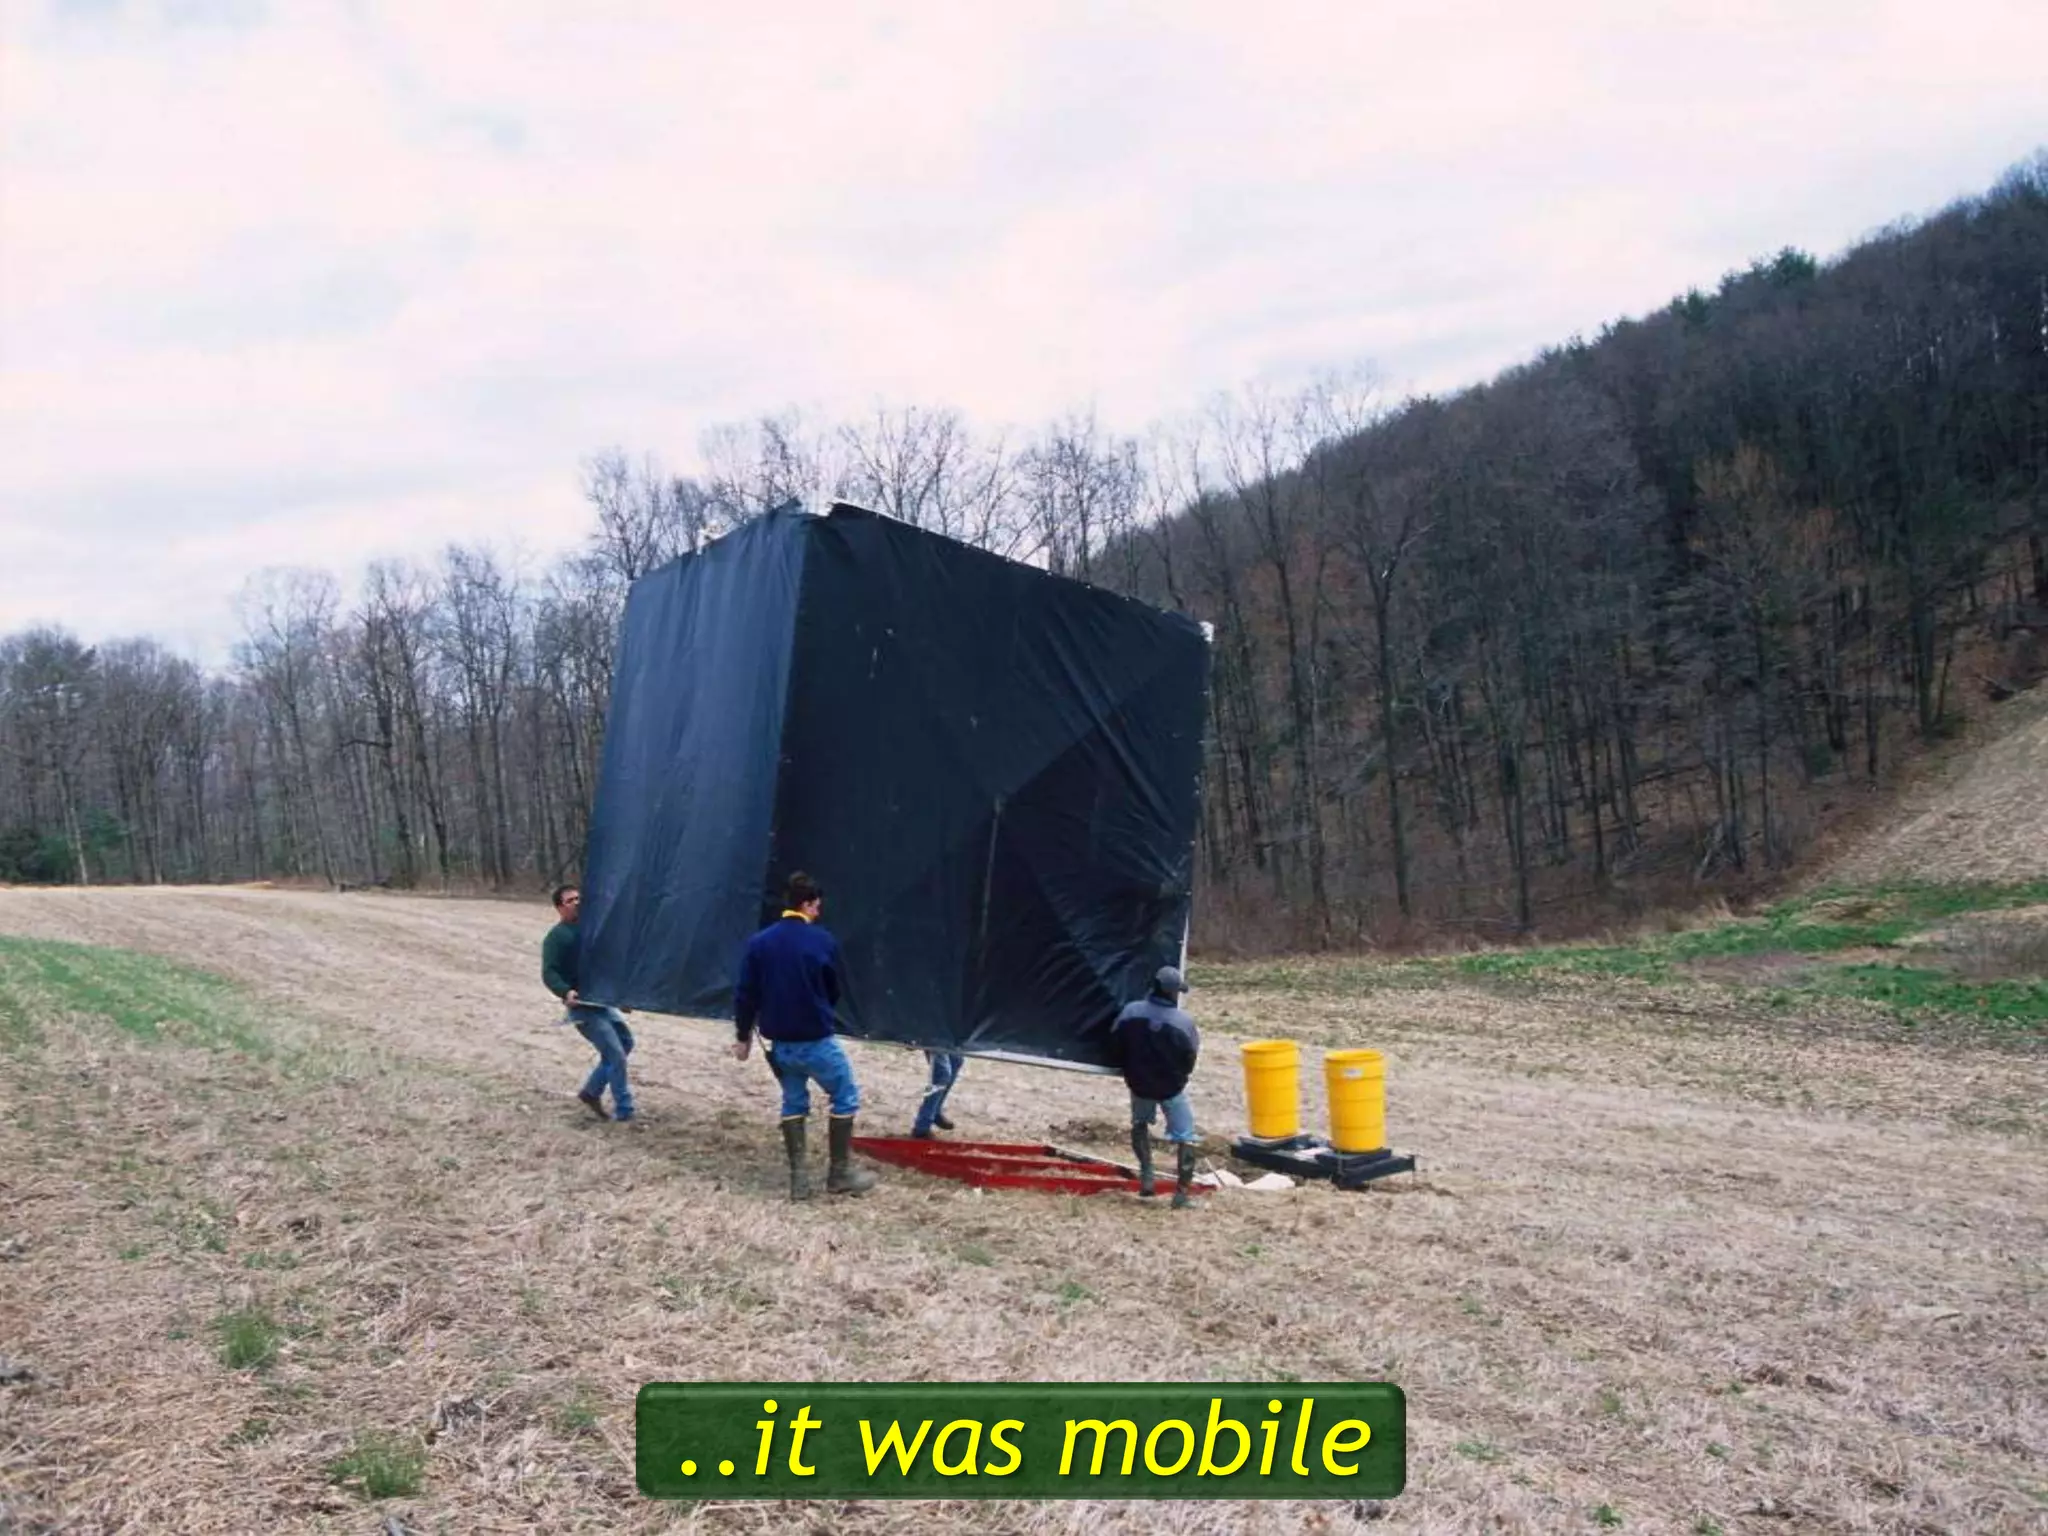
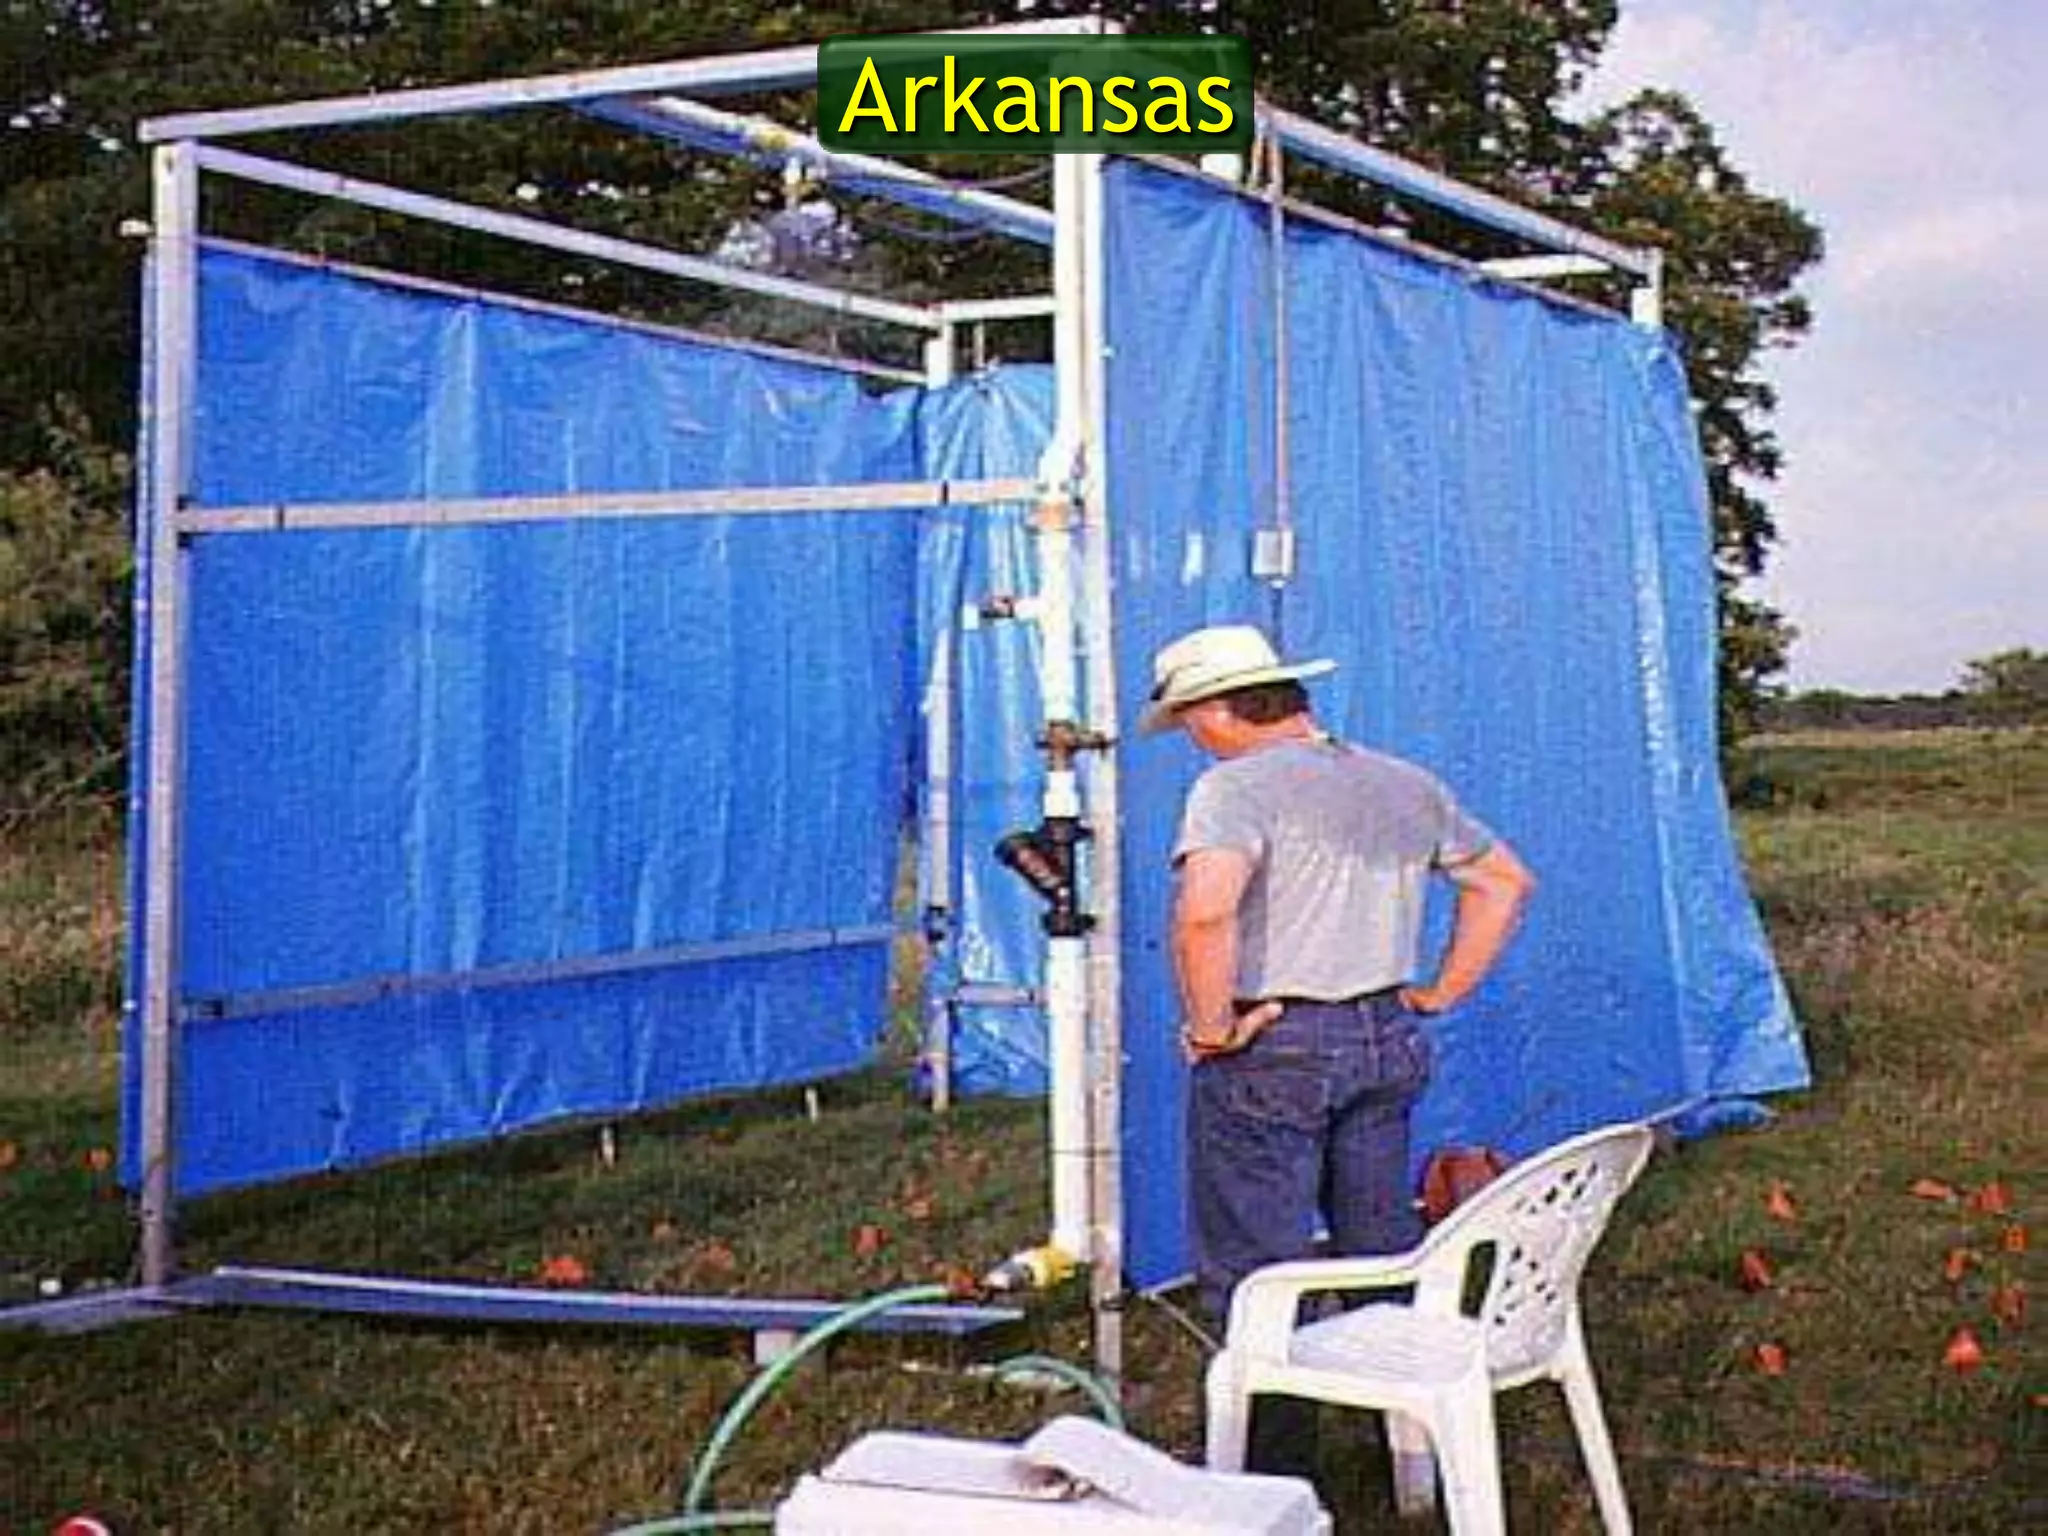
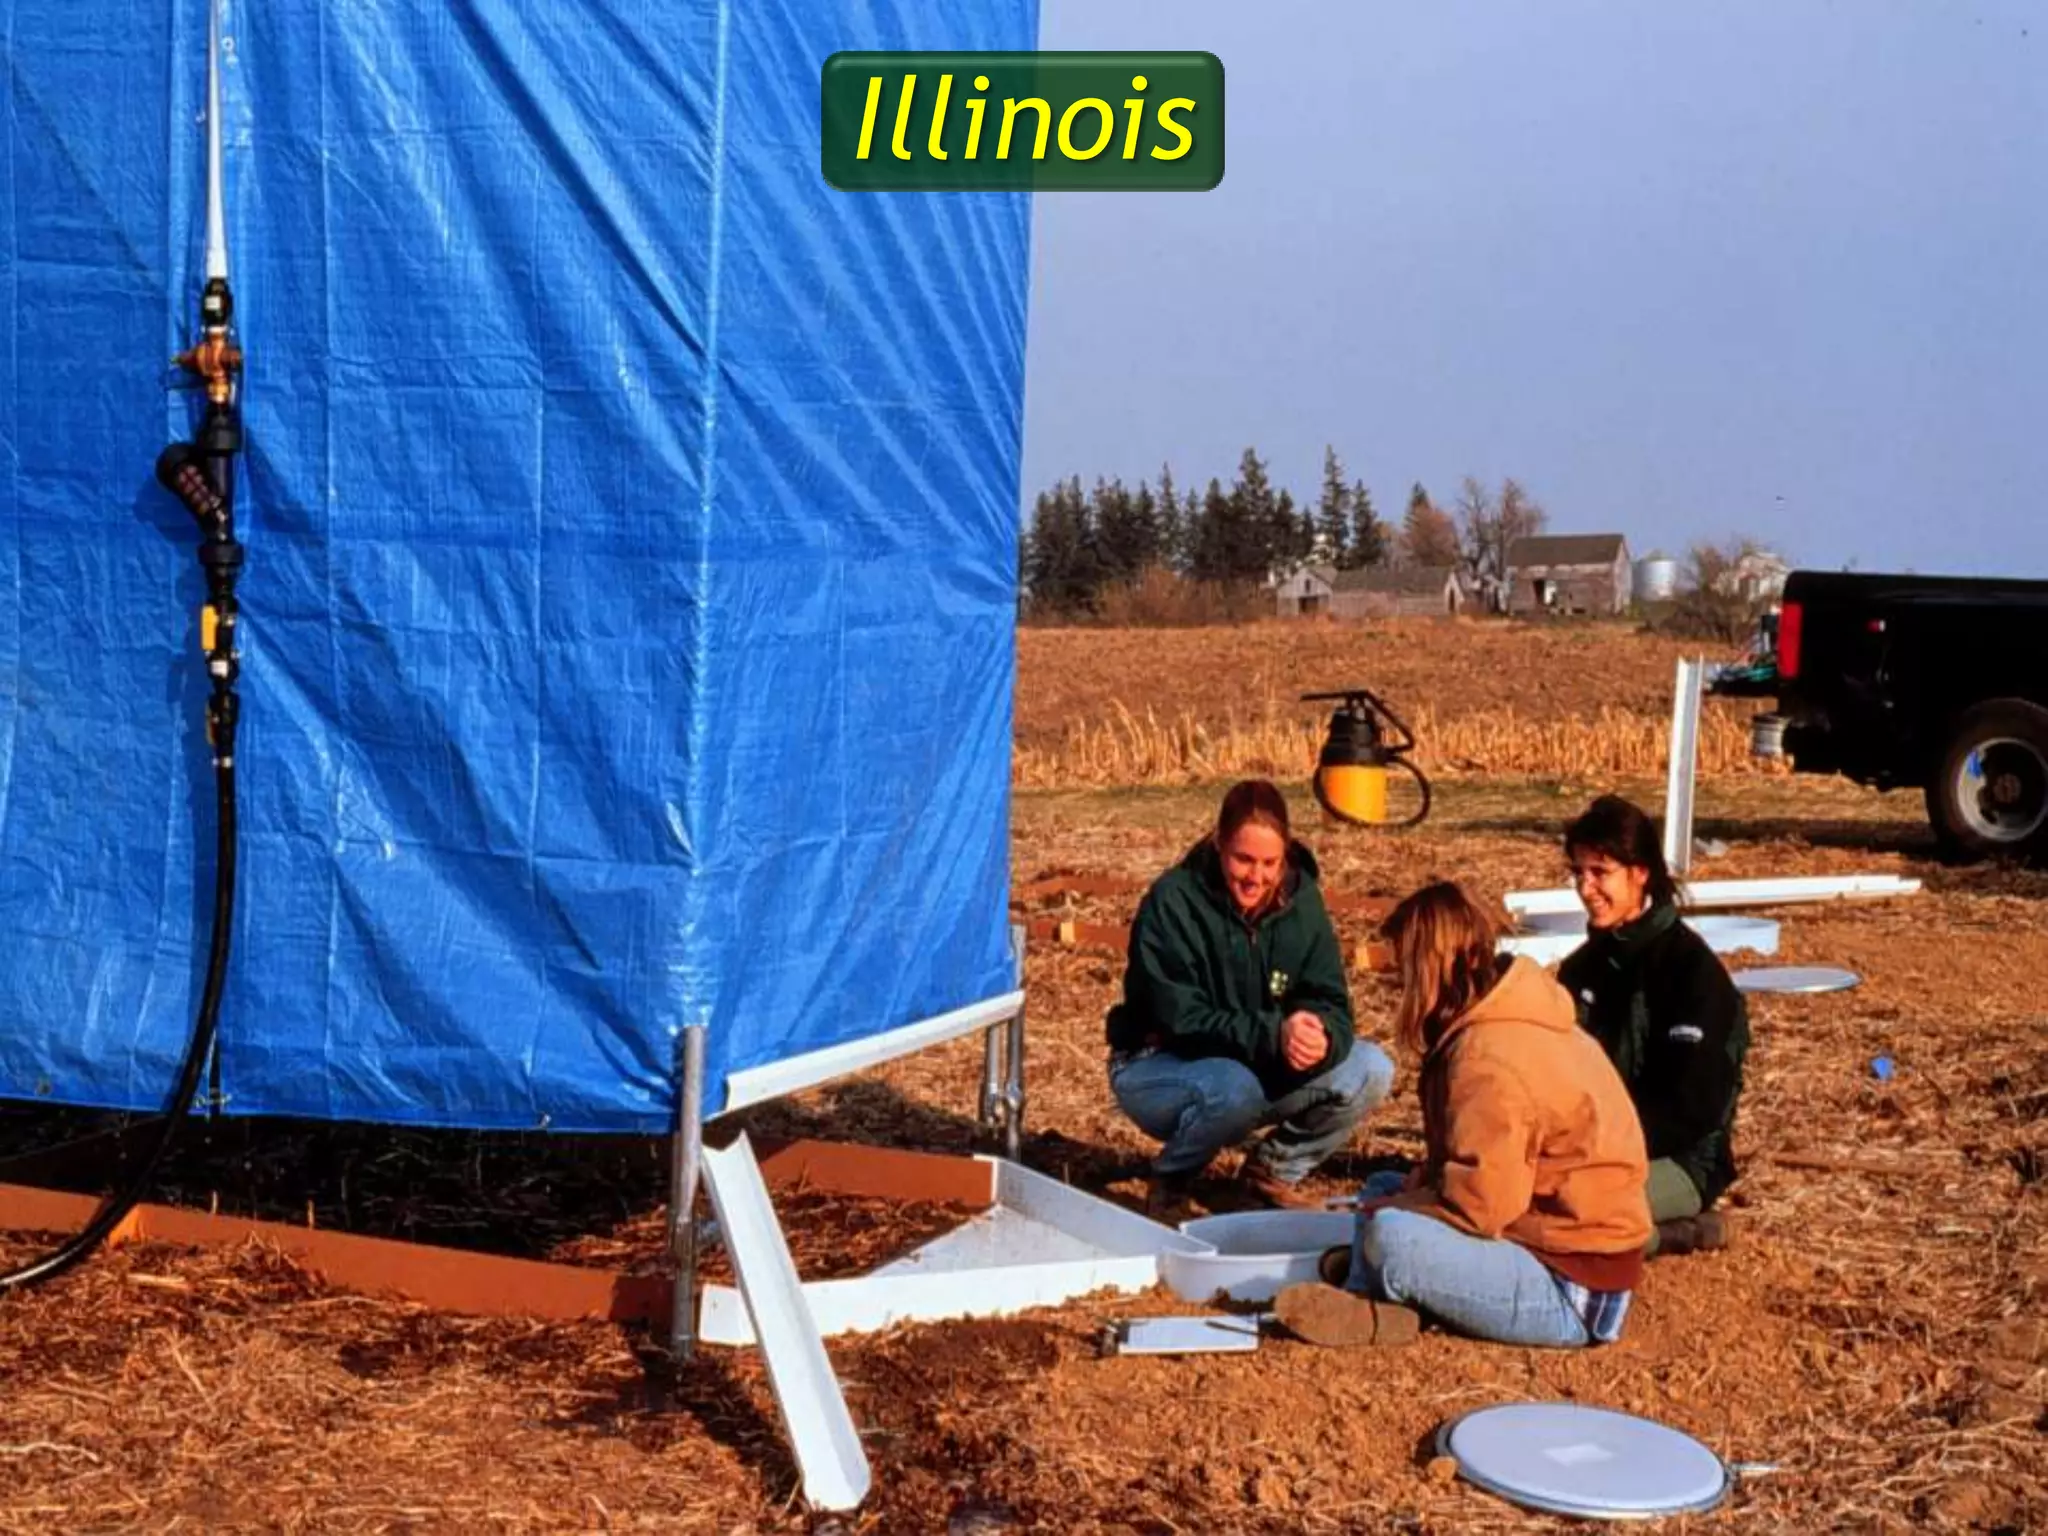
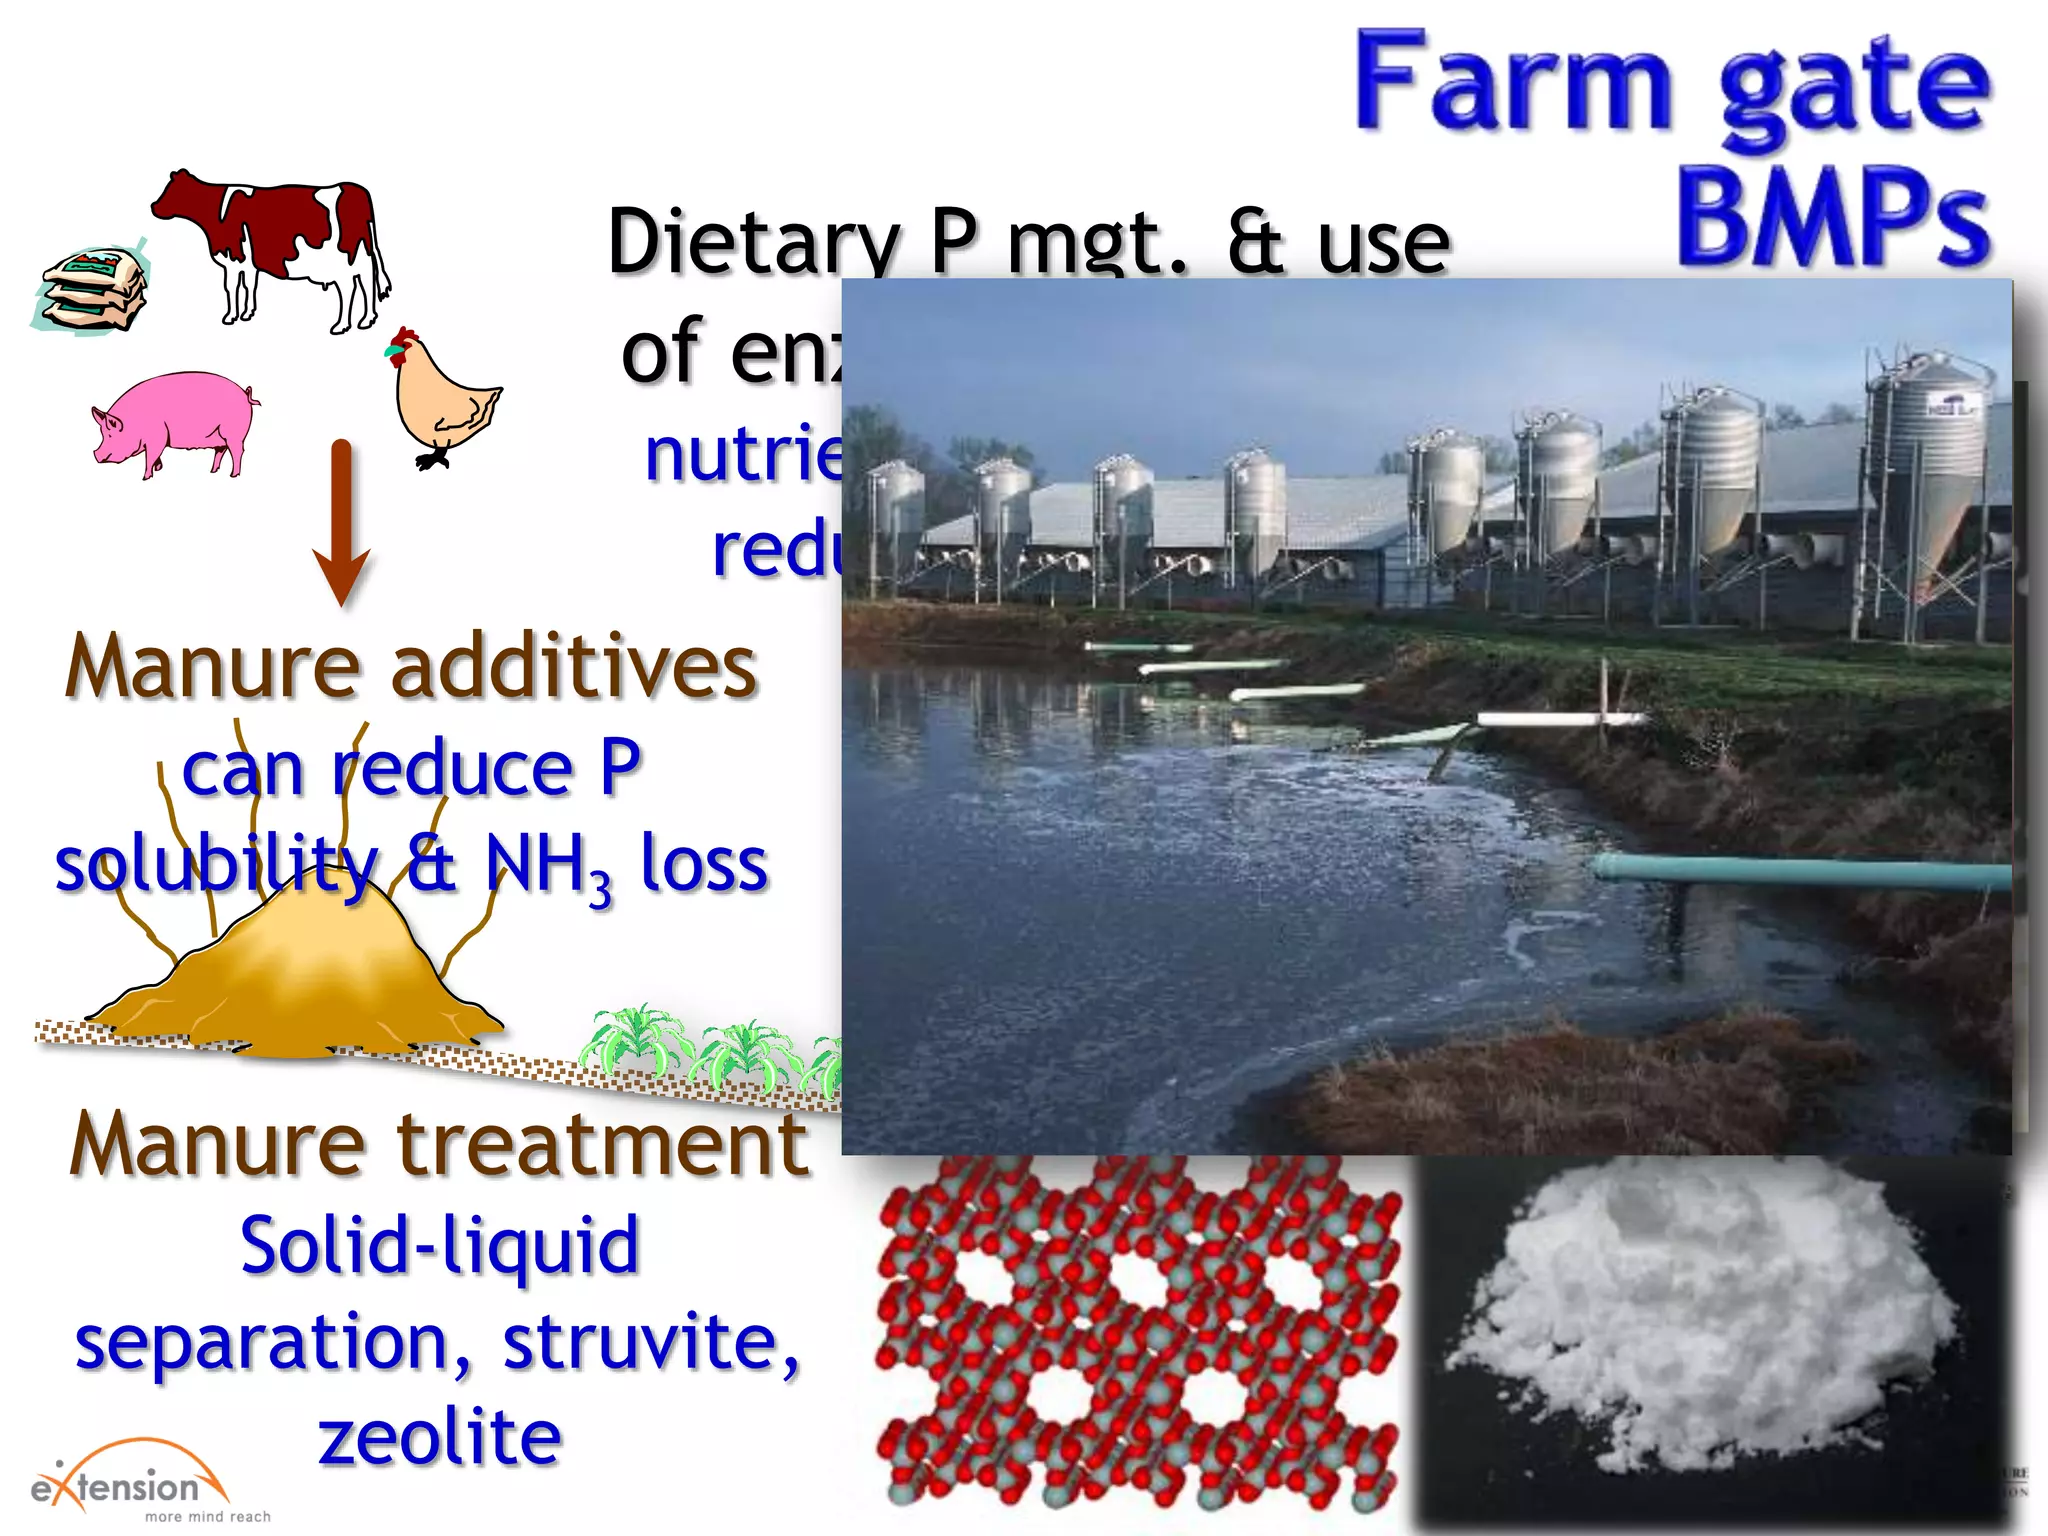
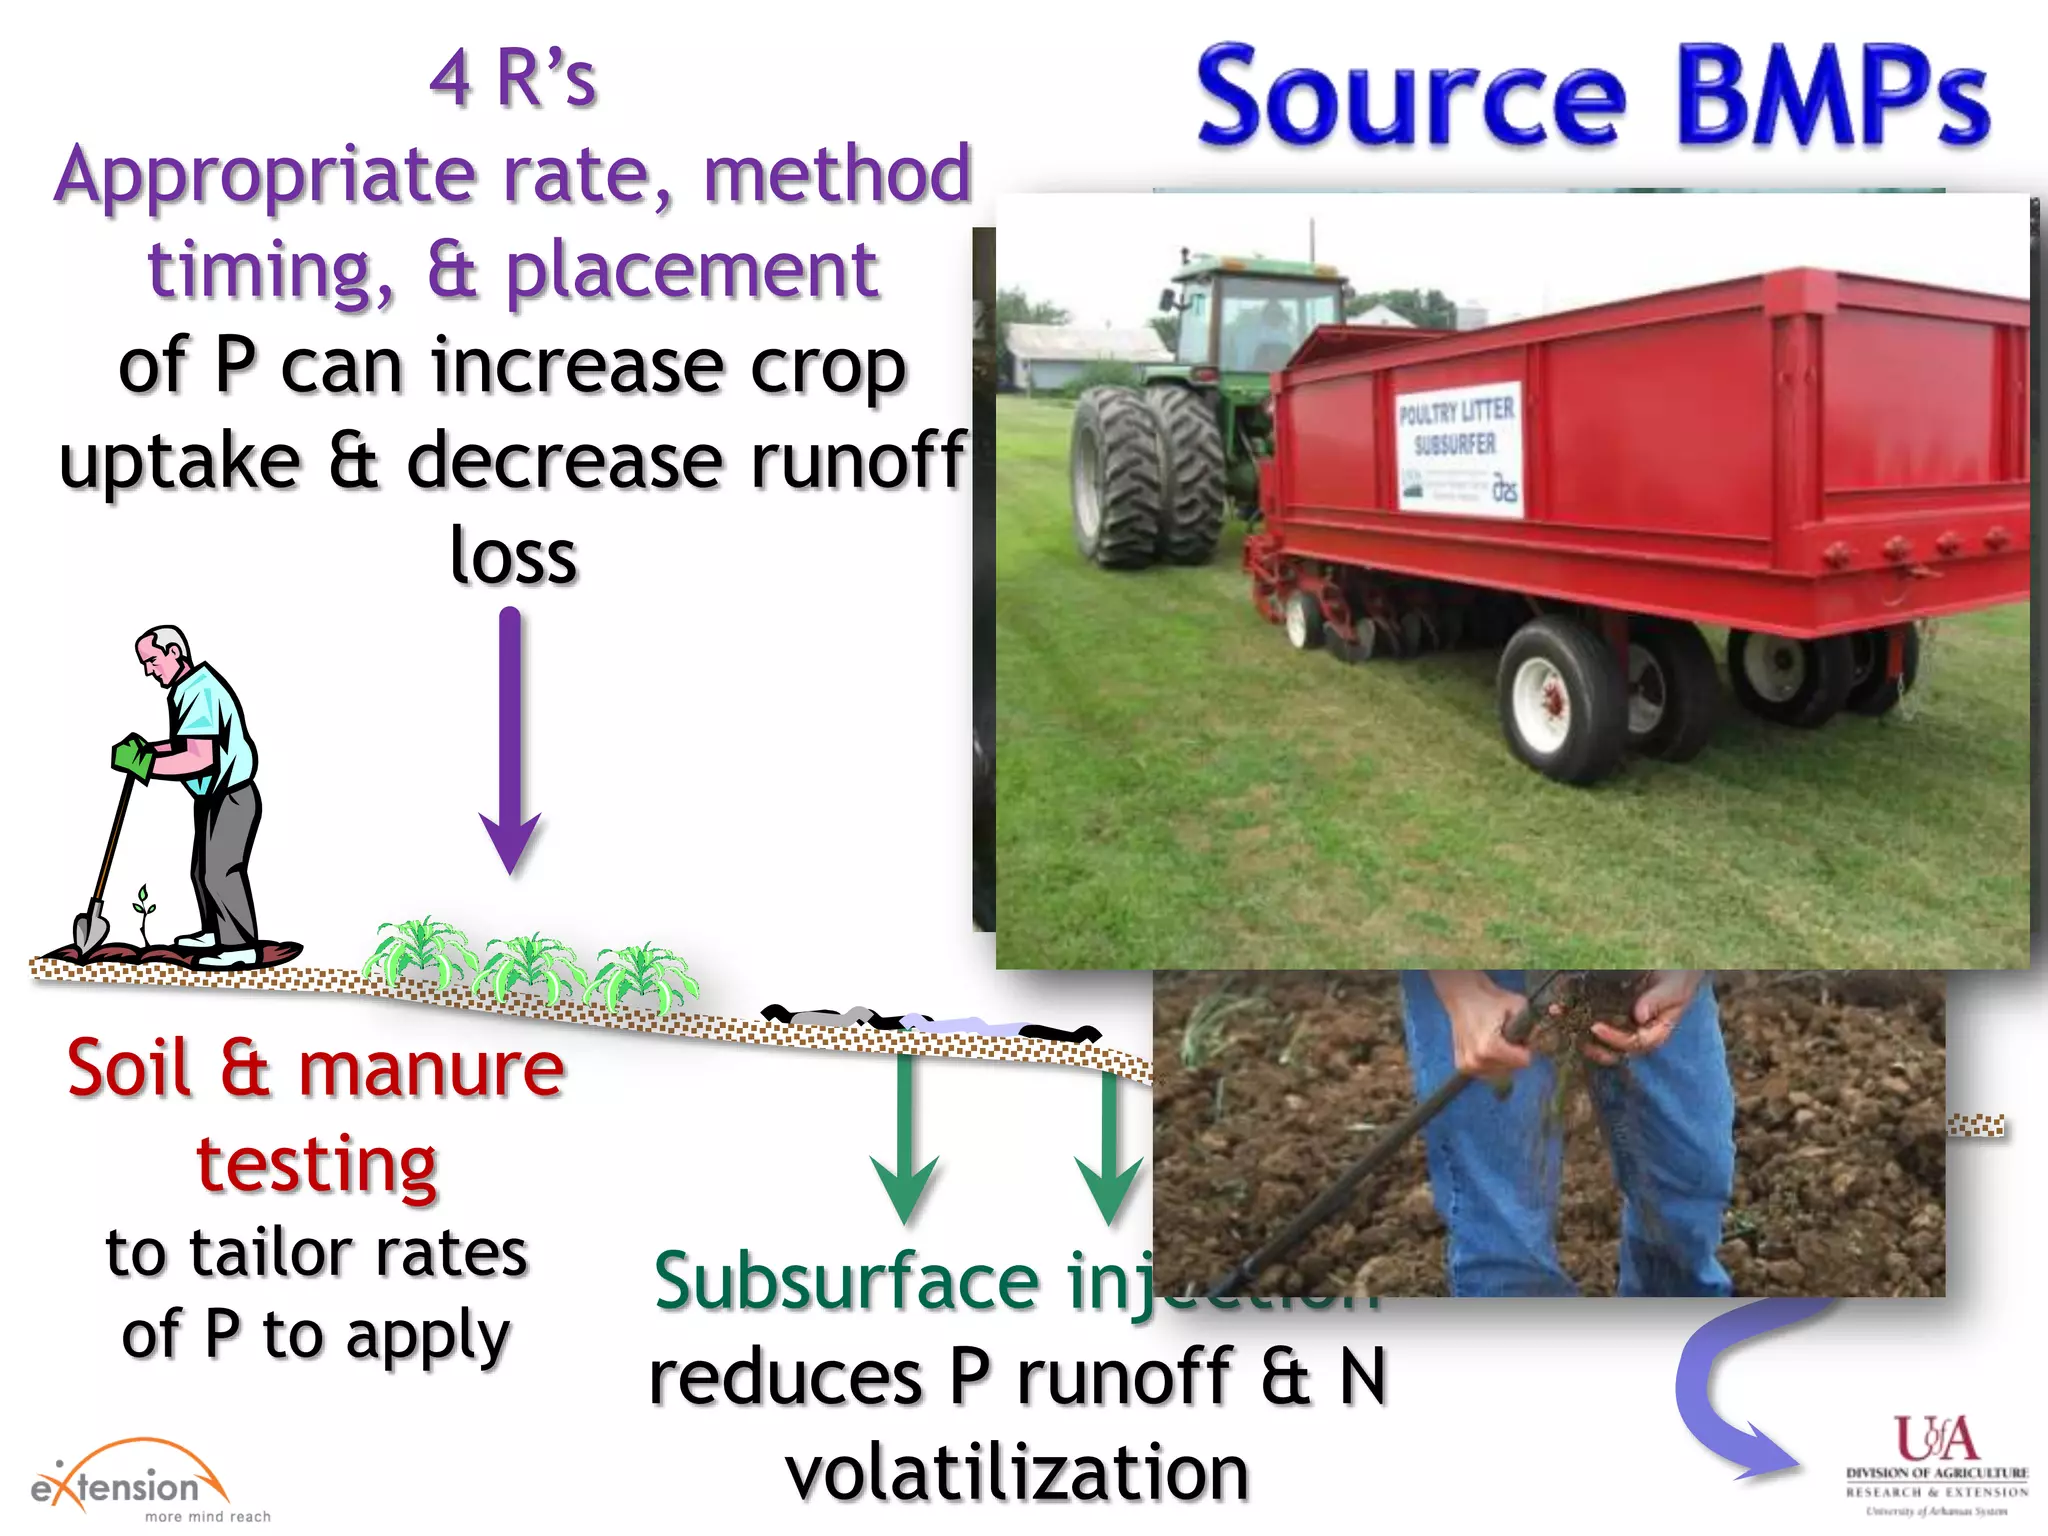
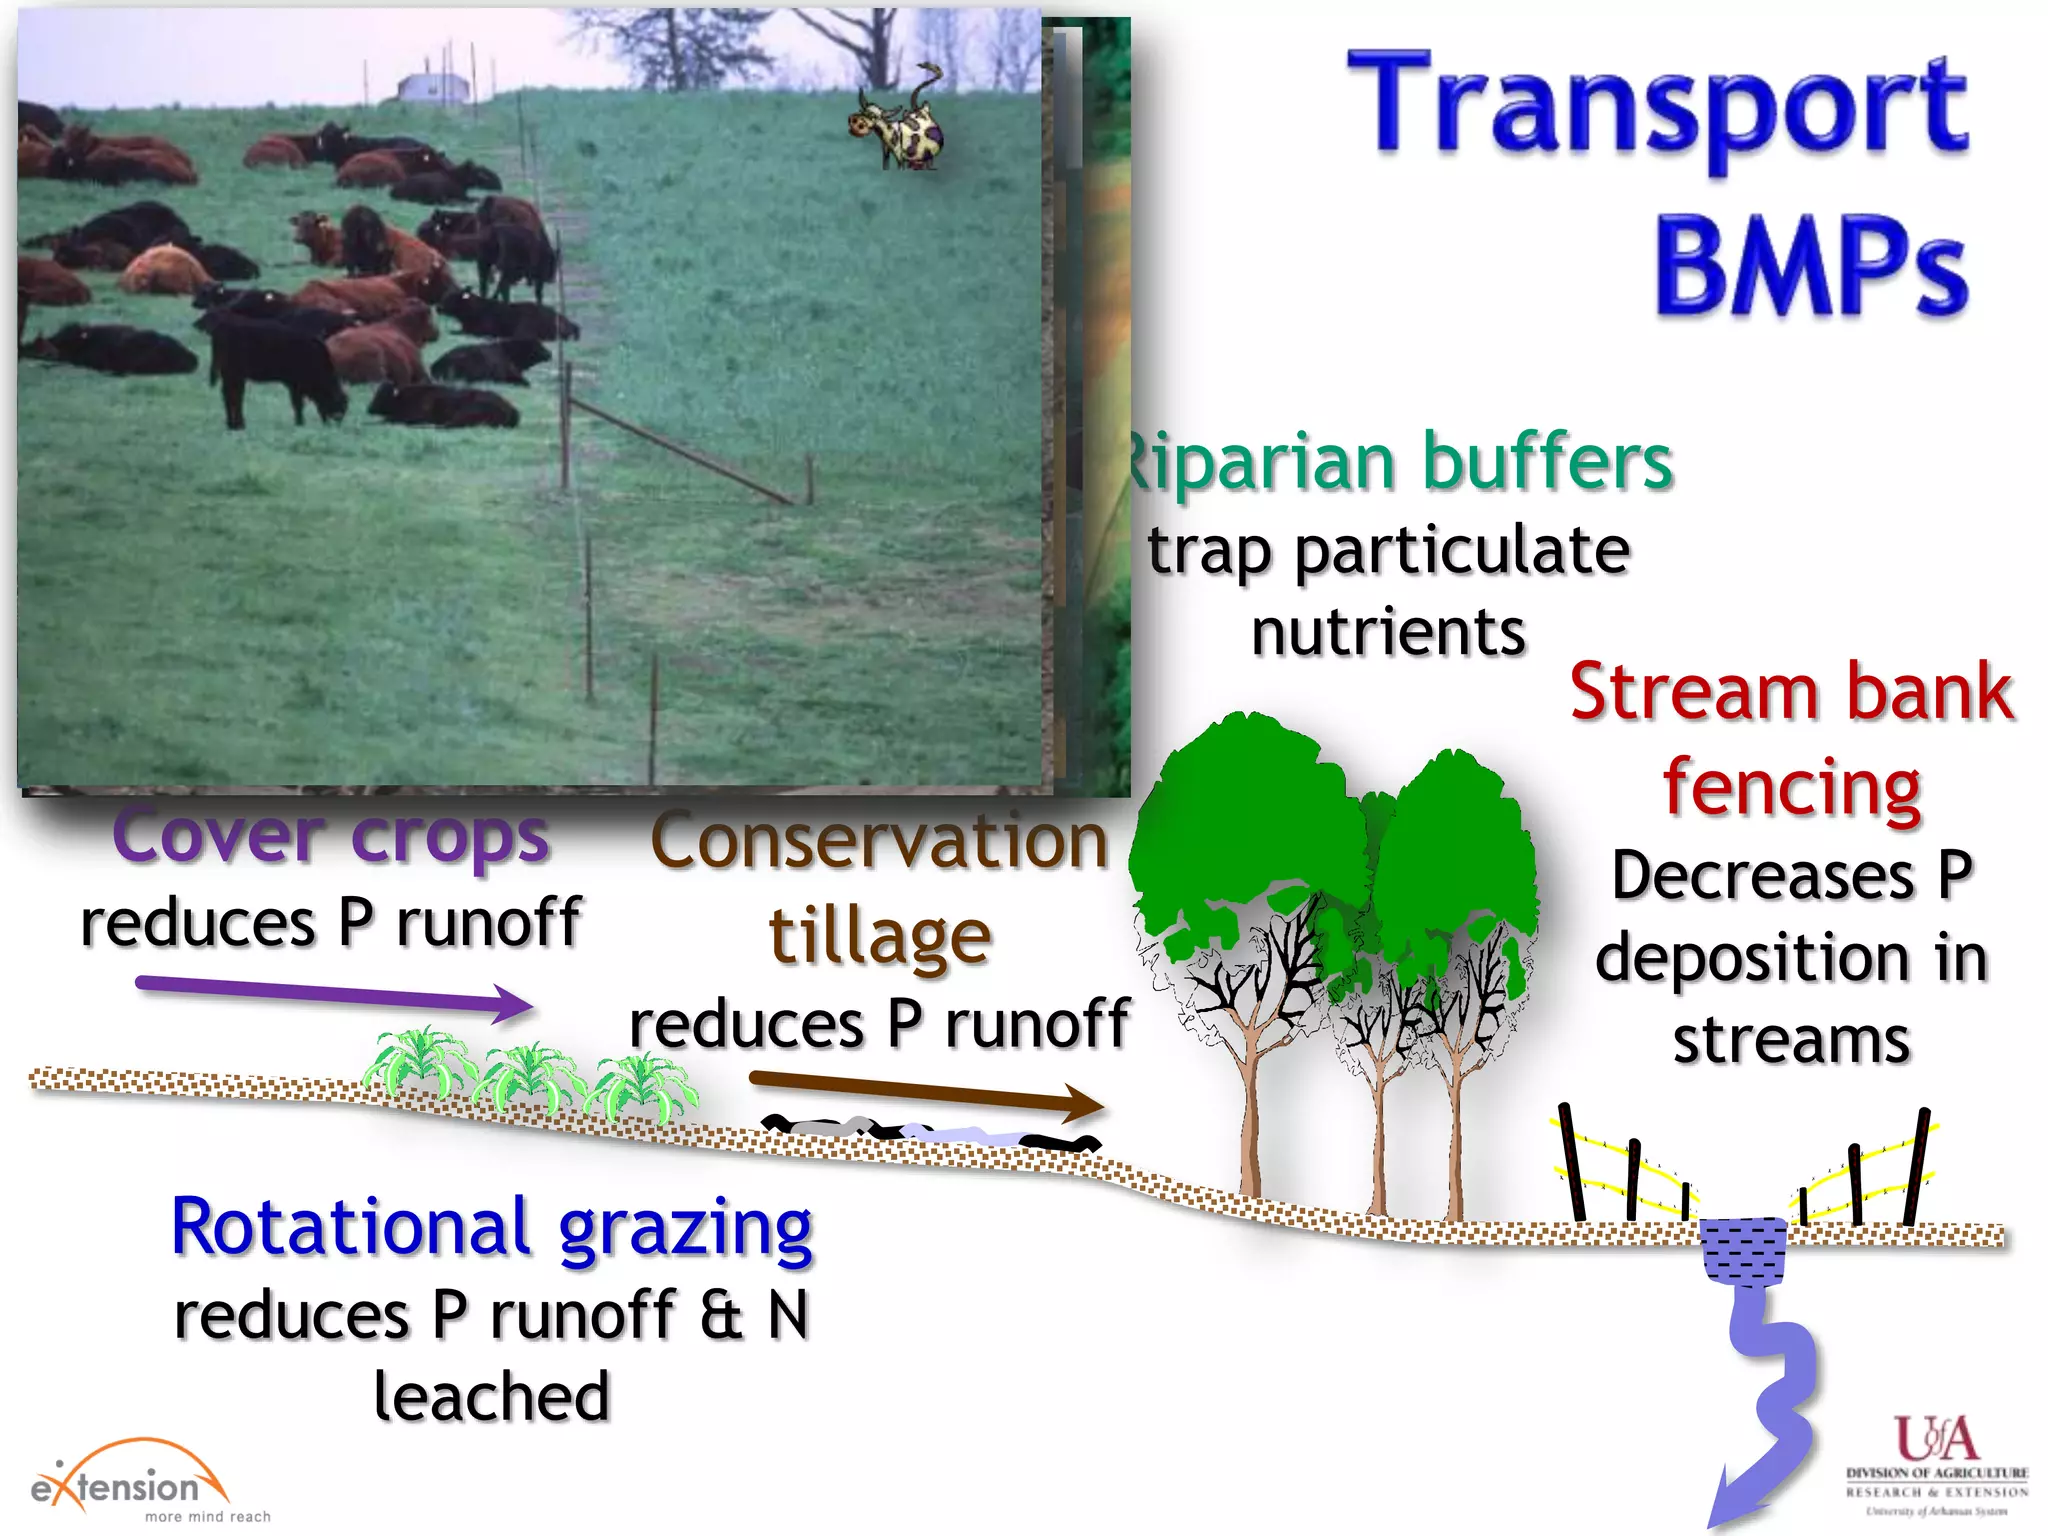
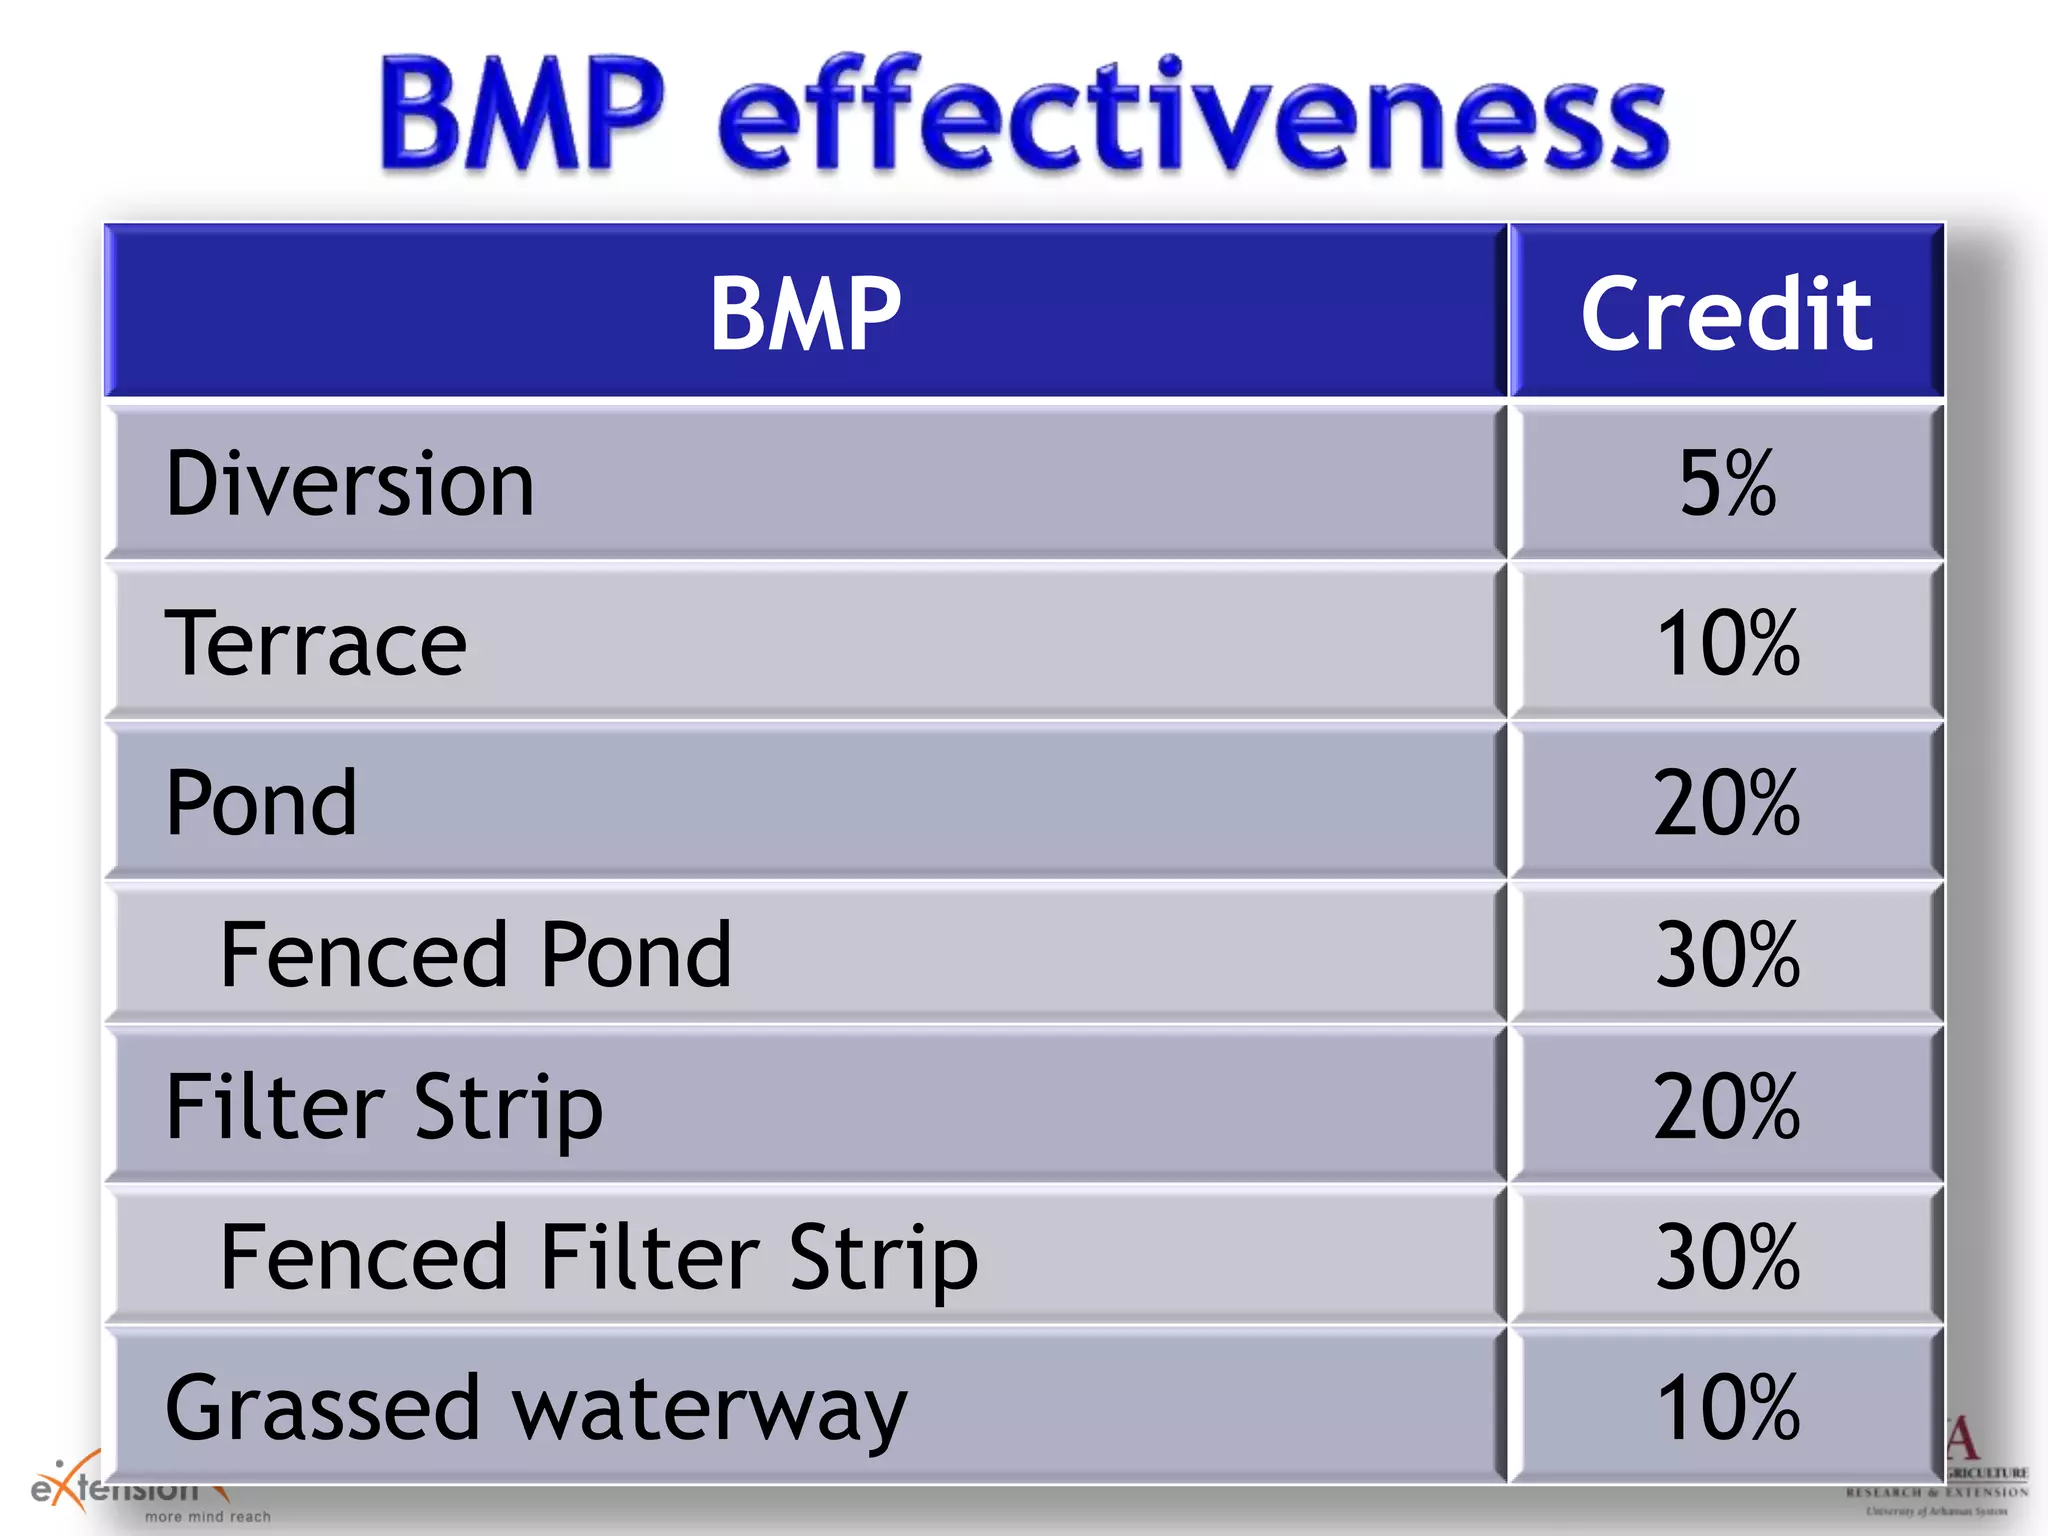
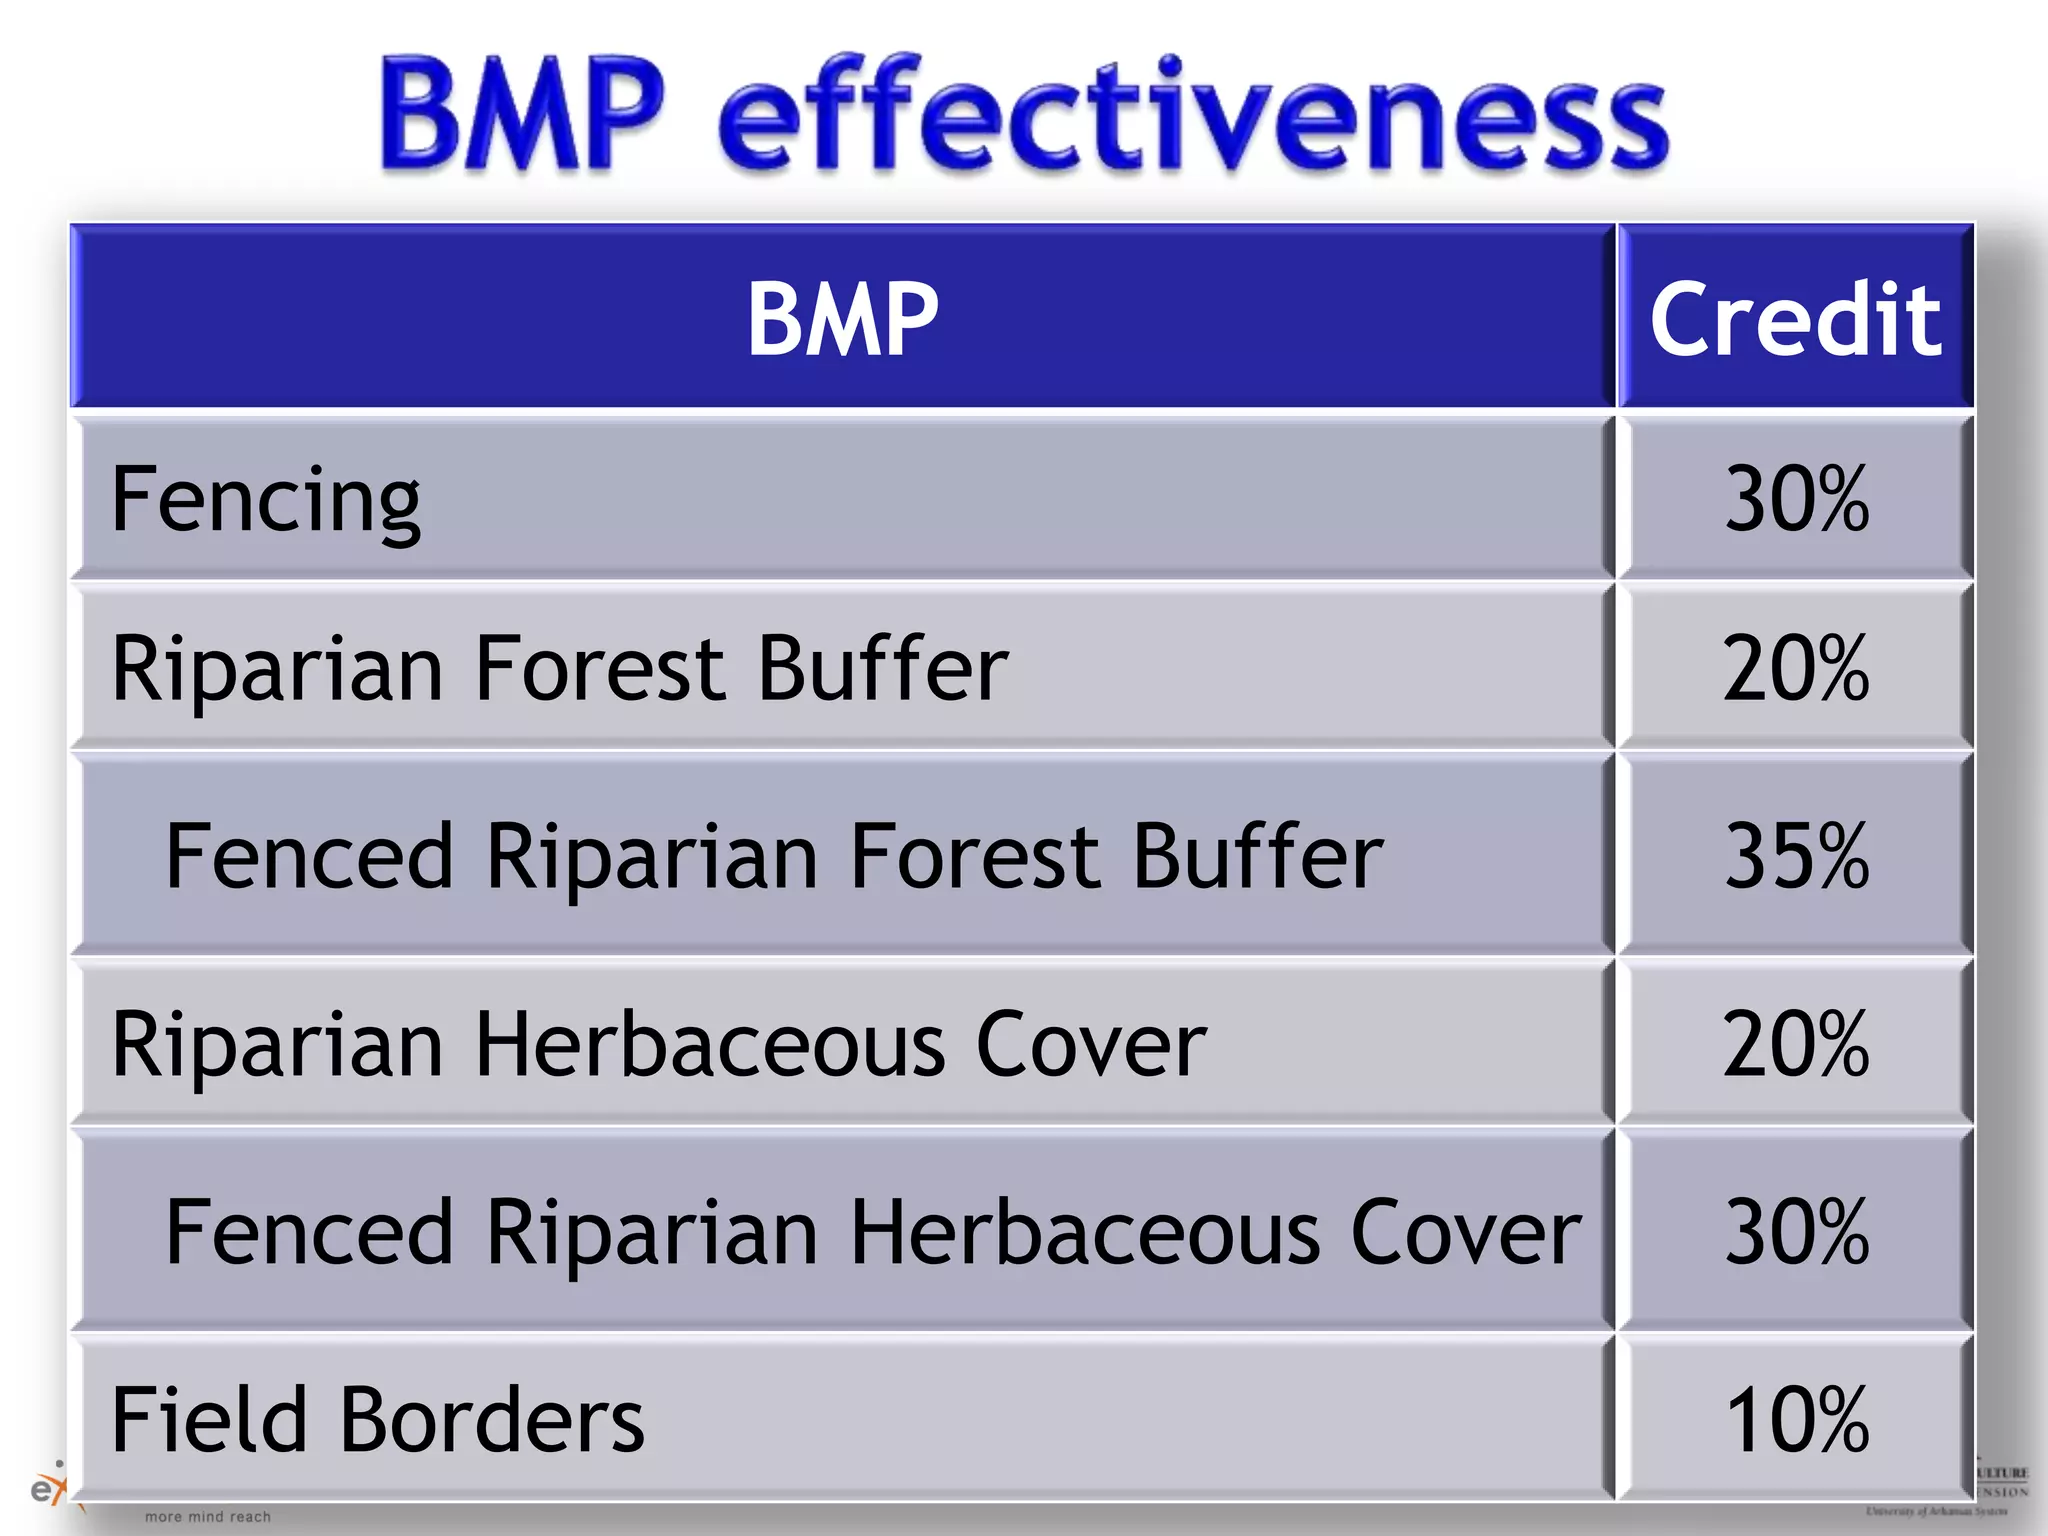
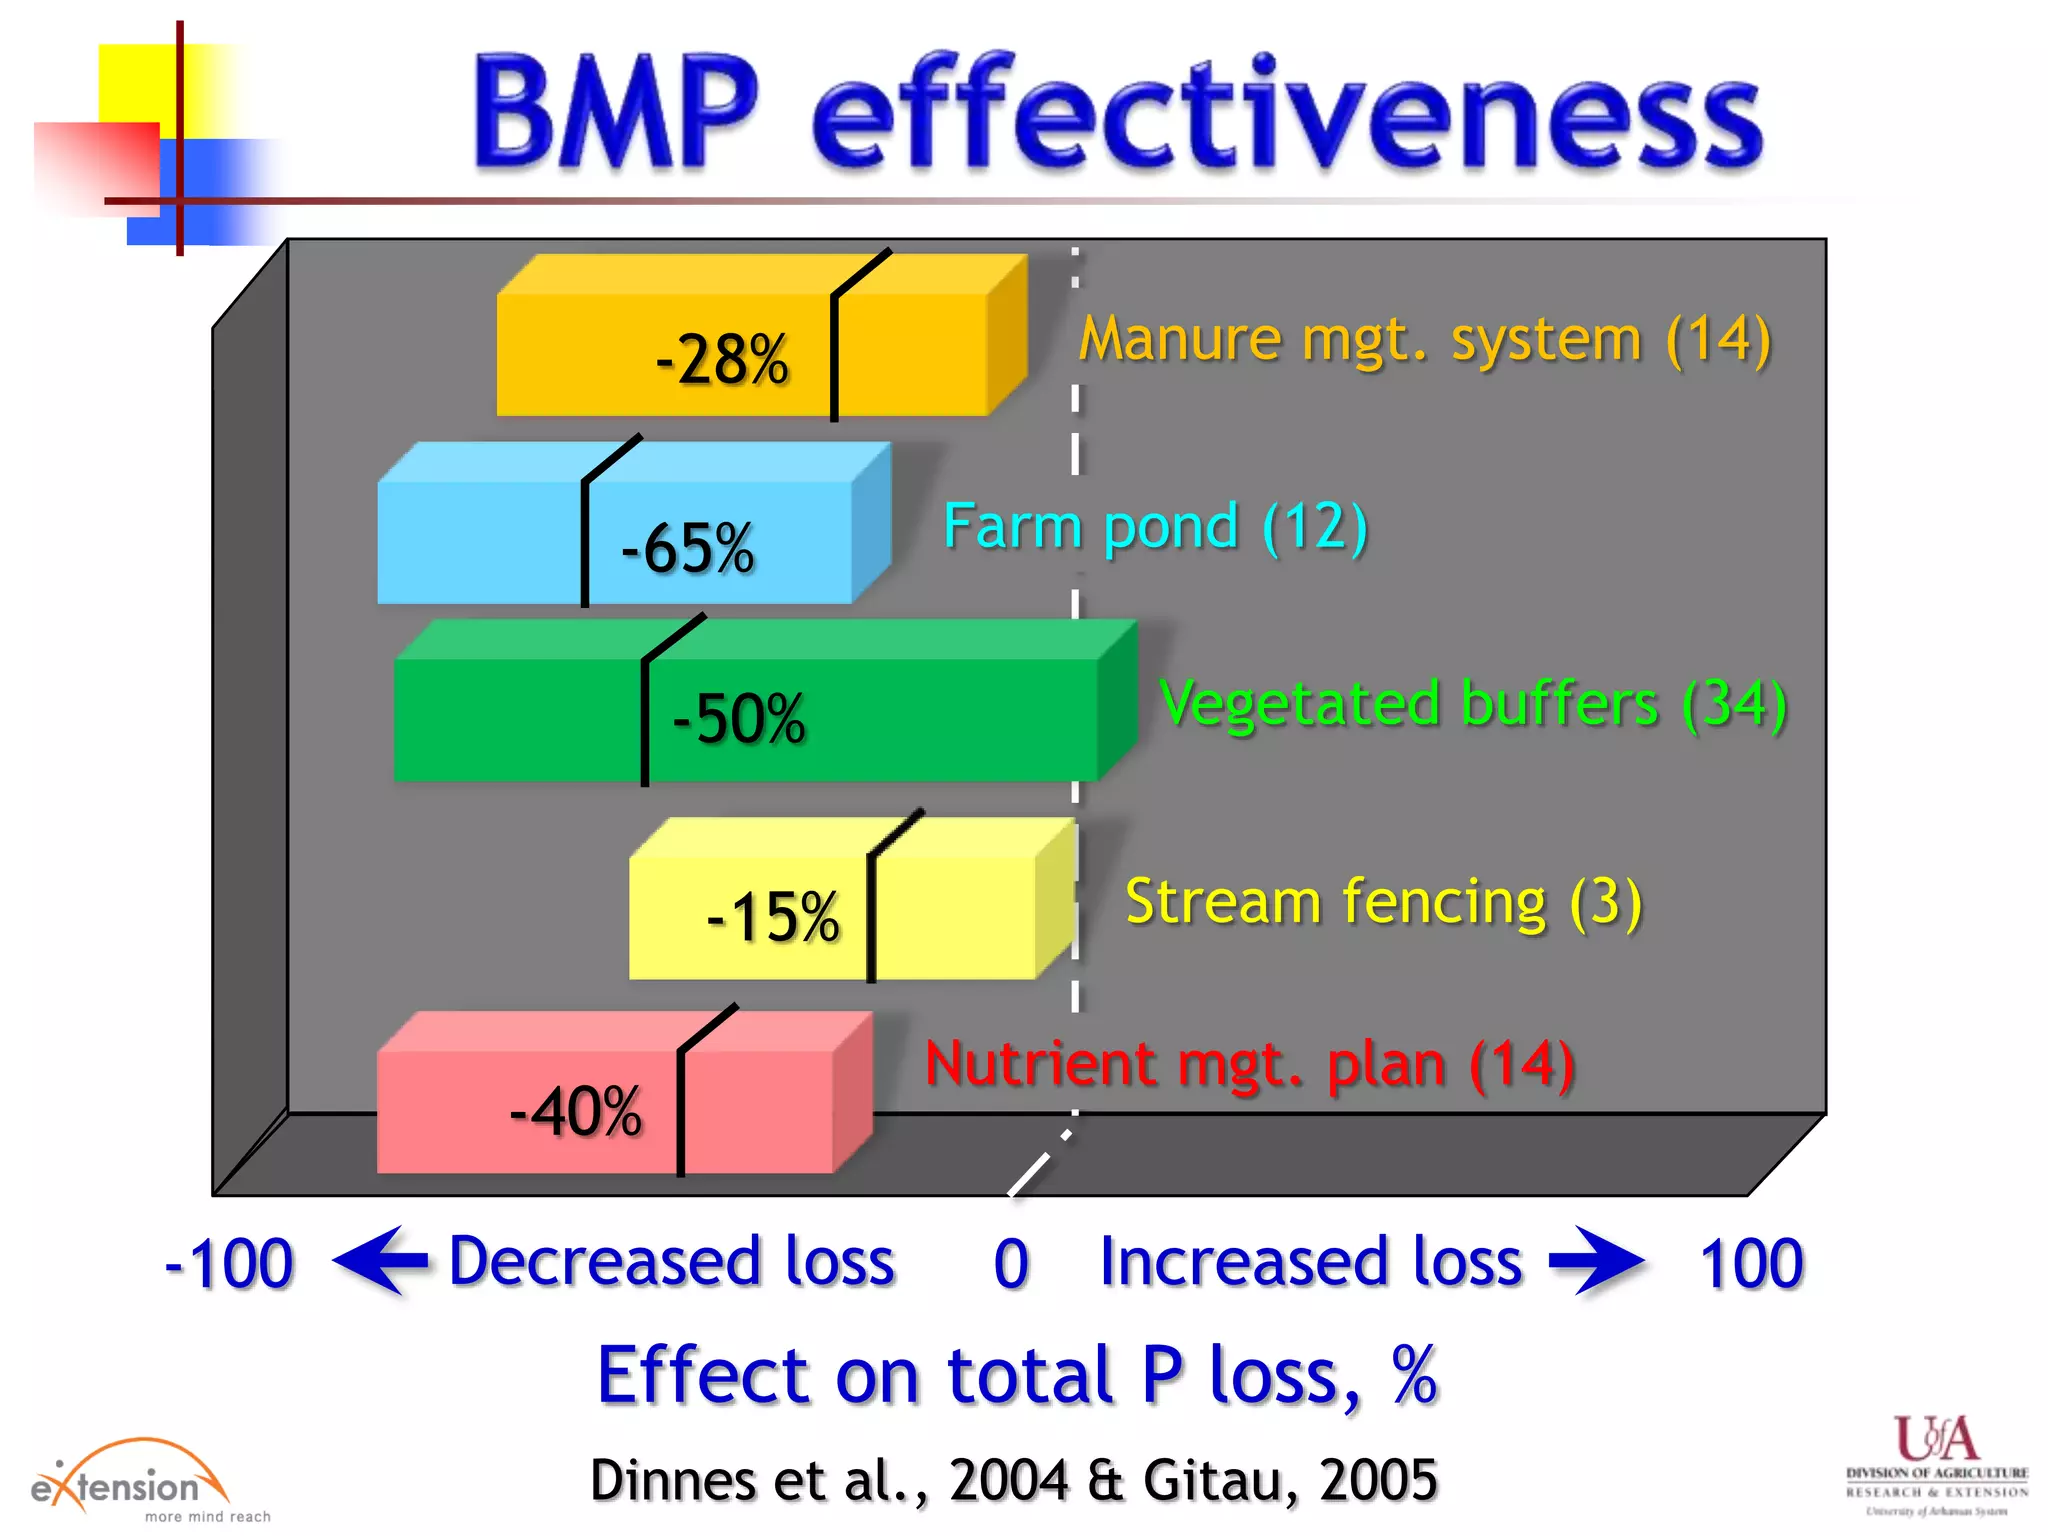
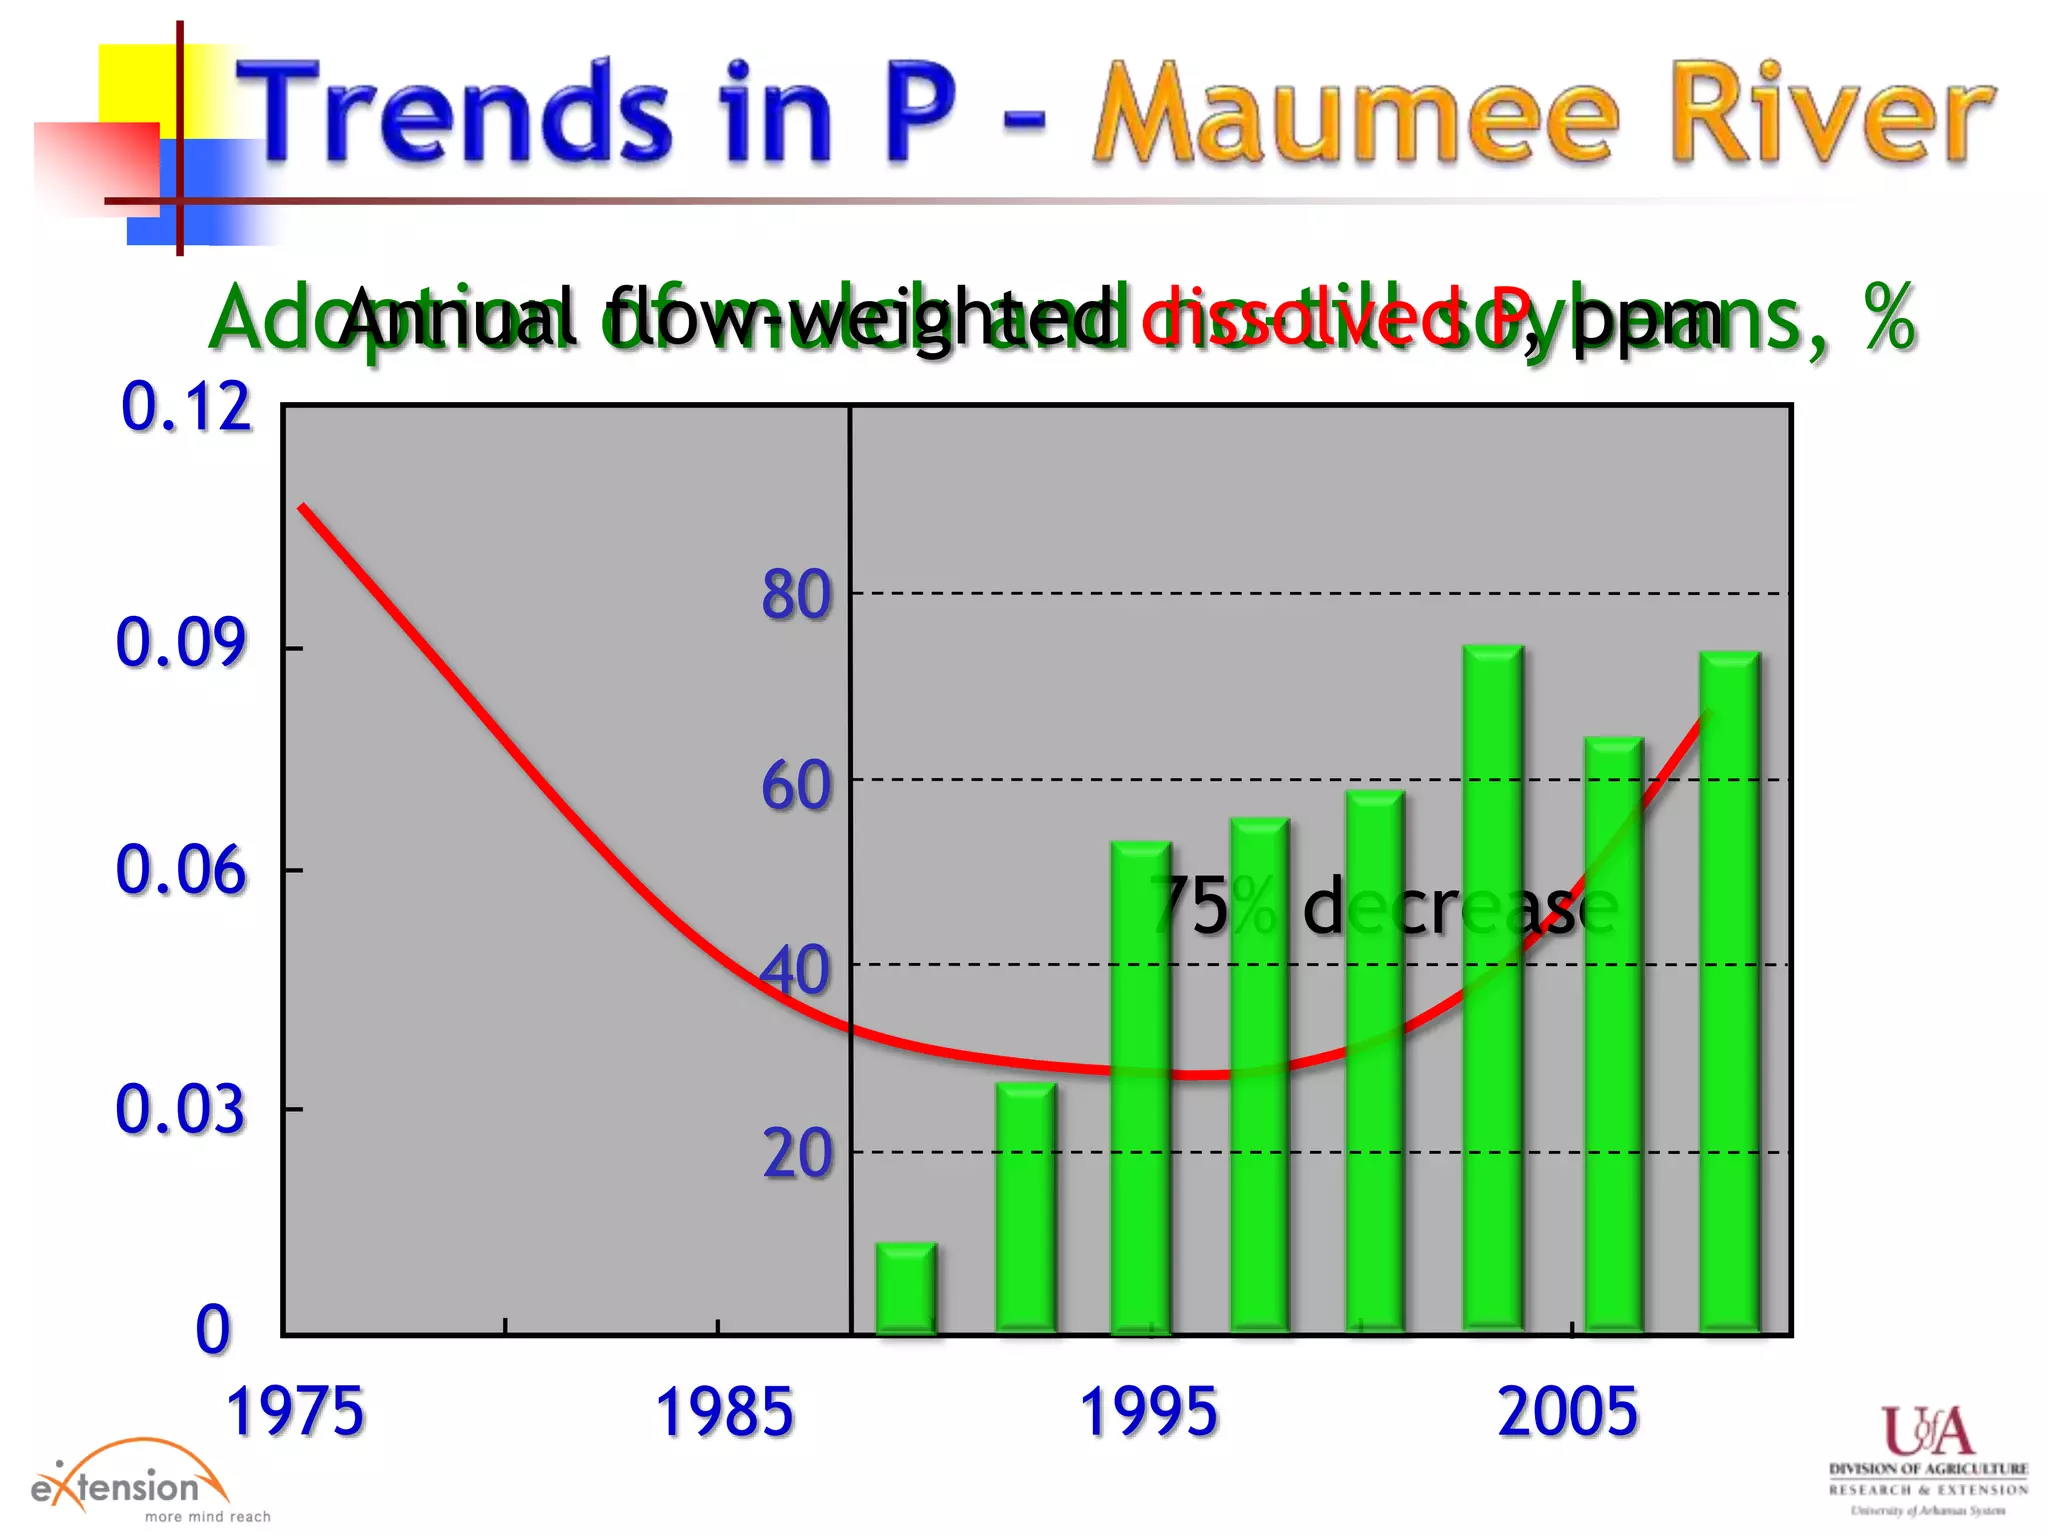
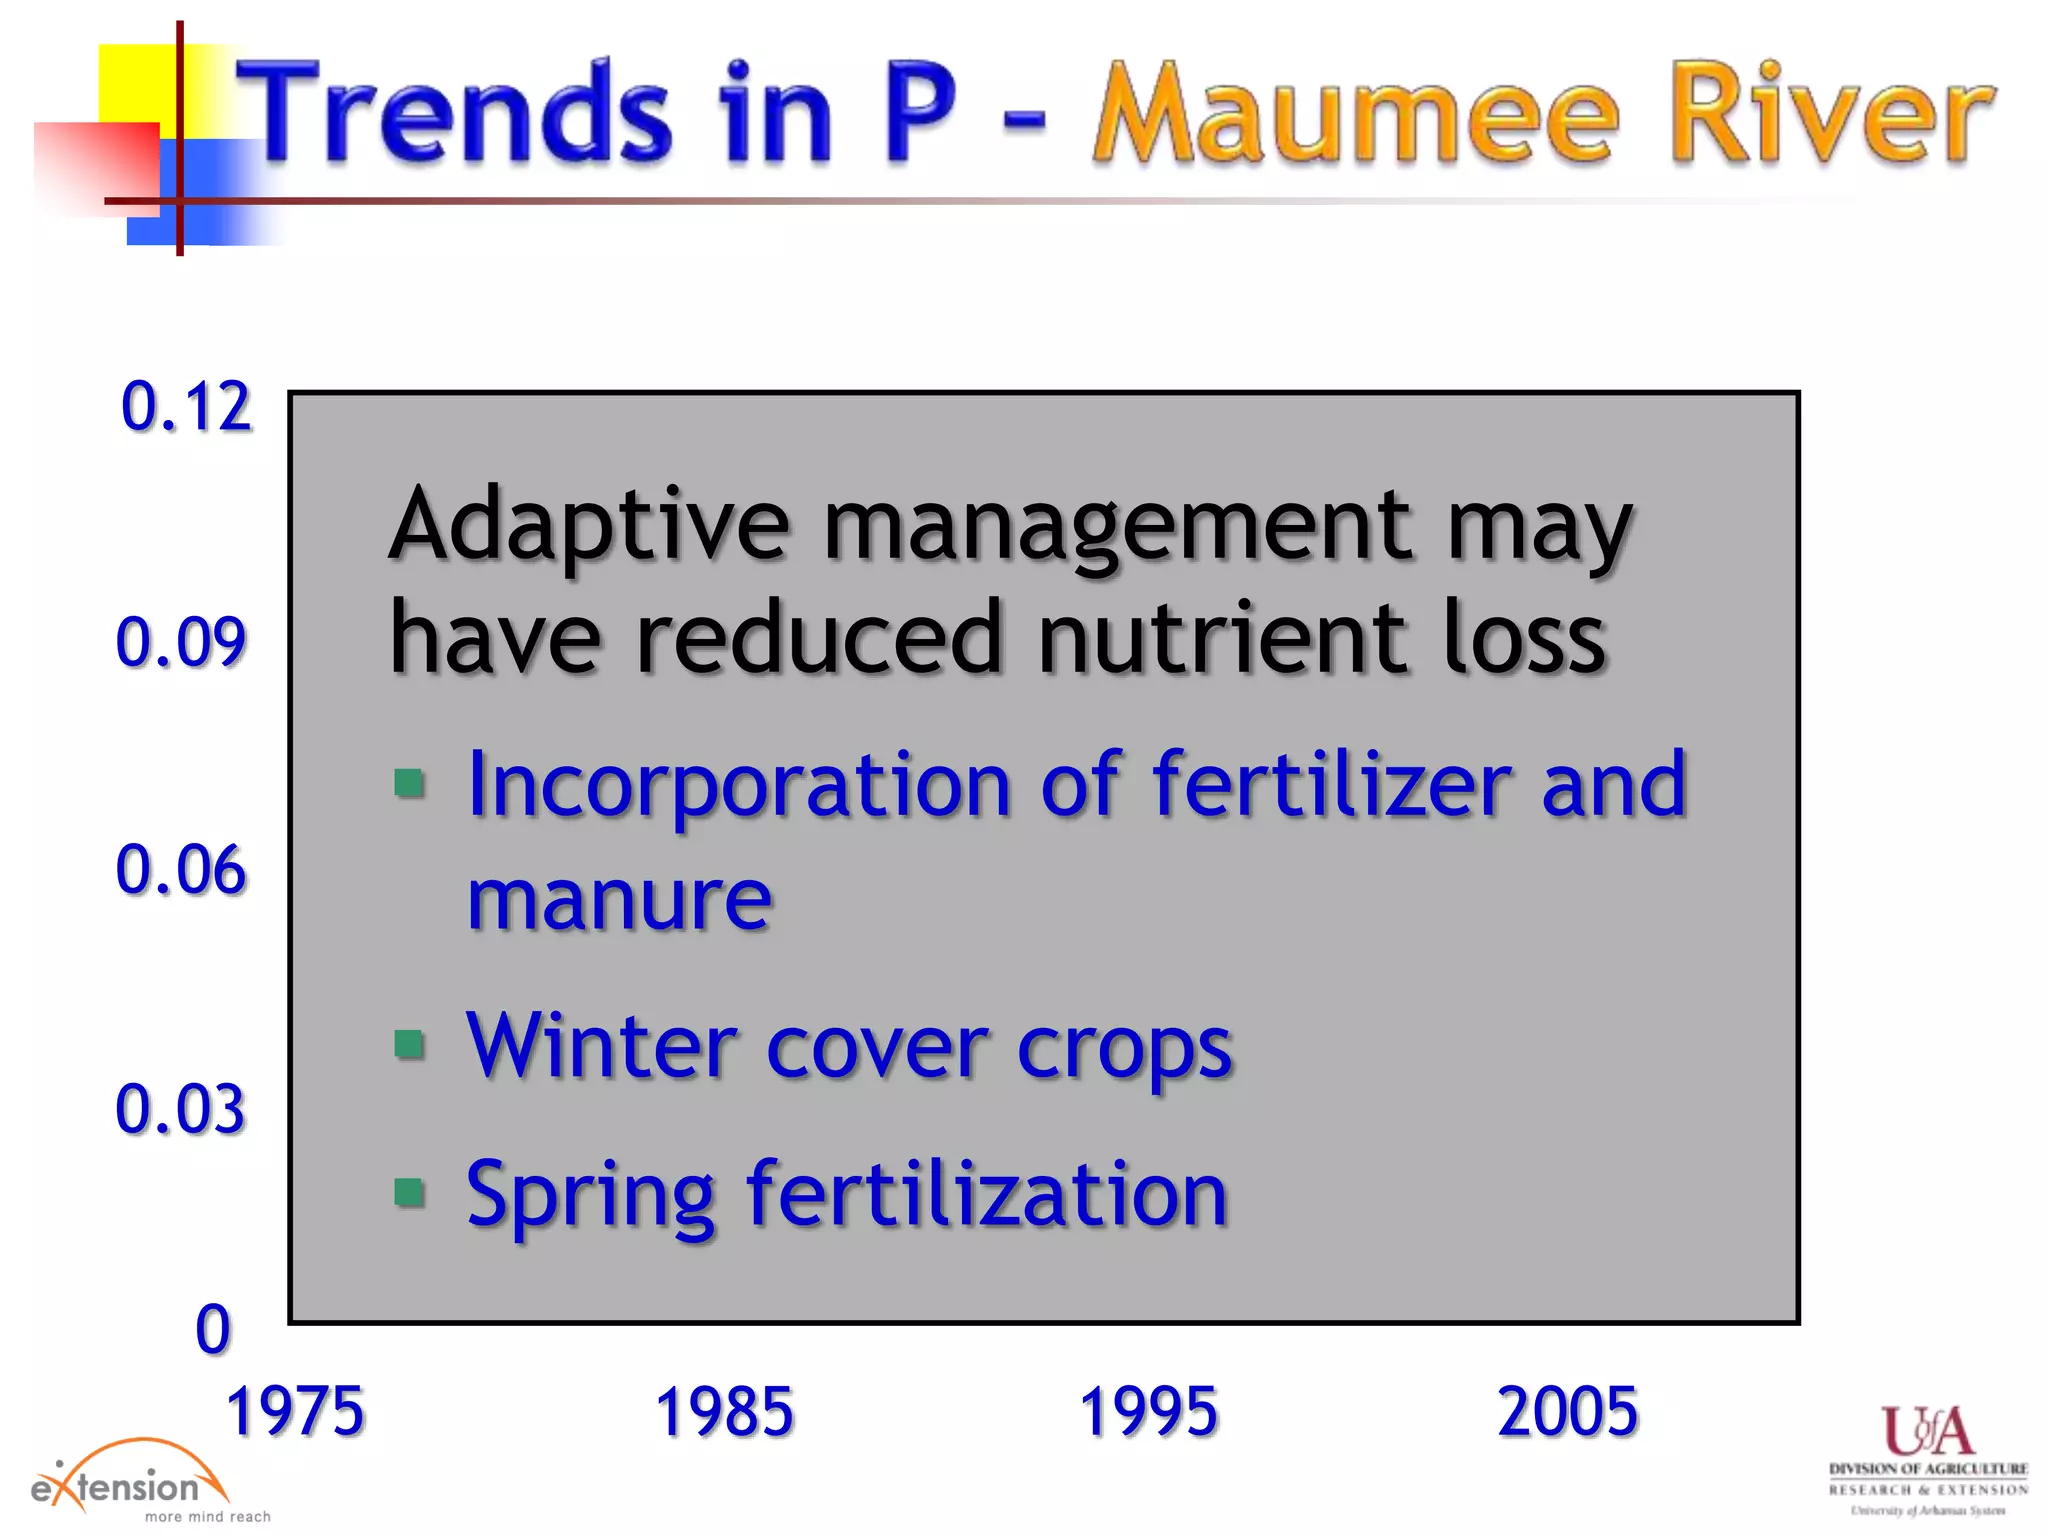
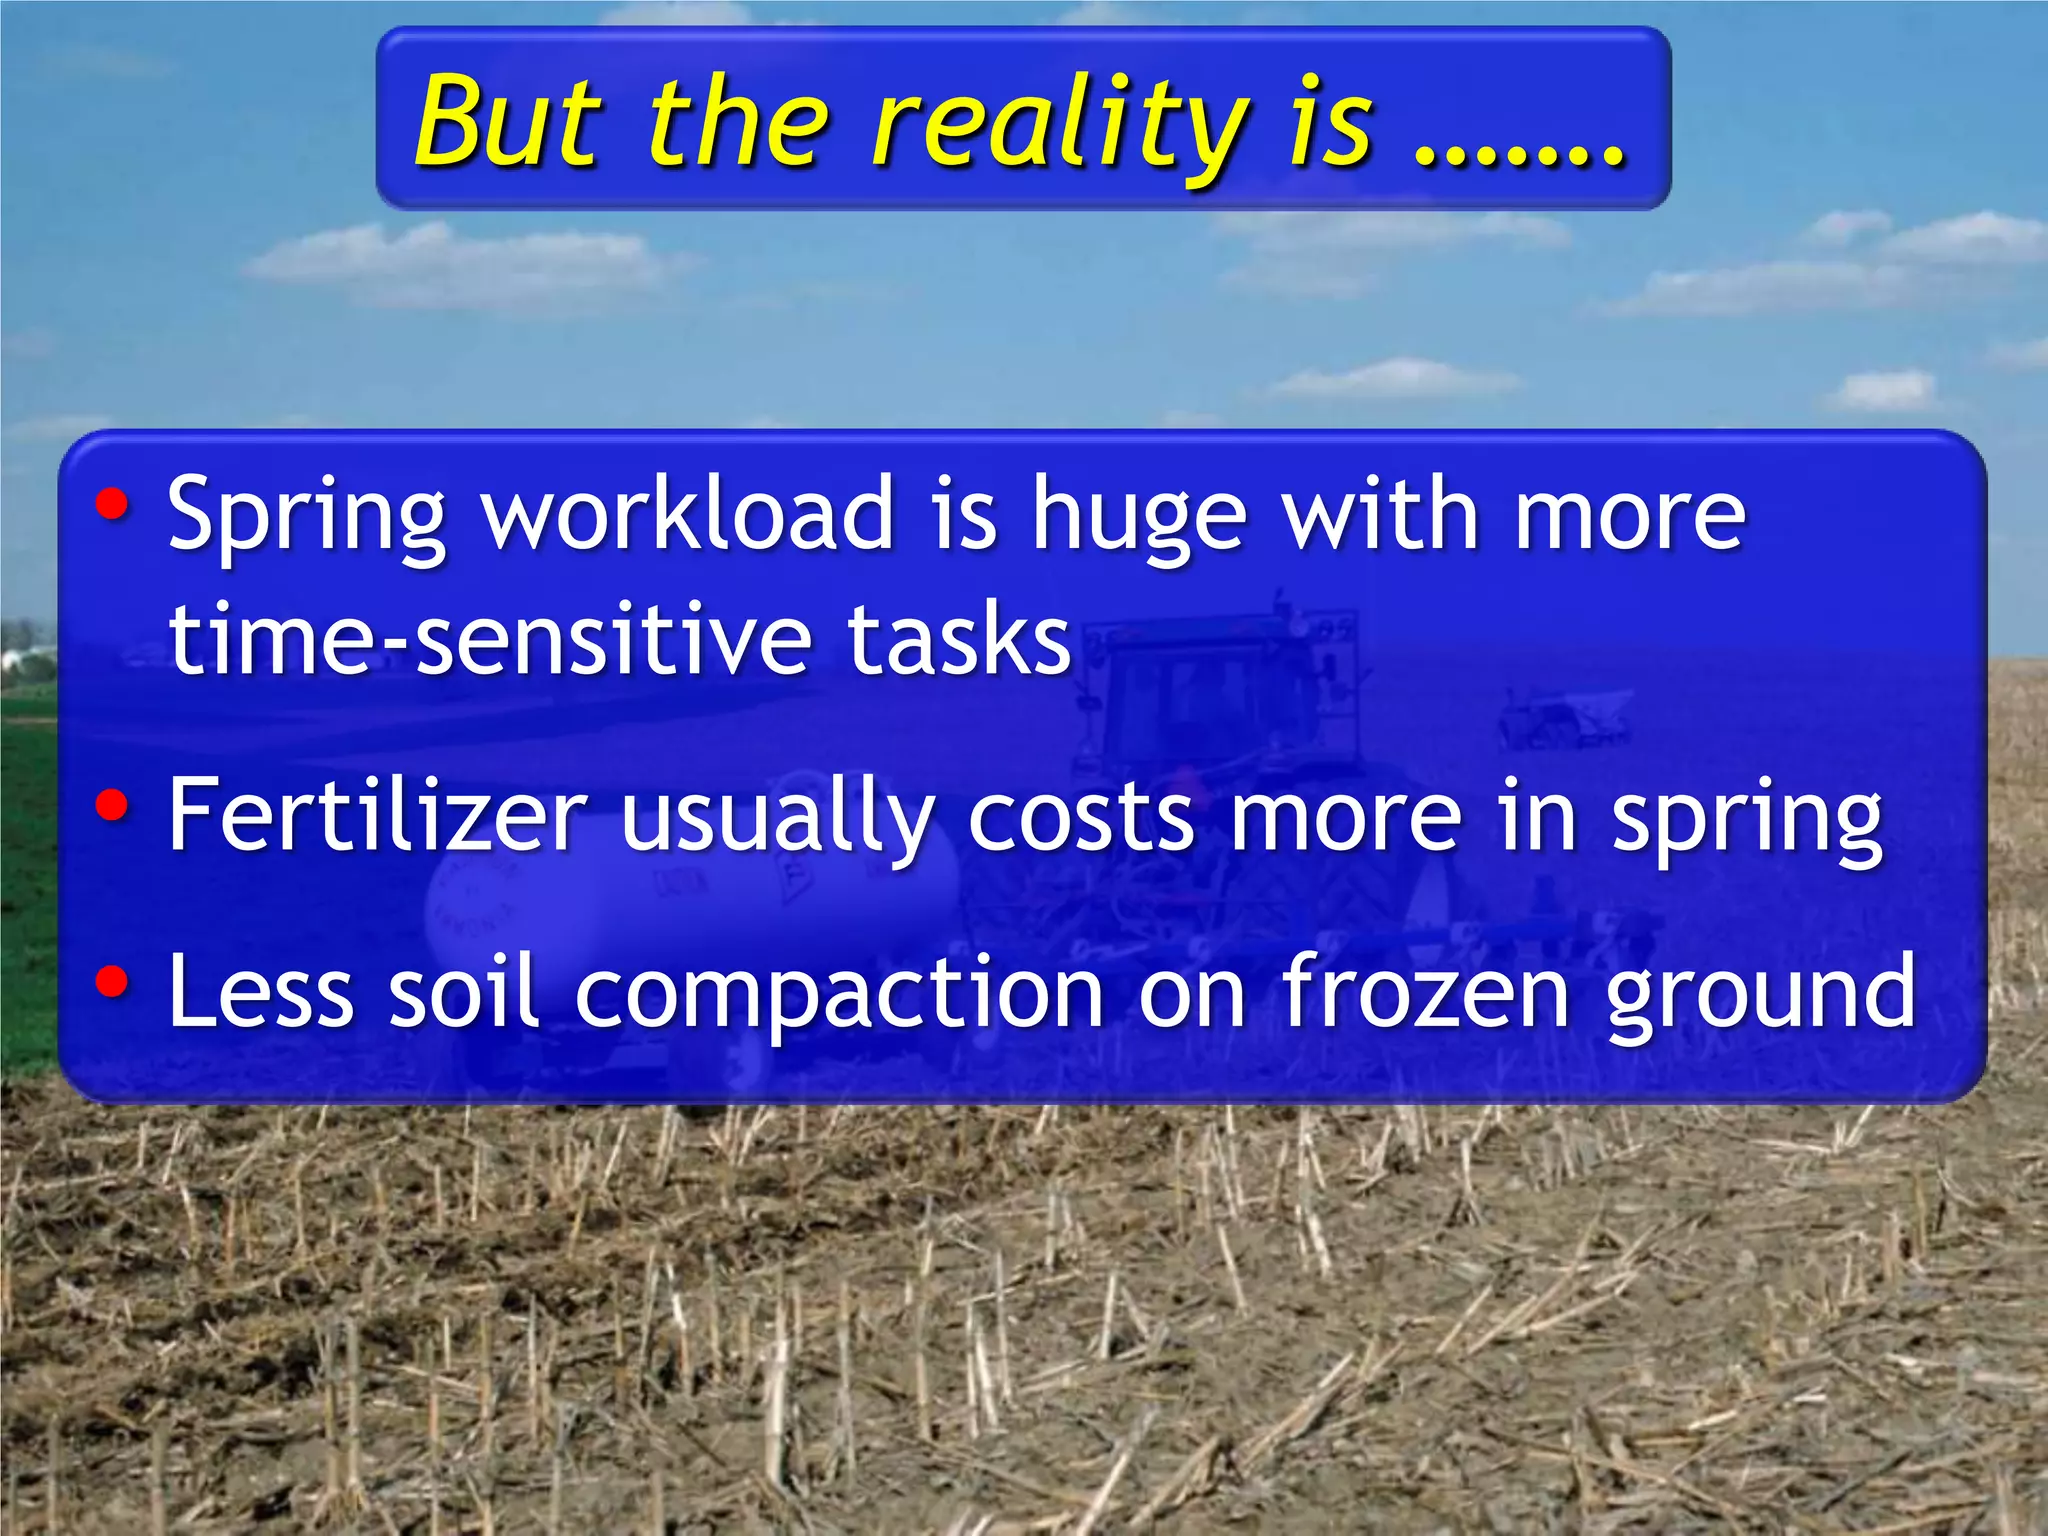
Tools for Phosphorus
Management
Andrew Sharpley
Water to Worth: Spreading Science and Solutions
Denver, CO; April 1 – 5, 2013
History risk assessment
Revision of the NRCS 590 Nutrient
Management Standard & P Indices
Its use & misuse for P management
BMPs and their assessment
The way forward
Today’s presentation
ARS
Land Grant
• National P Research Project outcomes
 Standardized methods for rainfall – runoff studies
 Established relationships between STP and runoff
 Integrated into P Indices
 Incorporated into NMP process
• Success partly due to
 Group effort – Land Grant & ARS
 Flexibility to adapt to State needs
..it was mobile
Arkansas
Illinois
Virginia
New York
Outreach
Dissolved P
mg L-1
Mehlich-3 P, mg kg-1
FD-36 watershed - PA
1
0
2
3
0 200 400 600 800
R2 = 0.86
Crop response
200 mg L-1
Change point
P loss affected by
many factors177
144
44
4620
1
<1
97
55
DP
8
DP78
92
0
Tony Buda, ARS, PA
Soil P – ppm
P added – kg P/ha/yr
Runoff – liters
P loss – kg P/ha/yr
High
source
High
transport
Critical Source Area
Led to the 80/20 rule:
80% of P comes from
20% of land area
Risk assessment used by most states for
nutrient management planning (CPS 590)
• Runoff potential
• Erosion potential
• Leaching potential
• Proximity to stream
TransportSource
• Soil P content
• Added P
• Rate, method, timing
of fertilizer & manure
• Manure P solubility
1
0
2
3
P index value for the site
0 50 100 150 200
R2=0.80
75 kg P/ha TSP
112 kg P/ha
poultry litter
150 kg P/ha
poultry manure
Runoff P,
g/ha
Very highHighMedLow
Soil P, mg/kg








P loss is controlled by many factors
• Disparity among Indices across the country
 Varied with soils, topography, & state priorities
• Often, not leading to a decline in STP nor
improvement in water quality
 Legacy effects
• Perceived as farmer friendly
• The P Index was never meant to be the
solution to P management issues
P loss
kg ha-1
AL AR GA MS NC TN TX
0.5 Low Low Low Low Low High Med.
2.7 Med. High High Low Low V. High High
4.0 Low High Med. Low Low V. high High
5.8 Low V. high V. high Low Med. V. high High
10.9 Low V. high V. high Low Med. V. high High
23.7 Low V. high V. high Low High V. high High
Osmond et al., 2012
• Appropriately account for major sources
& processes determining P loss & rank risk
of loss for any given site
• Directionally and magnitudinally correct
• Interpretations based on assigned risk are
equivalent across state borders, given
similar site & water resource conditions
• Where inadequacies exist, the causes can
be identified & addressed
•At a minimum this should include
 Site runoff, management, climate,
water quality
 Event, planning / rotation period &
annual loss
 Natural rainfall
• Network of sites and data exchange
being developed – Kleinman et al.
• MANAGE – Daren Harmel
•Select appropriate model
 APEX, APLE, DrainMod
 Locally calibrated (within state)
 Event, planning / rotation period &
annual loss
• Model & Index must estimate P loss &
simulate P mobilization & transport
over same time scales
Dietary P mgt. & use
of enzymes enhances
nutrient absorption &
reduces excretion
Manure additives
can reduce P
solubility & NH3 loss
Manure treatment
Solid-liquid
separation, struvite,
zeolite
Struvite
Subsurface injection
reduces P runoff & N
volatilization
Soil & manure
testing
to tailor rates
of P to apply
4 R’s
Appropriate rate, method
timing, & placement
of P can increase crop
uptake & decrease runoff
loss
Rotational grazing
reduces P runoff & N
leached
Stream bank
fencing
Decreases P
deposition in
streams
Conservation
tillage
reduces P runoff
Riparian buffers
trap particulate
nutrients
Cover crops
reduces P runoff
BMP Credit
Diversion 5%
Terrace 10%
Pond 20%
Fenced Pond 30%
Filter Strip 20%
Fenced Filter Strip 30%
Grassed waterway 10%
BMP Credit
Fencing 30%
Riparian Forest Buffer 20%
Fenced Riparian Forest Buffer 35%
Riparian Herbaceous Cover 20%
Fenced Riparian Herbaceous Cover 30%
Field Borders 10%
-100 1000
Effect on total P loss, %
Decreased loss Increased loss
Manure mgt. system (14)
Nutrient mgt. plan (14)
Stream fencing (3)
Vegetated buffers (34)
Dinnes et al., 2004 & Gitau, 2005
-40%
-15%
Farm pond (12)
-50%
-28%
-65%
AR Water Resources Center, 2012
Dissolved P Total P
2000 0.224 0.377
2003 0.148 0.244
2011 0.070 0.130
Mean annual concentration, ppm
Maumee River
watershed
Sandusky River
watershed
MICHIGAN
Lake Erie
OHIO
Lessons from Lake Erie Basin
Annual flow-weighted total P, ppm
1975 1985 1995 2005
0.8
0.6
0.4
0
0.2
50% decrease
Dave Baker & Peter Richards, OH
Adoption of mulch and no-till soybeans, %
1975 1985 1995 2005
0.12
0.09
0.06
0
0.03
Annual flow-weighted dissolved P, ppm
75% decrease
80
60
40
20
1975 1985 1995 2005
0.12
0.09
0.06
0
0.03
Adaptive management may
have reduced nutrient loss
 Incorporation of fertilizer and
manure
 Winter cover crops
 Spring fertilization
• Spring workload is huge with more
time-sensitive tasks
• Fertilizer usually costs more in spring
• Less soil compaction on frozen ground
But the reality is …….
• Researchers need to
step back and look
at the big picture
Tools for phosphorus management

Tools for phosphorus management

  • 1.
    Tools for Phosphorus Management AndrewSharpley Water to Worth: Spreading Science and Solutions Denver, CO; April 1 – 5, 2013
  • 2.
    History risk assessment Revisionof the NRCS 590 Nutrient Management Standard & P Indices Its use & misuse for P management BMPs and their assessment The way forward Today’s presentation
  • 3.
  • 4.
    • National PResearch Project outcomes  Standardized methods for rainfall – runoff studies  Established relationships between STP and runoff  Integrated into P Indices  Incorporated into NMP process • Success partly due to  Group effort – Land Grant & ARS  Flexibility to adapt to State needs
  • 6.
  • 7.
  • 8.
  • 9.
  • 10.
  • 11.
  • 13.
    Dissolved P mg L-1 Mehlich-3P, mg kg-1 FD-36 watershed - PA 1 0 2 3 0 200 400 600 800 R2 = 0.86 Crop response 200 mg L-1 Change point
  • 14.
    P loss affectedby many factors177 144 44 4620 1 <1 97 55 DP 8 DP78 92 0 Tony Buda, ARS, PA Soil P – ppm P added – kg P/ha/yr Runoff – liters P loss – kg P/ha/yr
  • 15.
    High source High transport Critical Source Area Ledto the 80/20 rule: 80% of P comes from 20% of land area Risk assessment used by most states for nutrient management planning (CPS 590)
  • 16.
    • Runoff potential •Erosion potential • Leaching potential • Proximity to stream TransportSource • Soil P content • Added P • Rate, method, timing of fertilizer & manure • Manure P solubility
  • 17.
    1 0 2 3 P index valuefor the site 0 50 100 150 200 R2=0.80 75 kg P/ha TSP 112 kg P/ha poultry litter 150 kg P/ha poultry manure Runoff P, g/ha Very highHighMedLow Soil P, mg/kg
  • 18.
  • 19.
    • Disparity amongIndices across the country  Varied with soils, topography, & state priorities • Often, not leading to a decline in STP nor improvement in water quality  Legacy effects • Perceived as farmer friendly • The P Index was never meant to be the solution to P management issues
  • 20.
    P loss kg ha-1 ALAR GA MS NC TN TX 0.5 Low Low Low Low Low High Med. 2.7 Med. High High Low Low V. High High 4.0 Low High Med. Low Low V. high High 5.8 Low V. high V. high Low Med. V. high High 10.9 Low V. high V. high Low Med. V. high High 23.7 Low V. high V. high Low High V. high High Osmond et al., 2012
  • 21.
    • Appropriately accountfor major sources & processes determining P loss & rank risk of loss for any given site • Directionally and magnitudinally correct • Interpretations based on assigned risk are equivalent across state borders, given similar site & water resource conditions • Where inadequacies exist, the causes can be identified & addressed
  • 22.
    •At a minimumthis should include  Site runoff, management, climate, water quality  Event, planning / rotation period & annual loss  Natural rainfall • Network of sites and data exchange being developed – Kleinman et al. • MANAGE – Daren Harmel
  • 23.
    •Select appropriate model APEX, APLE, DrainMod  Locally calibrated (within state)  Event, planning / rotation period & annual loss • Model & Index must estimate P loss & simulate P mobilization & transport over same time scales
  • 24.
    Dietary P mgt.& use of enzymes enhances nutrient absorption & reduces excretion Manure additives can reduce P solubility & NH3 loss Manure treatment Solid-liquid separation, struvite, zeolite Struvite
  • 25.
    Subsurface injection reduces Prunoff & N volatilization Soil & manure testing to tailor rates of P to apply 4 R’s Appropriate rate, method timing, & placement of P can increase crop uptake & decrease runoff loss
  • 26.
    Rotational grazing reduces Prunoff & N leached Stream bank fencing Decreases P deposition in streams Conservation tillage reduces P runoff Riparian buffers trap particulate nutrients Cover crops reduces P runoff
  • 27.
    BMP Credit Diversion 5% Terrace10% Pond 20% Fenced Pond 30% Filter Strip 20% Fenced Filter Strip 30% Grassed waterway 10%
  • 28.
    BMP Credit Fencing 30% RiparianForest Buffer 20% Fenced Riparian Forest Buffer 35% Riparian Herbaceous Cover 20% Fenced Riparian Herbaceous Cover 30% Field Borders 10%
  • 29.
    -100 1000 Effect ontotal P loss, % Decreased loss Increased loss Manure mgt. system (14) Nutrient mgt. plan (14) Stream fencing (3) Vegetated buffers (34) Dinnes et al., 2004 & Gitau, 2005 -40% -15% Farm pond (12) -50% -28% -65%
  • 30.
    AR Water ResourcesCenter, 2012 Dissolved P Total P 2000 0.224 0.377 2003 0.148 0.244 2011 0.070 0.130 Mean annual concentration, ppm
  • 31.
  • 32.
    Annual flow-weighted totalP, ppm 1975 1985 1995 2005 0.8 0.6 0.4 0 0.2 50% decrease Dave Baker & Peter Richards, OH
  • 33.
    Adoption of mulchand no-till soybeans, % 1975 1985 1995 2005 0.12 0.09 0.06 0 0.03 Annual flow-weighted dissolved P, ppm 75% decrease 80 60 40 20
  • 34.
    1975 1985 19952005 0.12 0.09 0.06 0 0.03 Adaptive management may have reduced nutrient loss  Incorporation of fertilizer and manure  Winter cover crops  Spring fertilization
  • 35.
    • Spring workloadis huge with more time-sensitive tasks • Fertilizer usually costs more in spring • Less soil compaction on frozen ground But the reality is …….
  • 36.
    • Researchers needto step back and look at the big picture