LCC ASIA PACIFIC EMSC WEEKLY RESEARCH_20170901_edition226

LCC Asia Pacific produces a weekly report on the Australian public companies that operate in the Engineering, General Services, Oil & Gas Fields Services, Facilities Management, Construction, Contracting and Mining Services Sectors. Each week the LCC Asia Pacific market update covers off on Merger & Acquisition Activity, changes to stock trading prices, general corporate activity and indicative valuations The report also details both key Australian Stock Exchange announcements that are made in relation to contractual wins or key developments as well as outlining strategic activity that has taken place in the Sector In addition to public domain, this report is uploaded weekly to a variety of international investment banking platforms, including Bloomberg, Thomson Reuters Eikon, S & P and FACTSET LCC Asia Pacific has specific expertise in these Sectors built up over many years, and the weekly Engineering, Services, Contracting & Services market update uploaded here is Edition 226 This edition also notes that LCC’s Nicholas Assef will be speaking at the Mining Investment China Conference in Shanghai on 23rd & 24th of October this year on the topic of China’s Belt & Road Initiative and areas where companies can develop strategies to capitalise on this exciting initiative. More on the conference can be learned at www.mininginvestmentchina.com LCC Asia Pacific also provides a number of other public resources, including the Twitter Feed @MergerNews (www.twitter.com/MergerNews) which tracks all Merger & Acquisition announcements made on the Australian Stock Exchange and the Twitter Feed @ChinaBeltRoad (www.twitter.com/ChinaBeltRoad) which tracks relevant news stories and research reports relating to China’s “One Belt, One Road” initiative where LCC Asia Pacific is building out a strategic advisory practice to assist companies in becoming involved with BRI

Recommended
Recommended
More Related Content
What's hot
What's hot (20)
Similar to LCC ASIA PACIFIC EMSC WEEKLY RESEARCH_20170901_edition226
Similar to LCC ASIA PACIFIC EMSC WEEKLY RESEARCH_20170901_edition226 (20)
Recently uploaded
Recently uploaded (20)
LCC ASIA PACIFIC EMSC WEEKLY RESEARCH_20170901_edition226
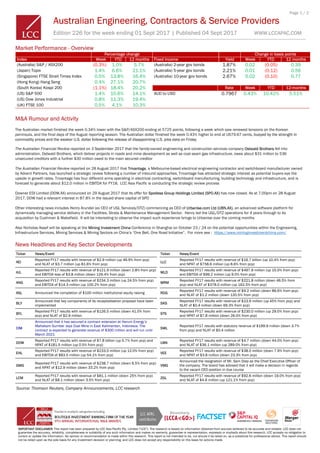
- 1. Page 1 / 2 Australian Engineering, Contractors & Service Providers Edition 226 for the week ending 01 Sept 2017 | Published 04 Sept 2017 WWW.LCCAPAC.COM IMPORTANT DISCLAIMER: This report has been prepared by LCC Asia Pacific Pty. Limited ("LCC"). The research is based on information obtained from sources believed to be accurate and reliable. LCC does not guarantee the accuracy, reliability, completeness or suitability of any such information and makes no warranty, guarantee or representation, expressly or impliedly about this research. LCC accepts no obligation to correct or update the information. No opinion or recommendation is made within this research. This report is not intended to be, nor should it be relied on, as a substitute for professional advice. This report should not be relied upon as the sole basis for any investment decision or planning, and LCC does not accept any responsibility on this basis for actions made. Source: Thomson Reuters, Company Announcements, LCC research Market Performance - Overview Percentage change Change in basis points Index Week YTD 12 months Fixed Income Yield Week YTD 12 months (Australia) S&P / ASX200 (0.3%) 1.0% 5.7% (Australia) 2-year gov bonds 1.87% 0.02 (0.05) 0.39 (Japan) Topix 1.4% 6.6% 21.1% (Australia) 5-year gov bonds 2.21% 0.01 (0.12) 0.56 (Singapore) FTSE Strait Times Index 0.5% 13.8% 16.4% (Australia) 10-year gov bonds 2.67% 0.02 (0.10) 0.77 (Hong Kong) Hang Seng 0.4% 27.1% 20.7% (South Korea) Kospi 200 (1.1%) 18.4% 20.2% Rate Week YTD 12-months (US) S&P 500 1.4% 10.6% 14.1% AUD to USD 0.7967 0.43% 10.42% 5.51% (US) Dow Jones Industrial 0.8% 11.3% 19.4% (UK) FTSE 100 0.5% 4.1% 10.3% M&A Rumour and Activity The Australian market finished the week 0.34% lower with the S&P/ASX200 ending at 5725 points, following a week which saw renewed tensions on the Korean peninsula, and the final days of the August reporting season. The Australian dollar finished the week 0.43% higher to end at US79.67 cents, buoyed by the strength in commodity prices and the weaker U.S. dollar following the release of disappointing U.S. jobs data on Friday The Australian Financial Review reported on 3 September 2017 that the family-owned engineering and construction services company Ostwald Brothers fell into administration. Ostwald Brothers, which deliver projects in roads and mine development as well as coal seam gas infrastructure, owes about $31 million to 536 unsecured creditors with a further $30 million owed to the main secured creditor The Australian Financial Review reported on 28 August 2017 that Trivantage, a Melbourne-based electrical engineering contractor and switchboard manufacturer owned by Advent Partners, has launched a strategic review following a number of inbound approaches. Trivantage has attracted strategic interest as potential buyers eye the upside in growth rates. Trivantage has four different arms operating in electrical contracting, switchboard manufacturing, building technology and infrastructure, and is forecast to generate about $12.0 million in EBITDA for FY18. LCC Asia Pacific is conducting the strategic review process Downer EDI Limited (DOW.AX) announced on 29 August 2017 that its offer for Spotless Group Holdings Limited (SPO.AX) has now closed. As at 7.00pm on 28 August 2017, DOW had a relevant interest in 87.8% in the issued share capital of SPO Other interesting news includes Henry Arundel (ex CEO of UGL Services/DTZ) commencing as CEO of Urbanise.com Ltd (UBN.AX), an advanced software platform for dynamically managing service delivery in the Facilities, Strata & Maintenance Management Sector. Henry led the UGL/DTZ operations for 4 years through to its acquisition by Cushman & Wakefield. It will be interesting to observe the impact such experience brings to Urbanise over the coming months Also Nicholas Assef will be speaking at the Mining Investment China Conference in Shanghai on October 23 / 24 on the potential opportunities within the Engineering, Infrastructure Services, Mining Services & Mining Sectors on China’s “One Belt, One Road Initiative”. For more see : https://www.mininginvestmentchina.com/ News Headlines and Key Sector Developments Ticker News/Event Ticker News/Event AEI Reported FY17 results with revenue of $2.9 million (up 46.9% from pcp) and NLAT of $3.7 million (up 81.6% from pcp) LLC Reported FY17 results with revenue of $16.7 billion (up 10.4% from pcp) and NPAT of $758.6 million (up 8.6% from pcp) AJL Reported FY17 results with revenue of $121.9 million (down 2.8% from pcp) and EBITDA loss of $3.8 million (down 126.4% from pcp) MLD Reported FY17 results with revenue of $497.9 million (up 15.0% from pcp) and EBITDA of $99.2 million (up 9.0% from pcp) ANG Reported FY17 results with revenue of $234.3 million (up 24.5% from pcp) and EBITDA of $14.3 million (up 100.2% from pcp) MRM Reported FY17 results with revenue of $221.8 million (down 46.5% from pcp) and NLAT of $378.0 million (up 162.5% from pcp) ASL Announced the completion of $100 million institutional equity raising RDG Reported FY17 results with revenue of $9.2 million (down 86.6% from pcp) and NLAT of $1.2 million (down 120.5% from pcp) BLY Announced that key components of its recapitalisation proposal have been implemented SKS Reported FY17 results with revenue of $23.9 million (up 45% from pcp) and NLAT of $0.4 million (down 69.3% from pcp) BYL Reported FY17 results with revenue of $126.5 million (down 41.0% from pcp) and NLAT of $2.9 million STS Reported FY17 results with revenue of $230.0 million (up 29.0% from pcp) and NPAT of $7.8 million (down 26.0% from pcp) CIM Announced that it has secured a contract extension at Harum Energy’s Mahakam Sumber Jaya Coal Mine in East Kalimantan, Indonesia. The contract is expected to generate revenue of $300 million and will run until March 2021 SWL Reported FY17 results with statutory revenue of $199.9 million (down 3.7% from pcp) and NLAT of $0.4 million DOW Reported FY17 results with revenue of $7.8 billion (up 5.7% from pcp) and NPAT of $181.5 million (up 0.5% from pcp) UBN Reported FY17 results with revenue of $4.7 million (down 44.0% from pcp) and NLAT of $36.1 million (up 289.0% from pcp) EHL Reported FY17 results with revenue of $233.0 million (up 12.0% from pcp) and EBITDA of $83.5 million (up 54.1% from pcp) VEE Reported FY17 results with revenue of $38.0 million (down 7.9% from pcp) and NPAT of $3.8 million (down 23.3% from pcp) GMG Reported FY17 results with revenue of $238.7 million (down 6.5% from pcp) and NPAT of $12.9 million (down 33.2% from pcp) VMG Announced the resignation of Mr. Sam Diep as the Chief Executive Officer of the company. The board has advised that it will make a decision in regards to the vacant CEO position in due course LCM Reported FY17 results with revenue of $81.1 million (down 25% from pcp) and NLAT of $8.1 million (down 3.5% from pcp) ZGL Reported FY17 results with revenue of $92.6 million (down 19.0% from pcp) and NLAT of $4.6 million (up 121.1% from pcp)
- 2. Page 2 / 2 Australian Engineering, Contractors & Service Providers Edition 226 for the week ending 01 Sept 2017 | Published 04 Sept 2017 WWW.LCCAPAC.COM IMPORTANT DISCLAIMER: This report has been prepared by LCC Asia Pacific Pty. Limited ("LCC"). The research is based on information obtained from sources believed to be accurate and reliable. LCC does not guarantee the accuracy, reliability, completeness or suitability of any such information and makes no warranty, guarantee or representation, expressly or impliedly about this research. LCC accepts no obligation to correct or update the information. No opinion or recommendation is made within this research. This report is not intended to be, nor should it be relied on, as a substitute for professional advice. This report should not be relied upon as the sole basis for any investment decision or planning, and LCC does not accept any responsibility on this basis for actions made. Ticker Company Name Market Cap (A$ m) Open Price (A$) Close Price (A$) Week High (A$) Week Low (A$) Volume Trend EV/ EBITDA EV/ EBIT Engineering Services AJL.AX AJ Lucas Group Ltd 140 0.27 0.24 0.27 0.24 ▼ (2.0%) 33.8x n.m. BOL.AX Boom Logistics Ltd 57 0.13 0.12 0.12 0.11 ▼ (4.0%) 10.0x n.m. BSA.AX BSA Ltd 161 0.39 0.38 0.38 0.37 — 0.0% 11.2x 17.9x BYL.AX Brierty Ltd 11 0.08 0.08 0.08 0.08 ▲ 1.2% n.m. n.m. CDD.AX Cardno Ltd 681 1.29 1.42 1.41 1.29 ▲ 10.1% 22.8x 100.7x CIM.AX CIMIC Group Ltd 13,479 42.62 41.68 41.98 41.62 ▼ (2.0%) 10.1x 15.2x DCG.AX Decmil Group Ltd 165 0.95 0.96 0.93 0.85 ▲ 1.6% 109.9x n.m. DOW.AX Downer EDI Ltd 4,157 6.84 6.99 7.05 6.76 ▲ 2.0% 10.4x 18.1x EAL.AX E&A Ltd 6 0.05 0.05 0.05 0.05 — 0.0% n.m. n.m. EGN.AX Engenco Ltd 97 0.305 0.31 0.31 0.29 ▲ 1.6% 7.2x 10.4x GCS.AX Global Construction Services Ltd 116 0.56 0.55 0.55 0.54 ▼ (3.5%) 3.8x 4.9x GNG.AX GR Engineering Services Ltd 192 1.26 1.26 1.27 1.25 ▼ (3.5%) 9.4x 10.2x LCM.AX LogiCamms Ltd 25 0.35 0.30 0.35 0.28 ▼ (14.3%) n.m. n.m. LLC.AX LendLease Group 9,505 16.40 16.29 16.46 16.01 ▼ (1.0%) 11.8x 13.2x LYL.AX Lycopodium Ltd 153 3.75 3.85 3.75 3.50 ▲ 2.7% 3.0x 3.1x MND.AX Monadelphous Group Ltd 1,413 15.25 15.04 15.13 15.01 ▼ (1.5%) 12.0x 14.7x OTR.AX Onterran Ltd 20 0.32 0.32 0.32 0.32 — 0.0% n.m. n.m. RCR.AX RCR Tomlinson Ltd 644 4.17 4.00 4.17 3.95 ▼ (3.6%) 12.2x 19.2x RDG.AX Resource Development Group Ltd 11 0.02 0.02 0.02 0.02 — 0.0% (0.2x) (0.3x) SND.AX Saunders International Ltd 49 0.61 0.57 0.61 0.57 ▼ (5.8%) 28.3x 57.6x SSM.AX Service Stream Ltd 540 1.50 1.48 1.47 1.44 ▼ (0.7%) 10.1x 11.9x SWL.AX Seymour Whyte Ltd 121 1.38 1.37 1.37 1.36 ▼ (0.7%) 34.3x n.m. SXE.AX Southern Cross Electrical Engineering Ltd 116 0.63 0.73 0.69 0.61 ▲ 16.9% 17.4x n.m. STS.AX SRG Ltd 92 1.56 1.44 1.43 1.38 ▼ (7.7%) 4.5x 6.5x TPP.AX Tempo Australia Ltd 42 0.17 0.18 0.18 0.17 ▼ (7.9%) 10.2x 11.5x VMG.AX VDM Group Ltd 5 0.00 0.00 0.00 0.00 — 0.0% n.m. n.m. VMX.AX Valmec Ltd 18 0.19 0.22 0.23 0.19 ▲ 13.2% 5.4x 7.4x VRS.AX Veris Ltd 57 0.16 0.18 0.18 0.16 ▲ 9.4% 5.7x 42.8x WOR.AX WorleyParsons Ltd 3,286 13.38 13.30 13.49 13.09 ▼ (0.7%) 12.5x 16.5x Mining Services ASL.AX Ausdrill Ltd 668 2.37 2.14 2.30 2.00 ▼ (8.5%) 7.5x 15.8x ANG.AX Austin Engineering Ltd 133 0.24 0.23 0.24 0.19 ▼ (4.2%) n.m. n.m. BLY.AX Boart Longyear Ltd 62 0.08 0.07 0.08 0.06 ▼ (18.8%) 26.0x n.m. BKN.AX Bradken Ltd 676 3.21 3.24 3.21 3.21 — 0.0% n.m. n.m. DSB.AX Delta SBD Ltd 8 0.14 0.14 0.14 0.14 — 0.0% 72.6x n.m. EHL.AX Emeco Holdings Ltd 414 0.19 0.17 0.17 0.17 ▼ (5.6%) 11.5x 234.3x IMD.AX Imdex Ltd 334 0.89 0.91 0.91 0.86 ▲ 3.4% 17.3x 41.9x MAH.AX Macmahon Holdings Ltd 408 0.18 0.19 0.19 0.18 ▲ 5.6% 15.6x n.m. MIN.AX Mineral Resources Ltd 2,810 14.89 15.00 14.88 14.57 — 0.0% 5.9x 9.1x MLD.AX MACA Ltd 466 1.82 1.99 1.91 1.78 ▲ 8.7% 5.2x 15.9x MSV.AX Mitchell Services Ltd 56 0.04 0.04 0.04 0.04 — 0.0% 23.0x n.m. MYE.AX Mastermyne Group Ltd 49 0.55 0.54 0.55 0.53 ▼ (1.8%) 11.0x n.m. NWH.AX NRW Holdings Ltd 391 1.14 1.09 1.10 1.03 ▼ (4.8%) 7.2x 13.9x RUL.AX RPMGlobal Holdings Ltd 153 0.70 0.72 0.72 0.69 ▲ 1.4% 29.0x 75.0x SWK.AX Swick Mining Services Ltd 69 0.32 0.30 0.32 0.30 ▼ (7.7%) 6.2x n.m. Marine Services ASB.AX Austal Ltd 591 1.75 1.70 1.71 1.60 ▼ (4.0%) 7.13 11.01 MBO.AX Mobilarm Ltd 12 0.02 0.03 0.02 0.02 — 0.0% 62.0x n.m. MCE.AX Matrix Composites & Engineering Ltd 40 0.49 0.43 0.48 0.43 ▼ (10.4%) n.m. n.m. MRM.AX MMA Offshore Ltd 69 0.18 0.185 0.18 0.17 ▼ (2.6%) 17.0x n.m. NMS.AX Neptune Marine Services Ltd 55 0.84 0.9 0.90 0.84 ▲ 7.1% n.m. n.m. VEE.AX VEEM Ltd 77 0.585 0.595 0.59 0.56 ▲ 1.7% 9.1x 11.3x ZGL.AX Zicom Group Ltd 29 0.13 0.14 0.14 0.13 ▲ 3.8% n.m. n.m. Facilities Management AEI.AX Aeris Environmental Ltd 44 0.27 0.28 0.28 0.26 ▲ 3.7% n.m. n.m. GMG.AX Goodman Group Pty Ltd 14,796 8.23 8.27 8.19 8.05 ▲ 0.4% 56.2x 57.9x HIL.AX Hills Ltd 43 0.17 0.19 0.18 0.17 ▲ 5.7% 7.8x 38.3x MIL.AX Millennium Services Group Ltd 75 1.66 1.64 1.64 1.58 ▲ 5.8% 6.2x 9.6x PRG.AX Programmed Maintenance Services Ltd 773 2.98 3.00 2.99 2.97 ▲ 1.0% 10.1x 14.7x SKS.AX Stokes Ltd 12 0.28 0.30 0.28 0.28 — 0.0% 24.8x 32.3x SPO.AX Spotless Group Holdings Ltd 1,212 1.15 1.10 1.15 1.00 ▼ (4.3%) 8.9x 17.6x TPS.AX Threat Protect Australia Ltd 20 0.03 0.03 0.03 0.03 — 0.0% 25.4x 51.6x UBN.AX Urbanise com Ltd 19 0.07 0.06 0.07 0.06 ▼ (14.1%) n.m. n.m. Source: Thomson Reuters, LCC research Weekly change (%)