SlideShare a Scribd company logo
1 of 4
Trading Strategy Generator using Deep Reinforcement Learning
Covering an End-to-End Trading Strategy Life Cycle
1
Define
Meta-Parameters
Loading
Historical Data
Time Series
Processing
Historical Data
Time Series
Building
Prediction Models
Deriving
Risk-Minimizing
Portfolio
Generating
Trading
Strategies
Putting
Optimal Trading
Strategy into Production
Trading Strategy Generator
Putting Optimal Trading Strategy into Production
2…
1
2
3
4
5
9
10
10
6
7
8 11
12
13
14
Trading Strategy Generator
Generating Trading Strategies using Deep Reinforcement Learning
3
• As an example, the goal is to generate an equity-based portfolio for the FTSE100,
by detecting and executing optimized asset selection and allocation strategies.
• Engine is putting an ‘end-of-day’ trading strategy into production by initializing a
portfolio at 14/9/2016 and rebalancing it if needed in the 5 trading days to come
implying a weekly realignment if necessary.
• By performing extensive ‘paper trading’, using Machine Learning (ML), the engine
concludes to combine a portfolio based on a ML-based trading strategy (Wijnen)
with a portfolio based on MPT (Markowitz – Modern Portfolio Theory) allocating
weights to the two strategies of 62.8% and 37.2% respectively. By performing ML, the
engine picks following components of the FTSE100 to be part of the portfolio and also
determines the number of components to pick (5): POLY, SGE, RB, CPG and FRES to
be traded in Pound Sterling (GBP).
• The table with labels ‘Prices at’, ‘Prediction at +1’ and ‘Prediction at’ show actual prices
(open) and predicted prices (close) for each of the shares selected. ‘Prediction at’ is a
prediction of closing price for same trading day, while ‘Prediction at +1’ is our estimate of
next day’s closing price. Prices are given for a ‘bundle of a given asset, e.g. 100
shares instead of 1’ in order to have a way of comparing the pricing of the different
assets.
• The engine examines both ‘The tendency to go Long’ and ‘The tendency to go
Short’ and expresses the results as a long and short position for each of the
assets respectively (E.g. for POLY go long for 840 shares, go short for 1936 shares.).
Finally the ‘netted position’ is determined (E.g. for POLY S1096, where S = Short vs. L =
Long and 1096 the number of shares to go short.).
1
2
3
4
Trading Strategy Generator
Generating Trading Strategies using Deep Reinforcement Learning
4
• The next trading day (15/9/2019) actual prices are retrieved and predictions generated.
• At 15/9/2019, the portfolio can be/is rebalanced based on market behavior: Rebalancing is analyzed for
‘going long’ and ‘going short’ simultaneously (E.g. for POLY the tendency is to increase the long
position by 47 and the short position by 108, resulting in a netted tendency to go short by 61 shares.).
• The engine keeps track of actual cumulative ‘Profit and Loss’ (P&L), and worst and best results in
terms of cumulative P&L thus far. This info is used in order to determine whether or not to liquidate the
portfolio.
• The engine rebalances the portfolio for 16/9/2019. Every trading day the engine evaluates whether to
rebalance or liquidate the portfolio.
• Graph showing the cumulative P&L over time (in trading days) for the strategy that has been put into
production.
• The part of the graph to the left of the ‘red dashed line’ shows the ‘learning’ being done by the engine. The
‘red dashed line’ shows when the strategy was first put into ‘production’. So, the to the right, actual trading
results are shown.
• As the trading strategy above seems to become less profitable after a given moment in time, we
decide to switch to a new trading strategy.
• Graph showing the amount of cash needed to execute the strategy (Positive values reflect cash
consumption while going long, negative values reflect cash impact going short.) over time.
• Graph showing the ‘Long Ratio’, which expresses the estimated probability that the market will go long
(So 0 implies 100% short, 1 reflects 100% long.).
• Graph showing the profitability of the strategy as a % per annum (E.g. 0.30 implies 30% return over the
year.).
ADDED VALUE FOR ASSET MANAGERS:
=> More accurate estimates of future expected returns and asset pricing (How: Other pptx).
=> Powerful ML-driven trading engine/portfolio optimization exploiting this increase in
accuracy by creating trading strategies in real-time reflecting current changes in market
behavior and thus allow for significantly ‘outperforming the market’.
5
6
7
8
9

More Related Content

What's hot

HDFC sec note mf category analysis - arbitrage funds - june 2015
HDFC sec note   mf category analysis - arbitrage funds - june 2015HDFC sec note   mf category analysis - arbitrage funds - june 2015
HDFC sec note mf category analysis - arbitrage funds - june 2015
Dhuraivel Gunasekaran
 
National Stock Exchange and Nasdaq 100
National Stock Exchange and Nasdaq 100National Stock Exchange and Nasdaq 100
National Stock Exchange and Nasdaq 100
Abhra Basak
 
Black Swan Event and How to Prepare for It
Black Swan Event and How to Prepare for ItBlack Swan Event and How to Prepare for It
Black Swan Event and How to Prepare for It
Samir Halim
 
The capital-asset-pricing-model-capm75
The capital-asset-pricing-model-capm75The capital-asset-pricing-model-capm75
The capital-asset-pricing-model-capm75
Rana Faisal Ali
 

What's hot (10)

HDFC sec note mf category analysis - arbitrage funds - june 2015
HDFC sec note   mf category analysis - arbitrage funds - june 2015HDFC sec note   mf category analysis - arbitrage funds - june 2015
HDFC sec note mf category analysis - arbitrage funds - june 2015
 
A study of derivatives ppt
A study of derivatives  pptA study of derivatives  ppt
A study of derivatives ppt
 
Major Final Presentation 9910103551
Major Final Presentation 9910103551Major Final Presentation 9910103551
Major Final Presentation 9910103551
 
National Stock Exchange and Nasdaq 100
National Stock Exchange and Nasdaq 100National Stock Exchange and Nasdaq 100
National Stock Exchange and Nasdaq 100
 
Myth & facts of mutual funds
Myth & facts of mutual fundsMyth & facts of mutual funds
Myth & facts of mutual funds
 
Black Swan Event and How to Prepare for It
Black Swan Event and How to Prepare for ItBlack Swan Event and How to Prepare for It
Black Swan Event and How to Prepare for It
 
Stock Pitch For Satellite Based Solutions PowerPoint Presentation Ppt Slide T...
Stock Pitch For Satellite Based Solutions PowerPoint Presentation Ppt Slide T...Stock Pitch For Satellite Based Solutions PowerPoint Presentation Ppt Slide T...
Stock Pitch For Satellite Based Solutions PowerPoint Presentation Ppt Slide T...
 
The capital-asset-pricing-model-capm75
The capital-asset-pricing-model-capm75The capital-asset-pricing-model-capm75
The capital-asset-pricing-model-capm75
 
Let’s invest it (Stock Market)
Let’s invest it (Stock Market)Let’s invest it (Stock Market)
Let’s invest it (Stock Market)
 
Sip presentation
Sip presentationSip presentation
Sip presentation
 

Similar to Trading Engine/Robo-Advisor using Deep Reinforcement Learning

L2 flash cards equity - SS 10
L2 flash cards equity - SS 10L2 flash cards equity - SS 10
L2 flash cards equity - SS 10
analystbuddy
 
35 page the term structure and interest rate dynamics
35 page the term structure and interest rate dynamics35 page the term structure and interest rate dynamics
35 page the term structure and interest rate dynamics
Shahid Jnu
 

Similar to Trading Engine/Robo-Advisor using Deep Reinforcement Learning (20)

Pricing of Forwards and Futures.ppt
Pricing of Forwards and Futures.pptPricing of Forwards and Futures.ppt
Pricing of Forwards and Futures.ppt
 
L2 flash cards equity - SS 10
L2 flash cards equity - SS 10L2 flash cards equity - SS 10
L2 flash cards equity - SS 10
 
Dynamic stopcharts
Dynamic stopchartsDynamic stopcharts
Dynamic stopcharts
 
IDFC Arbitrage Fund_Key information memorandum
IDFC Arbitrage Fund_Key information memorandumIDFC Arbitrage Fund_Key information memorandum
IDFC Arbitrage Fund_Key information memorandum
 
IDFC Arbitrage Fund_Key information memorandum
IDFC Arbitrage Fund_Key information memorandumIDFC Arbitrage Fund_Key information memorandum
IDFC Arbitrage Fund_Key information memorandum
 
Advance IQ Capital Quantitative Models
Advance IQ Capital Quantitative ModelsAdvance IQ Capital Quantitative Models
Advance IQ Capital Quantitative Models
 
Advance iq capital quantitative models
Advance iq capital quantitative modelsAdvance iq capital quantitative models
Advance iq capital quantitative models
 
Dynamic statistical trading strategy
Dynamic statistical trading strategyDynamic statistical trading strategy
Dynamic statistical trading strategy
 
Uho190819 h112
Uho190819 h112Uho190819 h112
Uho190819 h112
 
Technical Trading Rules for the NASDAQ100
Technical Trading Rules for the NASDAQ100Technical Trading Rules for the NASDAQ100
Technical Trading Rules for the NASDAQ100
 
35 page the term structure and interest rate dynamics
35 page the term structure and interest rate dynamics35 page the term structure and interest rate dynamics
35 page the term structure and interest rate dynamics
 
Wealth Accumulation under Equity Trading; A Rational Approach
Wealth Accumulation under Equity Trading; A Rational ApproachWealth Accumulation under Equity Trading; A Rational Approach
Wealth Accumulation under Equity Trading; A Rational Approach
 
Does trend following work on stocks?
Does trend following work on stocks?Does trend following work on stocks?
Does trend following work on stocks?
 
IRJET - Stock Recommendation System using Machine Learning Approache
IRJET - Stock Recommendation System using Machine Learning ApproacheIRJET - Stock Recommendation System using Machine Learning Approache
IRJET - Stock Recommendation System using Machine Learning Approache
 
08~chapter 8 primer_on_relative_valuation_methods
08~chapter 8 primer_on_relative_valuation_methods08~chapter 8 primer_on_relative_valuation_methods
08~chapter 8 primer_on_relative_valuation_methods
 
Science in the City 2022 Prof J Jamesv[2022]
Science in the City 2022 Prof J Jamesv[2022]Science in the City 2022 Prof J Jamesv[2022]
Science in the City 2022 Prof J Jamesv[2022]
 
Employee Stock Options advanced concepts
 Employee Stock Options advanced concepts Employee Stock Options advanced concepts
Employee Stock Options advanced concepts
 
I Know First Presentation (May 2016)
I Know First Presentation (May 2016)I Know First Presentation (May 2016)
I Know First Presentation (May 2016)
 
Algo Trading
Algo TradingAlgo Trading
Algo Trading
 
FI 335 - Derivatives Project #1
FI 335 - Derivatives Project #1FI 335 - Derivatives Project #1
FI 335 - Derivatives Project #1
 

Recently uploaded

Prezentacja Q1 2024 EN strona www relacji
Prezentacja Q1 2024  EN strona www relacjiPrezentacja Q1 2024  EN strona www relacji
Prezentacja Q1 2024 EN strona www relacji
klaudiafilka
 
State Space Tutorial.pptxjjjjjjjjjjjjjjj
State Space Tutorial.pptxjjjjjjjjjjjjjjjState Space Tutorial.pptxjjjjjjjjjjjjjjj
State Space Tutorial.pptxjjjjjjjjjjjjjjj
joshuaclack73
 
ASSESSING HRM EFFECTIVENESS AND PERFORMANCE ENHANCEMENT MEASURES IN THE BANKI...
ASSESSING HRM EFFECTIVENESS AND PERFORMANCE ENHANCEMENT MEASURES IN THE BANKI...ASSESSING HRM EFFECTIVENESS AND PERFORMANCE ENHANCEMENT MEASURES IN THE BANKI...
ASSESSING HRM EFFECTIVENESS AND PERFORMANCE ENHANCEMENT MEASURES IN THE BANKI...
indexPub
 
一比一原版(Caltech毕业证书)加州理工学院毕业证成绩单学位证书
一比一原版(Caltech毕业证书)加州理工学院毕业证成绩单学位证书一比一原版(Caltech毕业证书)加州理工学院毕业证成绩单学位证书
一比一原版(Caltech毕业证书)加州理工学院毕业证成绩单学位证书
atedyxc
 
一比一原版(UCSD毕业证书)加利福尼亚大学圣迭戈分校毕业证成绩单学位证书
一比一原版(UCSD毕业证书)加利福尼亚大学圣迭戈分校毕业证成绩单学位证书一比一原版(UCSD毕业证书)加利福尼亚大学圣迭戈分校毕业证成绩单学位证书
一比一原版(UCSD毕业证书)加利福尼亚大学圣迭戈分校毕业证成绩单学位证书
atedyxc
 
一比一原版(SFU毕业证书)西蒙菲莎大学毕业证成绩单学位证书
一比一原版(SFU毕业证书)西蒙菲莎大学毕业证成绩单学位证书一比一原版(SFU毕业证书)西蒙菲莎大学毕业证成绩单学位证书
一比一原版(SFU毕业证书)西蒙菲莎大学毕业证成绩单学位证书
atedyxc
 
Bahawalpur Culture.pptx pptx pptx pttx pttx
Bahawalpur Culture.pptx pptx pptx pttx pttxBahawalpur Culture.pptx pptx pptx pttx pttx
Bahawalpur Culture.pptx pptx pptx pttx pttx
AbdulNasirNichari
 
一比一原版(Caltech毕业证书)加利福尼亚理工学院毕业证成绩单学位证书
一比一原版(Caltech毕业证书)加利福尼亚理工学院毕业证成绩单学位证书一比一原版(Caltech毕业证书)加利福尼亚理工学院毕业证成绩单学位证书
一比一原版(Caltech毕业证书)加利福尼亚理工学院毕业证成绩单学位证书
atedyxc
 
TriStar Gold- 05-13-2024 corporate presentation
TriStar Gold- 05-13-2024 corporate presentationTriStar Gold- 05-13-2024 corporate presentation
TriStar Gold- 05-13-2024 corporate presentation
Adnet Communications
 

Recently uploaded (20)

STRATEGIC MANAGEMENT VIETTEL TELECOM GROUP
STRATEGIC MANAGEMENT VIETTEL TELECOM GROUPSTRATEGIC MANAGEMENT VIETTEL TELECOM GROUP
STRATEGIC MANAGEMENT VIETTEL TELECOM GROUP
 
Big developments in Lesotho Butha-Buthe.
Big developments in Lesotho Butha-Buthe.Big developments in Lesotho Butha-Buthe.
Big developments in Lesotho Butha-Buthe.
 
Prezentacja Q1 2024 EN strona www relacji
Prezentacja Q1 2024  EN strona www relacjiPrezentacja Q1 2024  EN strona www relacji
Prezentacja Q1 2024 EN strona www relacji
 
State Space Tutorial.pptxjjjjjjjjjjjjjjj
State Space Tutorial.pptxjjjjjjjjjjjjjjjState Space Tutorial.pptxjjjjjjjjjjjjjjj
State Space Tutorial.pptxjjjjjjjjjjjjjjj
 
ASSESSING HRM EFFECTIVENESS AND PERFORMANCE ENHANCEMENT MEASURES IN THE BANKI...
ASSESSING HRM EFFECTIVENESS AND PERFORMANCE ENHANCEMENT MEASURES IN THE BANKI...ASSESSING HRM EFFECTIVENESS AND PERFORMANCE ENHANCEMENT MEASURES IN THE BANKI...
ASSESSING HRM EFFECTIVENESS AND PERFORMANCE ENHANCEMENT MEASURES IN THE BANKI...
 
Satoshi DEX Leverages Layer 2 To Transform DeFi Ecosystem.pdf
Satoshi DEX Leverages Layer 2 To Transform DeFi Ecosystem.pdfSatoshi DEX Leverages Layer 2 To Transform DeFi Ecosystem.pdf
Satoshi DEX Leverages Layer 2 To Transform DeFi Ecosystem.pdf
 
ACC311_Corporate Income Taxation in the Philippines
ACC311_Corporate Income Taxation  in the PhilippinesACC311_Corporate Income Taxation  in the Philippines
ACC311_Corporate Income Taxation in the Philippines
 
Economics - Development 01 _ Handwritten Notes.pdf
Economics - Development 01 _ Handwritten Notes.pdfEconomics - Development 01 _ Handwritten Notes.pdf
Economics - Development 01 _ Handwritten Notes.pdf
 
Diversification in Investment Portfolio.pdf
Diversification in Investment Portfolio.pdfDiversification in Investment Portfolio.pdf
Diversification in Investment Portfolio.pdf
 
一比一原版(Caltech毕业证书)加州理工学院毕业证成绩单学位证书
一比一原版(Caltech毕业证书)加州理工学院毕业证成绩单学位证书一比一原版(Caltech毕业证书)加州理工学院毕业证成绩单学位证书
一比一原版(Caltech毕业证书)加州理工学院毕业证成绩单学位证书
 
Retail sector trends for 2024 | European Business Review
Retail sector trends for 2024  | European Business ReviewRetail sector trends for 2024  | European Business Review
Retail sector trends for 2024 | European Business Review
 
1. Elemental Economics - Introduction to mining
1. Elemental Economics - Introduction to mining1. Elemental Economics - Introduction to mining
1. Elemental Economics - Introduction to mining
 
How to exchange my pi coins on HTX in 2024
How to exchange my pi coins on HTX in 2024How to exchange my pi coins on HTX in 2024
How to exchange my pi coins on HTX in 2024
 
一比一原版(UCSD毕业证书)加利福尼亚大学圣迭戈分校毕业证成绩单学位证书
一比一原版(UCSD毕业证书)加利福尼亚大学圣迭戈分校毕业证成绩单学位证书一比一原版(UCSD毕业证书)加利福尼亚大学圣迭戈分校毕业证成绩单学位证书
一比一原版(UCSD毕业证书)加利福尼亚大学圣迭戈分校毕业证成绩单学位证书
 
一比一原版(SFU毕业证书)西蒙菲莎大学毕业证成绩单学位证书
一比一原版(SFU毕业证书)西蒙菲莎大学毕业证成绩单学位证书一比一原版(SFU毕业证书)西蒙菲莎大学毕业证成绩单学位证书
一比一原版(SFU毕业证书)西蒙菲莎大学毕业证成绩单学位证书
 
project ratio analysis of bcom studies .
project ratio analysis of bcom studies .project ratio analysis of bcom studies .
project ratio analysis of bcom studies .
 
Bahawalpur Culture.pptx pptx pptx pttx pttx
Bahawalpur Culture.pptx pptx pptx pttx pttxBahawalpur Culture.pptx pptx pptx pttx pttx
Bahawalpur Culture.pptx pptx pptx pttx pttx
 
DIGITAL COMMERCE SHAPE VIETNAMESE SHOPPING HABIT IN 4.0 INDUSTRY
DIGITAL COMMERCE SHAPE VIETNAMESE SHOPPING HABIT IN 4.0 INDUSTRYDIGITAL COMMERCE SHAPE VIETNAMESE SHOPPING HABIT IN 4.0 INDUSTRY
DIGITAL COMMERCE SHAPE VIETNAMESE SHOPPING HABIT IN 4.0 INDUSTRY
 
一比一原版(Caltech毕业证书)加利福尼亚理工学院毕业证成绩单学位证书
一比一原版(Caltech毕业证书)加利福尼亚理工学院毕业证成绩单学位证书一比一原版(Caltech毕业证书)加利福尼亚理工学院毕业证成绩单学位证书
一比一原版(Caltech毕业证书)加利福尼亚理工学院毕业证成绩单学位证书
 
TriStar Gold- 05-13-2024 corporate presentation
TriStar Gold- 05-13-2024 corporate presentationTriStar Gold- 05-13-2024 corporate presentation
TriStar Gold- 05-13-2024 corporate presentation
 

Trading Engine/Robo-Advisor using Deep Reinforcement Learning

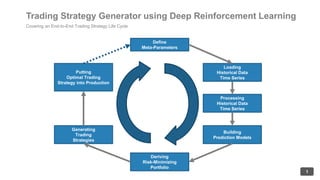
  • 1. Trading Strategy Generator using Deep Reinforcement Learning Covering an End-to-End Trading Strategy Life Cycle 1 Define Meta-Parameters Loading Historical Data Time Series Processing Historical Data Time Series Building Prediction Models Deriving Risk-Minimizing Portfolio Generating Trading Strategies Putting Optimal Trading Strategy into Production
  • 2. Trading Strategy Generator Putting Optimal Trading Strategy into Production 2… 1 2 3 4 5 9 10 10 6 7 8 11 12 13 14
  • 3. Trading Strategy Generator Generating Trading Strategies using Deep Reinforcement Learning 3 • As an example, the goal is to generate an equity-based portfolio for the FTSE100, by detecting and executing optimized asset selection and allocation strategies. • Engine is putting an ‘end-of-day’ trading strategy into production by initializing a portfolio at 14/9/2016 and rebalancing it if needed in the 5 trading days to come implying a weekly realignment if necessary. • By performing extensive ‘paper trading’, using Machine Learning (ML), the engine concludes to combine a portfolio based on a ML-based trading strategy (Wijnen) with a portfolio based on MPT (Markowitz – Modern Portfolio Theory) allocating weights to the two strategies of 62.8% and 37.2% respectively. By performing ML, the engine picks following components of the FTSE100 to be part of the portfolio and also determines the number of components to pick (5): POLY, SGE, RB, CPG and FRES to be traded in Pound Sterling (GBP). • The table with labels ‘Prices at’, ‘Prediction at +1’ and ‘Prediction at’ show actual prices (open) and predicted prices (close) for each of the shares selected. ‘Prediction at’ is a prediction of closing price for same trading day, while ‘Prediction at +1’ is our estimate of next day’s closing price. Prices are given for a ‘bundle of a given asset, e.g. 100 shares instead of 1’ in order to have a way of comparing the pricing of the different assets. • The engine examines both ‘The tendency to go Long’ and ‘The tendency to go Short’ and expresses the results as a long and short position for each of the assets respectively (E.g. for POLY go long for 840 shares, go short for 1936 shares.). Finally the ‘netted position’ is determined (E.g. for POLY S1096, where S = Short vs. L = Long and 1096 the number of shares to go short.). 1 2 3 4
  • 4. Trading Strategy Generator Generating Trading Strategies using Deep Reinforcement Learning 4 • The next trading day (15/9/2019) actual prices are retrieved and predictions generated. • At 15/9/2019, the portfolio can be/is rebalanced based on market behavior: Rebalancing is analyzed for ‘going long’ and ‘going short’ simultaneously (E.g. for POLY the tendency is to increase the long position by 47 and the short position by 108, resulting in a netted tendency to go short by 61 shares.). • The engine keeps track of actual cumulative ‘Profit and Loss’ (P&L), and worst and best results in terms of cumulative P&L thus far. This info is used in order to determine whether or not to liquidate the portfolio. • The engine rebalances the portfolio for 16/9/2019. Every trading day the engine evaluates whether to rebalance or liquidate the portfolio. • Graph showing the cumulative P&L over time (in trading days) for the strategy that has been put into production. • The part of the graph to the left of the ‘red dashed line’ shows the ‘learning’ being done by the engine. The ‘red dashed line’ shows when the strategy was first put into ‘production’. So, the to the right, actual trading results are shown. • As the trading strategy above seems to become less profitable after a given moment in time, we decide to switch to a new trading strategy. • Graph showing the amount of cash needed to execute the strategy (Positive values reflect cash consumption while going long, negative values reflect cash impact going short.) over time. • Graph showing the ‘Long Ratio’, which expresses the estimated probability that the market will go long (So 0 implies 100% short, 1 reflects 100% long.). • Graph showing the profitability of the strategy as a % per annum (E.g. 0.30 implies 30% return over the year.). ADDED VALUE FOR ASSET MANAGERS: => More accurate estimates of future expected returns and asset pricing (How: Other pptx). => Powerful ML-driven trading engine/portfolio optimization exploiting this increase in accuracy by creating trading strategies in real-time reflecting current changes in market behavior and thus allow for significantly ‘outperforming the market’. 5 6 7 8 9