
Recommended
More Related Content
What's hot
What's hot (20)
Viewers also liked
Viewers also liked (20)
Similar to Lista de puntos y medidas de tendencia central y dispersión
Similar to Lista de puntos y medidas de tendencia central y dispersión (20)
More from Kike Palacio
More from Kike Palacio (16)
Recently uploaded
Recently uploaded (20)
Lista de puntos y medidas de tendencia central y dispersión
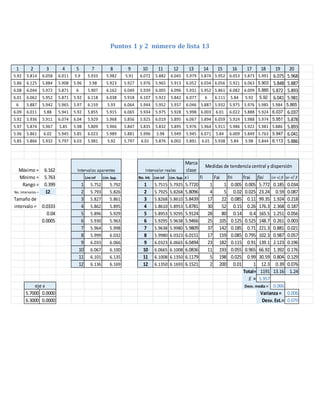
- 1. Puntos 1 y 2 número de lista 13 1 2 3 4 5 7 8 9 10 11 12 13 14 15 16 17 18 19 20 5.92 5.814 6.058 6.011 5.9 5.933 5.982 5.91 6.072 5.882 6.045 5.979 5.874 5.952 6.053 5.873 5.991 6.075 5.968 5.86 6.125 5.884 5.908 5.96 5.98 5.923 5.927 5.976 5.965 5.913 6.052 6.034 6.056 5.921 6.063 5.903 5.848 5.887 6.08 6.044 5.972 5.871 6 5.907 6.162 6.049 5.939 6.005 6.096 5.931 5.952 5.861 6.082 6.009 5.885 5.872 5.893 6.01 6.062 5.952 5.871 5.92 6.118 6.038 5.918 6.107 5.922 5.842 6.077 6 6.111 5.84 5.92 5.92 6.041 5.981 6 5.887 5.942 5.965 5.97 6.159 5.93 6.064 5.944 5.952 5.937 6.046 5.887 5.932 5.975 5.976 5.985 5.984 5.865 6.09 6.011 5.88 5.941 5.92 5.855 5.915 6.065 5.934 5.975 5.928 5.998 6.003 6.01 6.022 5.888 5.924 6.037 6.037 5.92 5.936 5.911 6.074 6.04 5.929 5.968 5.856 5.925 6.019 5.895 6.067 5.894 6.059 5.924 5.988 5.974 5.951 5.878 5.97 5.874 5.967 5.85 5.98 5.809 5.966 5.847 5.835 5.832 5.895 5.976 5.964 5.911 5.986 5.922 5.981 5.886 5.893 5.96 5.861 6.02 5.945 5.85 6.023 5.989 5.881 5.996 5.98 5.949 5.945 6.071 5.84 6.009 5.849 5.763 5.947 6.041 5.85 5.866 5.932 5.797 6.03 5.981 5.92 5.797 6.01 5.876 6.002 5.891 6.01 5.938 5.84 5.98 5.844 6.113 5.886 6.162 Marca clase 5.763 Lim inf Lim. Sup. No. Int. Lim inf Lim. Sup. x i fi Fai fri frai fixi |xi-x| fi (xi-x)2 fi 0.399 1 5.752 5.792 1 5.7515 5.7925 5.7720 1 1 0.005 0.005 5.772 0.185 0.034 12 2 5.793 5.826 2 5.7925 5.8268 5.8096 4 5 0.02 0.025 23.24 0.59 0.087 3 5.827 5.861 3 5.8268 5.8610 5.8439 17 22 0.085 0.11 99.35 1.924 0.218 0.0333 4 5.862 5.895 4 5.8610 5.8953 5.8781 30 52 0.15 0.26 176.3 2.368 0.187 0.04 5 5.896 5.929 5 5.8953 5.9295 5.9124 28 80 0.14 0.4 165.5 1.251 0.056 0.0005 6 5.930 5.963 6 5.9295 5.9638 5.9466 25 105 0.125 0.525 148.7 0.261 0.003 7 5.964 5.998 7 5.9638 5.9980 5.9809 37 142 0.185 0.71 221.3 0.881 0.021 8 5.999 6.032 8 5.9980 6.0323 6.0151 17 159 0.085 0.795 102.3 0.987 0.057 9 6.033 6.066 9 6.0323 6.0665 6.0494 23 182 0.115 0.91 139.1 2.123 0.196 10 6.067 6.100 10 6.0665 6.1008 6.0836 11 193 0.055 0.965 66.92 1.392 0.176 11 6.101 6.135 11 6.1008 6.1350 6.1179 5 198 0.025 0.99 30.59 0.804 0.129 12 6.136 6.169 12 6.1350 6.1693 6.1521 2 200 0.01 1 12.3 0.39 0.076 Total= 1191 13.16 1.24 = 5.957 0.066 5.7000 0.0000 0.006 6.3000 0.0000 0.079 eje x Intervalos aparentes No. Intervalos = Tamaño de intervalo = Desv. media = Varianza = Desv. Est.= Rango = Máximo = Intervalor reales Medidas de tendencia central y dispersión Mínimo =
- 2. Moda x y x y x y x y x y x y x y x y 5.721 0 5.800 0 5.878 0 5.957 0 6.036 0 6.115 0 6.19 0 5.95 0 5.721 40.0 5.800 40.0 5.878 40.0 5.957 40.0 6.036 40.0 6.115 40.0 6.19 40.0 5.95 40.0 x y 5.7515 0 5.7515 1 5.7925 1 5.7925 0 5.7925 4 5.8268 4 5.8268 0 5.8268 17 5.8610 17 5.8610 0 5.8610 30 5.8953 30 5.8953 0 5.8953 28 5.9295 28 5.9295 0 5.9295 25 5.9638 25 5.9638 0 5.9638 37 Cpk Minimo (M - LCL) , (UCL - M) Cpk= 1.0 , 1.00 5.9980 37 3 Desv. Est. 3 Desv. Est. 5.9980 0 5.9980 17 6.0323 17 Cp= UCL - ULC Cp = 1.00 6.0323 0 6.0323 23 6Desv Est. 6.0665 23 6.0665 0 6.0665 11 6.1008 11 CpI= (M- LCL) 6.1008 0 3Desv. Est. Cpl= 1.00 6.1008 5 6.1350 5 6.1350 0 6.1350 2 Cps= (UCL- M) 6.1693 2 3Desv. Est. Cps= 1 6.1693 0 Histograma Conclusión: El proceso se consideracomo dentro de las especificaciones, solo que debe estarbajo un control estricto, yaque el cp podríasermenorauno, entonces el proceso no estaríacumpliendo considerablemente las espesificaciones. Es bueno saberque lamayoriade las muestras de ph se encuentran dentro del rango espesificado. -2s -1s- + 1s + 2s-3s + 3s 0 5 10 15 20 25 30 35 40 45 5.7000 5.7500 5.8000 5.8500 5.9000 5.9500 6.0000 6.0500 6.1000 6.1500 6.2000 6.2500 6.3000 + 3s
- 3. x x y x y x y x y x y x y 5.888 5.88779396 0 5.951 0 6.01506734 0 6.07870403 0 6.14234072 0 5.824 0 5.888 5.88779396 40.0 5.951 40.0 6.01506734 40.0 6.07870403 40.0 6.14234072 40.0 5.824 40.0 x y 6.21 0 6.21 40.0 Moda x y 6.01 0 6.01 40.0 -2s -1s- + 1s + 2s -3s + 3s 0 5 10 15 20 25 30 35 40 45 5.7000 5.7500 5.8000 5.8500 5.9000 5.9500 6.0000 6.0500 6.1000 6.1500 6.2000 6.2500 6.3000 + 3s Punto 3 1 2 3 4 5 6 7 8 9 10 11 12 13 14 15 16 17 18 19 20 5.922 6.01 6.058 6.011 5.898 5.972 5.933 6.01 6.02 6.072 6.03 6.01 6.01 6.01 6.01 6.053 6.01 6.01 6.075 6.01 6.01 6.125 6.01 5.908 5.963 6.042 5.98 6.01 6.03 6.01 6.03 6.01 6.052 6.02 6.02 6.03 6.063 6.01 6.01 6.01 6.083 6.044 5.972 6.01 6 5.973 5.907 6.162 6.049 6.01 6.005 6.096 6.01 5.952 5.861 6.082 6.009 6.01 6.02 6.01 6.007 6.062 5.952 5.871 5.915 5.887 6.118 6.038 6.01 6.01 6.01 6.01 6.015 6.5 6.111 5.84 6.01 6.01 6.041 6.01 6.01 6.03 5.942 5.965 5.966 6.042 6.159 6.01 6.064 6.01 6.01 6.01 6.046 6.01 6.01 5.975 5.976 6.01 6.01 6.01 6.085 6.011 6.01 5.941 5.924 6.01 5.855 6.01 6.065 6.01 6.1 6.01 6.01 6.01 6.01 6.022 6.01 6.01 6.037 6.01 6.01 5.936 5.911 6.074 6.035 6.01 5.929 6.01 6.01 6.01 6.019 6.01 6.067 6.2 6.059 6.01 6.01 6.01 6.01 6.01 5.965 6.01 5.967 6.01 5.983 6.01 5.809 6.01 6.01 6.01 6.01 6.01 6.01 6.01 6 5.8 5.8 6 5.89 6.01 6.01 6.01 6.02 6.01 5.85 6.095 6.023 6.01 6.01 6.01 6 6.01 6.01 6.199 6.5 6.009 6.001 6.01 6.01 6.01 6.01 6.01 5.932 5.797 6.034 5.947 5.981 6.01 6.01 6.01 5.876 6.002 5.899 6.01 5.99 6.01 5.9 6.02 6.02 6.01 6.500 Marcaclase 5.797 No.Int. Liminf Lim.Sup. No.Int. Liminf Lim.Sup. xi fi Fai fri frai fixi |xi-x|fi (xi-x)2 fi 0.703 1 5.786 5.826 1 5.7855 5.8265 5.8060 4 4 0.02020202 0.02020202 23.224 0.83626936 0.17483661 12 2 5.827 5.886 2 5.8265 5.8861 5.8563 6 10 0.03030303 0.05050505 35.13775 0.95265404 0.15125829 3 5.887 5.945 3 5.8861 5.9457 5.9159 17 27 0.08585859 0.13636364 100.569875 1.68626978 0.16726505 0.05858333 4 5.946 6.005 4 5.9457 6.0053 5.9755 24 51 0.12121212 0.25757576 143.411 0.95061616 0.03765296 0.04 5 6.006 6.064 5 6.0053 6.0648 6.0350 129 180 0.65151515 0.90909091 778.520375 2.57668813 0.05146761 0.0005 6 6.065 6.124 6 6.0648 6.1244 6.0946 13 193 0.06565657 0.97474747 79.230125 1.03424958 0.08228248 7 6.125 6.184 7 6.1244 6.1840 6.1542 3 196 0.01515152 0.98989899 18.462625 0.41742298 0.05808065 8 6.185 6.243 8 6.1840 6.2436 6.2138 2 198 0.01010101 1 12.4275833 0.39744865 0.07898272 9 6.244 6.303 9 6.2436 6.3032 6.2734 0 198 0 1 0 0 0 10 6.304 6.362 10 6.3032 6.3628 6.3330 0 198 0 1 0 0 0 11 6.363 6.422 11 6.3628 6.4223 6.3925 0 198 0 1 0 0 0 12 6.423 6.481 12 6.4223 6.4819 6.4521 0 198 0 1 0 0 0 Total= 1190.98333 8.85161869 0.80182636 = 6.01506734 0.04470514 5.7000 0.0000 0.00404963 6.3000 0.0000 0.06363669 No.Intervalos = Tamañodeintervalo= ejex Desv.media = Varianza= Desv.Est.= Máximo= Intervalos aparentes Intervalor reales Medidasdetendenciacentralydispersión Mínimo= Rango=
- 4. 0 5 10 15 20 25 30 35 40 45 5.7000 5.7500 5.8000 5.8500 5.9000 5.9500 6.0000 6.0500 6.1000 6.1500 6.2000 6.2500 6.3000 x y 5.7855 0 5.7855 4 5.8265 4 5.8265 0 5.8265 6 5.8861 6 5.8861 0 5.8861 17 5.9457 17 5.9457 0 5.9457 24 6.0053 24 6.0053 0 6.0053 129 6.0648 129 6.0648 0 6.0648 13 6.1244 13 6.1244 0 6.1244 3 6.1840 3 6.1840 0 6.1840 2 6.2436 2 6.2436 0 6.2436 0 6.3032 0 6.3032 0 6.3032 0 6.3628 0 6.3628 0 6.3628 0 6.4223 0 6.4223 0 6.4223 0 6.4819 2 6.4819 0 Histograma
- 5. Cpk Minimo (M- LCL) , (UCL- M) Cpk= 1.00 , 1.00 3Desv.Est. 3Desv.Est. Cp= UCL - ULC Cp= 1.00 6DesvEst. CpI= (M-LCL) 3Desv.Est. Cpl= 1.00 Cps= (UCL-M) 3Desv.Est. Cps= 1.00 Conclusión:almodificaralgunasmilesimas,esposiblepercatarsefacilmemntequeelhistogramacambio positivamente,yaqueunmayornúmerodemuestrasseencuentrancercanosalamedialocualesbastante conveniente. Elcpyelcpk,semantubieroniguales.