1. Aramit Cement Company Ltd.
The company & its operation:
The Company Was incorporated on 19 August 1995 as a Public Company limited by shares
under the Companies Act 1994 and has been allowed to company running the business from the
foregoing date under Section 150(2) of the said Act. The principal activities of the company as
stipulated to he, are manufacturing of 'Portland' cement and allied products and marketing
thereof. Shares and debentures of the Company were listed with Chittagong Stock Exchange
(CSFi) on 9 September 1998 and with Dhaka Stock Exchange (DSE) on 16 September 1998. The
commercial production of the factory commenced on 10 November 1999.
Ratio Analysis Aramit Cement Company Ltd:
(A).Liquidity Ratio Analysis:
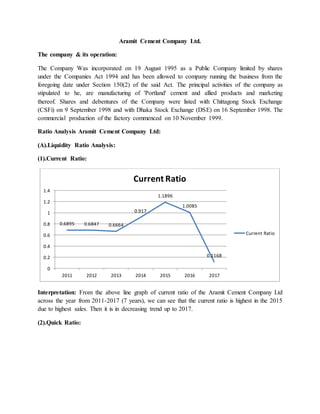
(1).Current Ratio:
Interpretation: From the above line graph of current ratio of the Aramit Cement Company Ltd
across the year from 2011-2017 (7 years), we can see that the current ratio is highest in the 2015
due to highest sales. Then it is in decreasing trend up to 2017.
(2).Quick Ratio:
0.6895 0.6847 0.6664
0.917
1.1896
1.0085
0.1168
0
0.2
0.4
0.6
0.8
1
1.2
1.4
2011 2012 2013 2014 2015 2016 2017
Current Ratio
Current Ratio
2. Interpretation: From the above line graph of quick ratio of the Aramit Cement Company Ltd
across the year from 2011-2017 (7 years), we can see that the quick ratio is highest in the 2015
due to highest sales. It is increasing trend from the 2011-2015 and then it is in decreasing trend
from 2016-2017.
(B). Solvency Ratios:
(1). Debt to Equity Ratio:
Interpretation: From the above line graph of debt to equity ratio of the Aramit Cement
Company Ltd across the year from 2011-2017 (7 years), we can see that the debt relative to the
0.4168 0.413
0.4496
0.5295
0.7364
0.6962
-0.1219
-0.2
-0.1
0
0.1
0.2
0.3
0.4
0.5
0.6
0.7
0.8
2011 2012 2013 2014 2015 2016 2017
Qick Ratio
Qick Ratio
6.0312
4.7743
5.6726
2.5621
3.2591
4.3507
7.8592
0
1
2
3
4
5
6
7
8
9
2011 2012 2013 2014 2015 2016 2017
Debt to Equity Ratio
Debt to equity
ratio
3. equity is lowest in the 2014. It is increasing trend from the 2014-2017 due to finance the current
asset and expansions.
(2).Equity Ratio:
Interpretation: From the above line graph of equity ratio of the Aramit Cement Company Ltd
across the year from 2011-2017 (7 years), we can see that equity ratio is highest in the 2014. It is
decreasing trend from the 2014-2017 due to the increasing loan to finance the current asset and
expansions.
(C). Profitability Analysis:
(1).Gross Profit Margin:
0.1422
0.178
0.1457
0.2806
0.2347
0.1868
0.1128
0
0.05
0.1
0.15
0.2
0.25
0.3
2011 2012 2013 2014 2015 2016 2017
Equity Ratio
Equity
Ratio
4. Interpretation: From the above line graph of gross margin of the Aramit Cement Company Ltd
across the year from 2011-2017 (7 years), we can see that, the gross margin is increasing from
2012-2015 due to the increasing sales. It is decreasing trend from the 2015-2017.
(2).Net Profit Margin:
Interpretation: From the above line graph of net profit margin of the Aramit Cement Company
Ltd across the year from 2011-2017 (7 years), we can see that the net profit margin is highest in
2015 due to highest sales. It is decreasing trend from the 2014-2016 and then it is lowest in
2016due to high financing cost, material cost and consultation effect etc.
21%
19%
22%
24%
27%
25%
20%
0%
5%
10%
15%
20%
25%
30%
2011 2012 2013 2014 2015 2016 2017
Gross Profit Margin
Gross Profit Margin
5%
5% 5%
15%
11%
2%
6%
0%
2%
4%
6%
8%
10%
12%
14%
16%
2011 2012 2013 2014 2015 2016 2017
Net Profit Margin
Net Profit Margin
5. (D).Activity Ratio Analysis:
(1). Inventory Turnover:
Interpretation: From the above line graph of inventory turnover of the Aramit Cement
Company Ltd across the year from 2011-2017 (7 years), we can see that the inventory turnover is
lowest in the 2014 due to the high materials stock. It is increasing trend from the 2015-2017.
(2).Accounts Receivables Turnover:
Interpretation: From the above line graph of accounts receivables turnover of the Aramit
Cement Company Ltd across the year from 2011-2017 (7 years), we can see that the account
6.2444
6.7418
5.8366
3.9453
4.6086
10.1911
12.3423
0
2
4
6
8
10
12
14
2011 2012 2013 2014 2015 2016 2017
Inventory Turnover
Invent
ory
Turno
ver
4.8925
3.96
2.9161
1.9662 2.0353
2.2833
1.3498
0
1
2
3
4
5
6
2011 2012 2013 2014 2015 2016 2017
Accounts Receivable Turnover
Accounts Receivable
Turnover
6. receivables turnover is in decreasing trend from 2011-2017 except 2015 and 2016. It indicates
the inefficiency of the current asset management.
(3).Accounts Payable Turnover:
Interpretation: From the above line graph of accounts payables turnover of the Aramit Cement
Company Ltd across the year from 2011-2017 (7 years), we can see that the account payables
turnover is in increasing trend 2011-2016 except 2013 and 2014. It indicates the inefficiency of
the current asset management.
(4).Total Asset Turnover:
3.5617
2.286
1.5069 1.3842
3.0739
7.2639
5.9367
0
1
2
3
4
5
6
7
8
2011 2012 2013 2014 2015 2016 2017
Accounts Payable Turnover
Accou
nts
Payabl
e
Turno
ver
0.8663
0.131 0.1017
0.3328
0.42845
0.7047
0.5241
0
0.1
0.2
0.3
0.4
0.5
0.6
0.7
0.8
0.9
1
2011 2012 2013 2014 2015 2016 2017
Total AssetTurnover
Total
Asset
Turn
over
7. Interpretation: From the above line graph of total asset turnover of the Aramit Cement
Company Ltd across the year from 2011-2017 (7 years), we can see that the total asset turnover
is in increasing trend 2013-2017 except 2017 due to asset utilization to support the sales growth.
It indicates the efficiency of the asset management.
(E).Other Important Ratio Analysis:
(1).Operating Cycle:
Interpretation: From the above line graph of operating cycle of the Aramit Cement Company
Ltd across the year from 2011-2017 (7 years), we can see that the operating cycle is in increasing
trend 2011-2017 except 2016 due to the low accounts receivables turnover. It indicates the
operating inefficiency of the current asset management.
(2). Cash Conversion Cycle:
131.2328
144.3049
185.1311
274.3346
254.9894
192.9898
295.8595
0
50
100
150
200
250
300
350
2011 2012 2013 2014 2015 2016 2017
Operating Cycle
Opera
ting
Cycle
8. Interpretation: From the above line graph of operating cycle of the Aramit Cement Company
Ltd across the year from 2011-2017 (7 years), we can see that the cash conversion cycle is in
increasing trend 2011-2017 except 2012 and 2013 due to the low accounts receivables turnover
and high payment deferred period. It indicates the inefficiency of the cash asset management.
(3). Liquidity Position:
Interpretation: From the above line graph of liquidity position of the Aramit Cement Company
Ltd across the year from 2011-2017 (7 years), we can see that the liquidity position of 7 years are
around 50% except 2012 and 2017. It indicates the inefficiency of the current asset management.
30.1576
-13.1738
-53.757
14.2692
137.8753 143.4291
235.2197
-100
-50
0
50
100
150
200
250
2011 2012 2013 2014 2015 2016 2017
Cash Conversion Cycle
Cash
Convers
ion
Cycle
0.562
0.0567
0.5436
0.4816
0.6827
0.6224
0.0847
0
0.1
0.2
0.3
0.4
0.5
0.6
0.7
0.8
2011 2012 2013 2014 2015 2016 2017
Liquidity Position (CA/TA)
Liqui
dity
Posit
ion
(CA/
TA)
9. (4).Profitability:
Interpretation: From the above line graph of profitability of the Aramit Cement Company Ltd
across the year from 2011-2017 (7 years), we can see that the profitability is highest in 2013 due
to highest sales. It is decreasing trend from the 2013-2017 and then it is lowest in 2017due to
high financing cost, material cost and consultation effect etc.
(5).Operating Efficiency:
0.0012 0.0023
0.0499
0.0348
0.0309
0.0138
-0.0213
-0.03
-0.02
-0.01
0
0.01
0.02
0.03
0.04
0.05
0.06
2011 2012 2013 2014 2015 2016 2017
Profitability
Profitability
0.1083
0.0113
0.0974
0.0473
0.0892
0.1076
0.0509
0
0.02
0.04
0.06
0.08
0.1
0.12
2011 2012 2013 2014 2015 2016 2017
Operating Efficiency
Oper
ating
Effici
ency
10. Interpretation: From the above line graph of operating efficiency of the Aramit Cement
Company Ltd across the year from 2011-2017 (7 years), we can see that the operating efficiency
is highest in 2011. It is haphazardly increasing and decreasing from the 2011-2017 which
indicates the riskiness of operational management.
(5). Market Confidence:
Interpretation: From the above line graph of market confidence of the Aramit Cement
Company Ltd across the year from 2011-2017 (7 years), we can see that the market confidence is
highest in 2014 due to the high growth potential. It is decreasing trend from the 2014-2017 and
then it is lowest in 2011due to low potentiality.
(6).Return on Equity (ROE):
0.1406
0.1291
0.1291
0.2519
0.2048
0.1604
0.114
0
0.05
0.1
0.15
0.2
0.25
0.3
2011 2012 2013 2014 2015 2016 2017
Market Confidence
Mark
et
Confi
denc
e
11. Interpretation: From the above line graph of ROE of the Aramit Cement Company Ltd across
the year from 2011-2017 (7 years), we can see that the ROE is highest in 2017. It is decreasing
trend from the 2011-2016 and then it is lowest in 2016due to high financing cost, material cost
and consultation effect etc.
28
19 19
18 18
6
27
0
5
10
15
20
25
30
2011 2012 2013 2014 2015 2016 2017
ROE (%)
ROE (%)