Keynote technicals intraday future levels
•
0 likes•156 views

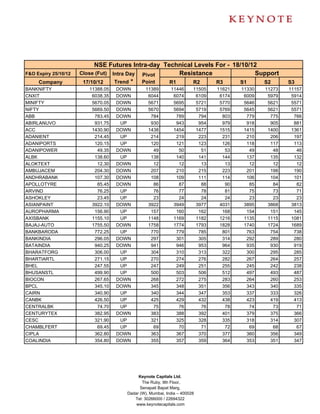
The document provides intra-day technical levels for various stocks trading on the National Stock Exchange of India. It lists the previous day's closing price and trend for each stock, and identifies pivot points as well as resistance and support levels. The levels are intended to help traders identify potential high and low prices for stocks over the course of the trading day.

Recommended
Recommended
More Related Content
What's hot
What's hot (19)
Viewers also liked
Viewers also liked (17)
Similar to Keynote technicals intraday future levels
Similar to Keynote technicals intraday future levels (10)
More from Keynote Capitals Ltd.
More from Keynote Capitals Ltd. (20)
Recently uploaded
Recently uploaded (20)
Keynote technicals intraday future levels
- 1. NSE Futures Intra-day Technical Levels For - 18/10/12 F&O Expiry 25/10/12 Close (Fut) Intra Day Pivot Resistance Support Company 17/10/12 Trend * Point R1 R2 R3 S1 S2 S3 BANKNIFTY 11388.05 DOWN 11389 11446 11505 11621 11330 11273 11157 CNXIT 6038.35 DOWN 6044 6074 6109 6174 6009 5979 5914 MINIFTY 5670.05 DOWN 5671 5695 5721 5770 5646 5621 5571 NIFTY 5669.50 DOWN 5670 5694 5719 5769 5645 5621 5571 ABB 783.45 DOWN 784 789 794 803 779 775 766 ABIRLANUVO 931.75 UP 930 943 954 979 918 905 881 ACC 1430.90 DOWN 1438 1454 1477 1515 1415 1400 1361 ADANIENT 214.45 UP 214 219 223 231 210 206 197 ADANIPORTS 120.15 UP 120 121 123 126 118 117 113 ADANIPOWER 49.35 DOWN 49 50 51 53 49 48 46 ALBK 138.60 UP 138 140 141 144 137 135 132 ALOKTEXT 12.30 DOWN 12 12 13 13 12 12 12 AMBUJACEM 204.30 DOWN 207 210 215 223 201 198 190 ANDHRABANK 107.30 DOWN 108 109 111 114 106 104 101 APOLLOTYRE 85.45 DOWN 86 87 88 90 85 84 82 ARVIND 76.25 UP 76 77 78 81 75 73 71 ASHOKLEY 23.45 UP 23 24 24 24 23 23 23 ASIANPAINT 3922.10 DOWN 3922 3949 3977 4031 3895 3868 3813 AUROPHARMA 156.90 UP 157 160 162 168 154 151 145 AXISBANK 1155.10 UP 1148 1169 1182 1216 1135 1115 1081 BAJAJ-AUTO 1755.50 DOWN 1758 1774 1793 1828 1740 1724 1689 BANKBARODA 772.25 UP 770 779 785 801 763 754 738 BANKINDIA 296.05 DOWN 297 301 305 314 292 289 280 BATAINDIA 940.25 DOWN 941 946 953 964 935 930 919 BHARATFORG 306.00 UP 304 310 313 322 300 295 285 BHARTIARTL 271.15 UP 270 274 276 282 267 264 257 BHEL 247.55 UP 247 249 251 255 245 242 238 BHUSANSTL 499.90 UP 500 503 506 512 497 493 487 BIOCON 267.65 DOWN 268 272 275 283 264 260 253 BPCL 345.10 DOWN 345 348 351 356 343 340 335 CAIRN 340.90 UP 340 344 347 353 337 333 326 CANBK 426.50 UP 425 429 432 438 423 419 413 CENTRALBK 74.70 UP 75 76 76 78 74 73 71 CENTURYTEX 382.95 DOWN 383 388 392 401 379 375 366 CESC 321.90 UP 321 325 328 335 318 314 307 CHAMBLFERT 69.45 UP 69 70 71 72 69 68 67 CIPLA 362.80 DOWN 363 367 370 377 360 356 349 COALINDIA 354.80 DOWN 355 357 359 364 353 351 347 Keynote Capitals Ltd. The Ruby, 9th Floor, Senapati Bapat Marg, Dadar (W), Mumbai, India – 400028 Tel: 30266000 / 22694322 www.keynotecapitals.com
- 2. NSE Futures Intra-day Technical Levels For - 18/10/12 F&O Expiry 25/10/12 Close (Fut) Intra Day Pivot Resistance Support Company 17/10/12 Trend * Point R1 R2 R3 S1 S2 S3 COLPAL 1238.30 DOWN 1239 1244 1249 1260 1233 1228 1218 CROMPGREAV 130.45 DOWN 131 134 138 145 127 123 116 DABUR 132.65 DOWN 134 135 138 142 131 130 126 DENABANK 107.00 DOWN 107 109 111 114 105 104 100 DISHTV 80.70 UP 80 82 84 89 78 75 70 DIVISLAB 1132.10 DOWN 1133 1142 1152 1171 1123 1114 1095 DLF 202.05 DOWN 205 209 215 226 198 194 183 DRREDDY 1696.05 DOWN 1697 1708 1721 1745 1684 1673 1649 EXIDEIND 159.40 UP 159 161 162 165 158 156 153 FEDERALBNK 471.70 UP 470 476 480 490 466 460 450 FINANTECH 996.45 DOWN 999 1014 1032 1066 981 966 932 GAIL 372.55 DOWN 375 378 384 394 369 365 356 GMRINFRA 22.45 UP 22 23 23 25 22 21 20 GODREJIND 289.85 UP 288 293 296 304 285 280 272 GRASIM 3505.10 UP 3501 3523 3540 3580 3483 3461 3422 GSPL 81.60 DOWN 82 83 84 85 81 80 79 GUJFLUORO 352.70 DOWN 354 358 364 373 349 345 336 GVKPIL 13.40 DOWN 14 14 14 15 13 13 12 HAVELLS 642.80 DOWN 645 655 666 688 633 623 602 HCLTECH 576.80 DOWN 584 594 612 640 566 556 528 HDFC 754.15 UP 751 758 761 771 748 741 731 HDFCBANK 629.00 DOWN 629 631 634 638 627 625 621 HDIL 102.20 UP 102 104 106 109 100 98 95 HEROMOTOCO 1804.65 UP 1797 1818 1832 1867 1783 1762 1727 HEXAWARE 111.40 DOWN 112 114 117 121 109 108 103 HINDALCO 117.10 DOWN 117 118 120 122 116 115 113 HINDPETRO 301.80 DOWN 302 304 306 311 300 298 294 HINDUNILVR 573.80 DOWN 574 577 580 586 571 568 562 HINDZINC 134.70 UP 134 137 139 143 132 129 124 IBREALEST 60.30 UP 60 62 64 67 59 57 53 ICICIBANK 1053.90 UP 1053 1060 1065 1077 1047 1041 1029 IDBI 98.20 DOWN 98 99 100 102 97 96 94 IDEA 81.40 DOWN 82 82 83 85 81 80 78 IDFC 151.30 UP 151 153 154 157 150 148 145 IFCI 30.05 DOWN 30 31 31 32 30 29 28 IGL 257.15 DOWN 257 259 260 264 256 254 251 INDHOTEL 68.35 UP 68 69 70 71 68 67 66 INDIACEM 97.85 DOWN 99 100 103 108 96 94 89 INDUSINDBK 359.35 UP 358 361 363 368 356 353 348 INFY 2356.70 DOWN 2358 2370 2383 2408 2345 2333 2308 IOB 79.65 UP 79 80 81 83 78 77 75 Keynote Capitals Ltd. The Ruby, 9th Floor, Senapati Bapat Marg, Dadar (W), Mumbai, India – 400028 Tel: 30266000 / 22694322 www.keynotecapitals.com
- 3. NSE Futures Intra-day Technical Levels For - 18/10/12 F&O Expiry 25/10/12 Close (Fut) Intra Day Pivot Resistance Support Company 17/10/12 Trend * Point R1 R2 R3 S1 S2 S3 IOC 256.70 UP 256 258 260 264 255 253 249 IRB 143.45 DOWN 145 152 160 175 137 130 115 ITC 288.65 UP 288 290 292 295 286 284 281 IVRCLINFRA 45.10 DOWN 45 46 47 48 44 44 42 JINDALSTEL 414.10 DOWN 414 418 421 428 411 407 400 JISLJALEQS 71.60 DOWN 72 76 80 88 68 65 57 JPASSOCIAT 90.65 UP 91 92 93 94 90 89 87 JPPOWER 36.55 DOWN 37 37 37 38 36 36 36 JSWENERGY 61.45 DOWN 62 62 63 65 61 60 59 JSWSTEEL 728.55 UP 728 738 747 767 719 709 690 JUBLFOOD 1319.95 DOWN 1326 1342 1363 1400 1305 1290 1253 KOTAKBANK 628.35 UP 628 633 638 648 623 618 608 KTKBANK 123.70 UP 123 126 127 131 122 119 115 LICHSGFIN 252.15 DOWN 254 259 265 276 247 242 231 LT 1630.65 UP 1625 1642 1654 1683 1613 1596 1567 LUPIN 571.50 UP 567 578 585 602 561 550 533 M&M 829.95 UP 830 837 844 858 823 816 801 MARUTI 1372.90 DOWN 1376 1386 1400 1423 1363 1353 1329 MCDOWELL-N 1288.05 UP 1284 1308 1327 1370 1265 1241 1198 MCLEODRUSS 312.70 DOWN 315 320 327 338 308 303 292 MPHASIS 405.85 DOWN 406 410 414 421 402 398 391 MRF 10196.70 DOWN 10229 10298 10399 10569 10128 10059 9889 NCC 48.25 DOWN 49 50 52 56 47 46 42 NHPC 21.30 UP 21 22 22 22 21 21 20 NMDC 187.75 DOWN 188 190 191 195 186 185 181 NTPC 169.00 UP 168 170 171 173 168 166 164 OFSS 2963.00 DOWN 2964 2993 3022 3080 2935 2906 2848 ONGC 280.60 UP 281 282 283 286 279 278 275 OPTOCIRCUI 130.85 DOWN 131 133 135 138 129 127 124 ORIENTBANK 285.25 DOWN 288 293 300 312 281 276 264 PANTALOONR 189.90 DOWN 190 193 196 202 187 184 178 PEL 476.70 UP 475 480 484 494 471 465 456 PETRONET 163.75 UP 164 165 167 171 162 160 157 PFC 197.60 DOWN 198 201 205 213 194 191 183 PNB 817.05 DOWN 818 825 833 847 810 803 788 POWERGRID 119.80 UP 120 120 121 122 119 118 117 PTC 67.60 DOWN 68 69 70 72 67 66 64 PUNJLLOYD 52.10 UP 52 53 53 55 51 51 49 RANBAXY 552.45 UP 550 557 561 573 545 538 526 RAYMOND 375.05 DOWN 376 379 383 390 372 369 362 RCOM 61.30 UP 61 62 64 66 60 58 55 Keynote Capitals Ltd. The Ruby, 9th Floor, Senapati Bapat Marg, Dadar (W), Mumbai, India – 400028 Tel: 30266000 / 22694322 www.keynotecapitals.com
- 4. NSE Futures Intra-day Technical Levels For - 18/10/12 F&O Expiry 25/10/12 Close (Fut) Intra Day Pivot Resistance Support Company 17/10/12 Trend * Point R1 R2 R3 S1 S2 S3 RECLTD 213.35 DOWN 215 220 226 236 209 205 195 RELCAPITAL 445.05 UP 444 450 454 465 439 433 423 RELIANCE 808.50 DOWN 811 818 827 842 802 796 780 RELINFRA 505.50 DOWN 506 513 521 537 498 490 474 RENUKA 34.80 UP 35 36 37 38 34 33 31 RPOWER 101.35 UP 101 102 103 105 100 99 97 SAIL 82.80 DOWN 83 84 86 88 82 81 78 SBIN 2223.60 DOWN 2232 2256 2289 2345 2200 2176 2120 SCI 57.20 UP 57 58 59 60 56 55 54 SESAGOA 170.35 UP 170 172 173 176 168 166 163 SIEMENS 692.45 DOWN 694 700 708 723 686 679 665 SINTEX 71.80 DOWN 72 73 75 77 71 69 67 SOUTHBANK 23.45 DOWN 24 24 24 25 23 23 22 SRTRANSFIN 634.60 DOWN 636 642 650 663 629 623 609 STER 100.20 UP 100 101 102 105 99 97 95 SUNPHARMA 714.05 DOWN 716 720 727 737 710 706 695 SUNTV 362.05 UP 362 368 373 385 356 350 339 SUZLON 14.80 DOWN 15 15 16 16 15 14 14 SYNDIBANK 118.50 DOWN 119 121 124 128 116 114 110 TATACHEM 325.65 DOWN 326 328 330 334 324 322 319 TATACOMM 244.40 UP 244 246 248 252 242 240 237 TATAGLOBAL 162.40 DOWN 163 165 167 172 160 158 154 TATAMOTORS 265.65 UP 265 268 271 277 262 259 253 TATAMTRDVR 164.70 UP 164 166 167 170 163 161 158 TATAPOWER 104.15 UP 104 105 106 108 103 102 100 TATASTEEL 408.25 DOWN 409 414 419 428 404 399 390 TCS 1283.50 DOWN 1288 1301 1319 1351 1270 1257 1226 TECHM 954.35 DOWN 954 962 969 984 947 939 924 TITAN 275.10 UP 274 278 280 286 272 269 263 UCOBANK 76.50 UP 76 78 79 81 75 74 72 ULTRACEMCO 2033.85 DOWN 2036 2047 2060 2083 2023 2012 1988 UNIONBANK 200.00 DOWN 200 203 205 210 198 196 191 UNIPHOS 121.10 DOWN 122 124 126 131 120 118 114 UNITECH 26.10 UP 26 27 27 28 26 25 24 VIJAYABANK 57.20 UP 57 58 58 60 56 56 54 VOLTAS 119.65 UP 119 122 124 128 118 115 111 WELCORP 98.40 UP 98 100 102 105 96 94 91 WIPRO 352.95 DOWN 353 355 358 362 351 349 344 Keynote Capitals Ltd. The Ruby, 9th Floor, Senapati Bapat Marg, Dadar (W), Mumbai, India – 400028 Tel: 30266000 / 22694322 www.keynotecapitals.com
- 5. NSE Futures Intra-day Technical Levels For - 18/10/12 F&O Expiry 25/10/12 Close (Fut)Intra Day Pivot Resistance Support Company 17/10/12 Trend * Point R1 R2 R3 S1 S2 S3 YESBANK 386.10 UP 386 388 390 395 384 381 377 ZEEL 193.95 UP 193 197 200 206 190 186 179 Sanjay Bhatia (AVP – Technical Research), Email Id sanjay@keynotecapitals.net Pivot Point: Intra- Day Trading Tool. - The key to the use of this tool is the use of Stop Loss Intra Day Trend: It is valid only till the point where Price trades above Pivot Point. For Eg. “UP” would be valid till Price remains above Pivot Point. It would become “DOWN” in event Price trades below Pivot Point. Pivot Point (PP): This is a trigger point for Intra Day Buy / Sell based on the price range of the previous day. R1: Resistance 1: 1st Resistance level over Pivot Point, R2: Resistance 2: Next Resistance level after R1. R3: Resistance 3: Next Resistance level after R2. S1: Support 1: 1st Support level after Pivot Point, S2: Support 2: Next Support level after S1. S3: Support 3: Next Support level after S2. Note: As per this tool, the trader should take BUY position just above the Pivot Point and keep the Pivot Point level as stop loss and the first target would be R1 level (Resistance 1). If R1 is crossed then R2 (Resistance 2) becomes the next target with the stop loss placed at R1 level. If R2 is crossed then R3 (Resistance 3) becomes the next target with the stop loss placed at R2 level. Similarly if price goes below the Pivot Point the trader should take a SELL position and keep the Pivot Point level as the stop loss and the first target would be S1 level (Support 1). If S1 level is breached then S2 level (Support 2) becomes the next target with the stop loss placed at S1 level. If S2 level is breached then S3 level (Support 3) becomes the next target with the stop loss placed at S2 level. Disclaimer: This document is not for public distribution and has been furnished to you solely for your information and must not be reproduced or redistributed to any other person. Persons into whose possession this document may come are required to observe these restrictions. This material is for the personal information of the authorized recipient, and we are not soliciting any action based upon it. This report is not to be construed as an offer to sell or the solicitation of an offer to buy any security in any jurisdiction where such an offer or solicitation would be illegal. It is for the general information of clients of Keynote Capitals Ltd. It does not constitute a personal recommendation or take into account the particular investment objectives, financial situations, or needs of individual clients. We have reviewed the report and in so far as it includes current or historical information, it is believed to be reliable though its accuracy or completeness cannot be guaranteed. Neither Keynote Capitals Ltd., nor any person connected with it, accepts any liability arising from the use of this document. The recipients of this material should rely on their own investigations and take their own professional advice. Price and value of the investments referred to in this material may go up or down. Past performance is not a guide for future performance. Certain transactions including those involving futures, options and other derivatives as well as non-investment grade securities involve substantial risk and are not suitable for all investors. Reports based on technical analysis centers on studying charts of a stock’s price movement and trading volume, as opposed to focusing on a company’s fundamentals and as such, may not match with a report on a company’s fundamentals. Opinions expressed are our current opinions as of the date appearing on this material only. While we endeavor to update on a reasonable basis the information discussed in this material, there may be regulatory, compliance or other reasons that prevent us from doing so. Prospective investors and others are cautioned that any forward looking statements are not predictions and may be subject to change without notice. Our proprietary trading and investment businesses may make investment decisions that are inconsistent with the recommendations expressed herein. We and our affiliates, officers, directors, and employees world wide may: (a) from time to time have long or short positions in and buy or sell the securities thereof of company (ies) mentioned herein or (b) be engaged in any other transaction involving such securities and earn brokerage or other compensation or act as a market maker in the financial instruments of the company (ies) discussed herein or act as advisor or lender/ borrower to such company (ies) or have other potential conflict of interest with respect to any recommendation and related information and opinions. The analyst for this report certifies that all of the views expressed in this report accurately reflect his or her personal views about the subject company or companies and its or their securities, and no part of his or her compensation was, is or will be, directly or indirectly related to specific recommendations or views expressed in this report. No part of this material may be duplicated in any form and/or redistributed without Keynote Capitals Ltd’s., prior written consent. Keynote Capitals Ltd. The Ruby, 9th Floor, Senapati Bapat Marg, Dadar (W), Mumbai, India – 400028 Tel: 30266000 / 22694322 www.keynotecapitals.com