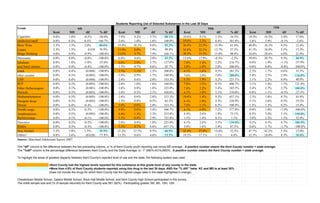
Students Reporting Use of Selected Substances in the Last 30 Days
1. Students Reporting Use of Selected Substances in the Last 30 Days
Grade 6th 8th 10th 12th
Kent MD dif % dif Kent MD dif % dif Kent MD dif % dif Kent MD dif % dif
Cigarettes 0.8% 1.0% -0.2% -20.0% 7.9% 4.2% 3.7% 88.1% 10.6% 9.1% 1.5% 16.5% 19.2% 16.3% 2.9% 17.8%
smokeless/snuff 0.8% 0.3% 0.5% 166.7% 2.6% 1.0% 1.6% 160.0% 10.6% 2.2% 8.4% 381.8% 3.8% 3.9% -0.1% -2.6%
Beer/ Wine 5.3% 3.3% 2.0% 60.6% 19.9% 10.3% 9.6% 93.2% 36.4% 22.5% 13.9% 61.8% 40.8% 36.3% 4.5% 12.4%
Liquor 2.3% 1.3% 0.010 76.9% 15.9% 8.0% 7.9% 98.8% 34.8% 22.1% 12.7% 57.5% 41.5% 36.0% 5.5% 15.3%
Binge Drinking 0.0% 0.9% -0.9% -100.0% 12.6% 4.7% 7.9% 168.1% 30.3% 15.3% 15.0% 98.0% 34.6% 28.6% 6.0% 21.0%
Marijuana 0.0% 0.8% -0.8% -100.0% 6.6% 4.6% 2.0% 43.5% 13.6% 13.9% -0.3% -2.2% 30.0% 20.7% 9.3% 44.9%
Inhalants 0.8% 1.8% -1.0% -55.6% 6.6% 2.9% 3.7% 127.6% 7.6% 2.4% 5.2% 216.7% 0.8% 1.9% -1.1% -57.9%
amy/butyl nitrates 0.0% 0.4% -0.4% -100.0% 1.3% 0.7% 0.6% 85.7% 3.0% 1.0% 2.0% 200.0% 0.0% 0.8% -0.8% -100.0%
crack 0.0% 0.4% (0.004) -100.0% 3.3% 1.1% 2.2% 200.0% 6.1% 1.6% 4.5% 281.3% 2.3% 1.7% 0.6% 35.3%
other cocaine 0.0% 0.3% (0.003) -100.0% 2.6% 0.9% 1.7% 188.9% 7.6% 2.0% 5.6% 280.0% 5.4% 2.5% 2.9% 116.0%
LSD 0.0% 0.4% (0.004) -100.0% 2.6% 0.6% 2.0% 333.3% 6.1% 1.9% 4.2% 221.1% 3.1% 2.2% 0.9% 40.9%
PCP 0.0% 0.3% (0.003) -100.0% 2.6% 1.0% 1.6% 160.0% 7.6% 1.5% 6.1% 406.7% 3.1% 1.4% 1.7% 121.4%
Other Hallucinogens 0.0% 0.1% (0.001) -100.0% 2.6% 0.8% 1.8% 225.0% 7.6% 2.2% 5.4% 245.5% 5.4% 2.7% 2.7% 100.0%
Steriods 0.0% 0.3% (0.003) -100.0% 2.6% 0.5% 2.1% 420.0% 6.1% 1.0% 5.1% 510.0% 0.8% 1.1% -0.3% -27.3%
Methamphetamine 0.0% 0.5% (0.005) -100.0% 2.6% 0.6% 2.0% 333.3% 10.6% 1.4% 9.2% 657.1% 2.3% 1.6% 0.7% 43.8%
Designer drugs 0.0% 0.3% (0.003) -100.0% 1.3% 0.8% 0.5% 62.5% 6.1% 1.8% 4.3% 238.9% 3.1% 2.6% 0.5% 19.2%
Heroin 0.0% 0.4% -0.4% -100.0% 2.6% 0.6% 2.0% 333.3% 7.6% 1.1% 6.5% 590.9% 1.5% 1.3% 0.2% 15.4%
Needle usage 0.0% 0.2% -0.2% -100.0% 4.0% 0.6% 3.4% 566.7% 6.1% 0.9% 5.2% 577.8% 0.0% 1.0% -1.0% -100.0%
Amphetamines 0.0% 0.5% (0.005) -100.0% 4.6% 1.3% 3.3% 253.8% 4.5% 2.6% 1.9% 73.1% 8.5% 3.4% 5.1% 150.0%
Barbits/tranqs 0.0% 0.1% -0.1% -100.0% 3.3% 0.4% 2.9% 725.0% 1.5% 1.4% 0.1% 7.1% 3.8% 2.5% 1.3% 52.0%
Narcotics 0.0% 0.2% -0.2% -100.0% 2.6% 0.8% 1.8% 225.0% 6.1% 2.6% 3.5% 134.6% 9.2% 4.5% 4.7% 104.4%
Ritalin 0.0% 0.3% -0.3% -100.0% 5.3% 0.7% 4.6% 657.1% 3.0% 1.6% 1.4% 87.5% 0.0% 1.7% -1.7% -100.0%
Any Alcohol 5.3% 3.8% 1.5% 39.5% 21.2% 12.7% 8.5% 66.9% 42.4% 27.8% 14.6% 52.5% 47.7% 42.2% 5.5% 13.0%
Others ** 0.8% 3.6% (0.028) -77.8% 13.2% 8.6% 4.6% 53.5% 18.2% 17.1% 1.1% 6.4% 32.3% 24.0% 8.3% 34.6%
Source: Maryland Adolescent Survey 2007
The "dif" column is the difference between the two preceding column, or % of Kent County youth reporting use minus MD average. A positive number means the Kent County number > state average.
The "%dif" column is the percentage difference betweeen Kent County and the State Average, or -1* (MD%-KC%)/MD%. A positive number means the Kent County number > state average.
To highlight the areas of greatest disparity between Kent County's reported level of use and the state, the following system was used:
=Kent County had the highest levels reported for this substance at this grade level of any county in the state.
=More than 4.9% of Kent County students reported using this drug in the last 30 days, AND the "% diff." betw. KC and MD is at least 30%
(does not include the drugs for which Kent County has the highest usage rates in the state-highlighted in orange)
Chestertown Middle School, Galena Middle School, Rock Hall Middle School, and Kent County High School participated in this survey.
The initial sample size and (% of sample returned) for Kent County was 581 (82%). Participating grades: 6th, 8th, 10th, 12th
2. Trends in 6th Grade Use of Cigarettes, Marijuana, Any Alcohol, Binge Drinking: Percent of Students reporting use in the last 30 days
6th Grade Cigarettes 6th Grade Marijuana
1994 1996 1998 2001 2002 2004 2007 1994 1996 1998 2001 2002 2004 2007
Kent County 9.6% 12.2% 3.0% 10.2% 0.6% 3.3% 0.8% Kent County 3.4% 5.6% 0.0% 2.2% 1.7% 0.8% 0.0%
MD 5.4% 4.6% 4.2% 2.5% 1.3% 1.5% 1.0% MD 1.8% 1.8% 1.8% 1.2% 0.8% 0.8% 0.8%
% of 6th Graders Reporting Use of Cigarettes, Last 30 Days % of 6th Graders Reporting Use of Marijuana, Last 30 Days
20.0% 20.0%
15.0% 15.0%
10.0% 10.0%
Kent County Kent County
MD MD
5.0%
5.0%
0%
0%
1994 1996 1998 2001 2002 2004 2007
1994 1996 1998 2001 2002 2004 2007
6th Grade Cigarettes Dif % 6th Grade Marijuana Dif %
Kent County increase/decrease over time: -8.8% -91.7% Kent County increase/decrease over time: -3.4% -100.0%
MD increase/decrease over time: -4.4% -81.5% MD increase/decrease over time: -1.0% -55.6%
6th Grade Any Alcohol 6th Grade Binge Drinking (5 drinks or more in one sitting)
1994 1996 1998 2001 2002 2004 2007 1994 1996 1998 2001 2002 2004 2007
Kent County 10.3% 15.8% 6.5% 17.7% 7.2% 4.1% 5.3% Kent County 4.1% 6.6% 2.5% 8.1% 1.7% 3.3% 0.0%
MD 10.4% 7.9% 9.1% 6.3% 5.0% 5.4% 3.8% MD 3.0% 2.6% 3.2% 2.3% 1.3% 1.4% 0.9%
% of 6th Graders Reporting Use of Any Form of Alcohol, Last 30 Days % of 6th Graders Reporting Binge Drinking, ,Last 30 Days
20.0% 20.0%
15.0% 15.0%
10.0% 10.0% Kent County
Kent County MD
MD
5.0% 5.0%
0% 0%
1994 1996 1998 2001 2002 2004 2007 1994 1996 1998 2001 2002 2004 2007
6th Grade Any Alcohol Dif % 6th Grade Binge Drinking Dif %
Kent County increase/decrease over time: -5.0% -48.5% Kent County increase/decrease over time: -4.1% -100.0%
MD increase/decrease over time: -6.6% -63.5% MD increase/decrease over time: -2.1% -70.0%
Source: Maryland Adolescent Survey (2001-2007), GOC tables
.
3. Healthy Children
7. Substance Abuse
8th Grade use of Alcohol, Tobacco, Marijuana in the last 30 days
8th Grade Cigarettes 8th Grade Marijuana
1994 1996 1998 2001 2002 2004 2007 1994 1996 1998 2001 2002 2004 2007
Kent County 28.5% 23.0% 21.3% 9.5% 20.8% 12.2% 7.9% Kent County 22.4% 8.9% 14.6% 11.1% 10.9% 6.7% 6.6%
MD 20.8% 17.0% 14.8% 10.6% 6.6% 5.9% 4.2% MD 13.0% 11.6% 10.0% 10.6% 6.9% 6.4% 4.6%
% of 8th Graders Reporting Use of Cigarettes, Last 30 Days % of 8th Graders Reporting Use of Marijuana, Last 30 Days
70.0% 70.0%
52.5% 52.5%
35.0% 35.0% Kent County
Kent County MD
MD
17.5% 17.5%
0% 0%
1994 1996 1998 2001 2002 2004 2007 1994 1996 1998 2001 2002 2004 2007
8th Grade Cigarettes Dif % 8th Grade Marijuana Dif %
Kent County increase/decrease over time: -20.6% -72.3% Kent County increase/decrease over time: -15.8% -70.5%
MD increase/decrease over time: -16.6% -79.8% MD increase/decrease over time: -8.4% -64.6%
8th Grade Any Alcohol 8th Grade Binge Drinking (5 drinks or more in one sitting)
1994 1996 1998 2001 2002 2004 2007 1994 1996 1998 2001 2002 2004 2007
Kent County 39.8% 35.7% 28.8% 15.5% 32.7% 22.6% 21.2% Kent County 20.6% 19.7% 11.5% 11.6% 18.6% 16.5% 12.6%
MD 31.0% 27.1% 26.6% 22.8% 16.4% 16.2% 12.7% MD 13.4% 11.2% 12.0% 9.3% 7.2% 6.6% 4.7%
% of 8th Graders Reporting Use of Any Form of Alcohol, Last 30 Days % of 8th Graders Reporting Binge Drinking, Last 30 Days
70.0% 70.0%
52.5%
52.5%
35.0% Kent County
35.0%
MD
Kent County
MD 17.5%
17.5%
0%
0% 1994 1996 1998 2001 2002 2004 2007
1994 1996 1998 2001 2002 2004 2007
8th Grade Any Alcohol Dif % 8th Grade Binge Drinking Dif %
Kent County increase/decrease over time: -18.6% -46.7% Kent County increase/decrease over time: -8.0% -38.8%
MD increase/decrease over time: -18.3% -59.0% MD increase/decrease over time: -8.7% -64.9%
Source: Maryland Adolescent Survey (2001-2007), GOC tables
4. Healthy Children
7. Substance Abuse
10th Grade use of Alcohol, Tobacco, Marijuana in the last 30 days
10th Grade Cigarettes 10th Grade Marijuana
1994 1996 1998 2001 2002 2004 2007 1994 1996 1998 2001 2002 2004 2007
Kent County 40.9% 33.4% 26.4% 31.1% 17.6% 26.8% 10.6% Kent County 25.5% 31.8% 27.6% 40.0% 21.5% 25.5% 13.6%
MD 26.7% 25.1% 23.9% 16.6% 12.7% 11.2% 9.1% MD 22.8% 22.4% 22.7% 19.8% 16.7% 15.6% 13.9%
% of 10th Graders Reporting Use of Tobacco, Last 30 Days % of 10th Graders Reporting Use of Marijuana, Last 30 Days
70.0% 70.0%
52.5%
35.0%
Kent County Kent County
MD MD
17.5%
0% 0%
1994 1996 1998 2001 2002 2004 2007 1994 1996 1998 2001 2002 2004 2007
10th Grade Cigarettes Dif % 10th Grade Marijuana Dif %
Kent County increase/decrease over time: -30.3% -74.1% Kent County increase/decrease over time: -11.9% -46.7%
MD increase/decrease over time: -17.6% -65.9% MD increase/decrease over time: -8.9% -39.0%
10th Grade Any Alcohol 10th Grade Binge Drinking (5 drinks or more in one sitting)
1994 1996 1998 2001 2002 2004 2007 1994 1996 1998 2001 2002 2004 2007
Kent County 53.6% 57.2% 55.0% 67.6% 38.5% 43.1% 42.4% Kent County 31.8% 37.9% 36.9% 44.8% 33.3% 27.5% 30.3%
MD 45.0% 43.7% 42.9% 35.9% 35.0% 31.4% 27.8% MD 25.4% 25.2% 26.4% 21.1% 19.6% 17.4% 15.3%
% of 10th Graders Reporting Use of Any Form of Alchohol, Last 30 Days % of 10th Graders Reporting Binge Drinking, Last 30 Days
70.0% 70.0%
52.5% 52.5%
35.0% 35.0% Kent County
Kent County MD
17.5% MD 17.5%
0% 0%
1994 1996 1998 2001 2002 2004 2007 1994 1996 1998 2001 2002 2004 2007
10th Grade Any Alcohol Dif % 10th Grade Binge Drinking Dif %
Kent County increase/decrease over time: -11.2% -20.9% Kent County increase/decrease over time: -1.5% -4.7%
MD increase/decrease over time: -17.2% -38.2% MD increase/decrease over time: -10.1% -39.8%
Source: Maryland Adolescent Survey (2001-2007), GOC tables
5. Healthy Children
7. Substance Abuse
12th Grade use of Alcohol, Tobacco, Marijuana in the last 30 days
12th Grade Cigarettes 12th Grade Marijuana
1994 1996 2001 2002 2004 2007 1994 1996 2001 2002 2004 2007
Kent County 34.6% 40.5% 29.2% 29.9% 27.7% 19.2% Kent County 22.2% 28.2% 22.1% 25.6% 22.3% 30.0%
MD 29.9% 32.0% 25.5% 19.8% 19.8% 16.3% MD 25.3% 27.4% 22.7% 21.0% 21.9% 20.7%
% of 12th Graders Reporting Use of Cigarettes, Last 30 Days % of 12th Graders Reporting Use of Marijuana, Last 30 Days
70.0% 70.0%
52.5% 57.3%
35.0% Kent County 44.5%
MD Kent County
MD
17.5% 31.8%
0% 19.0%
1994 1996 2001 2002 2004 2007 1994 1996 2001 2002 2004 2007
12th Grade Cigarettes # % 12th Grade Marijuana # %
Kent County increase/decrease over time: -15.4% -44.5% Kent County increase/decrease over time: 7.8% 35.1%
MD increase/decrease over time: -13.6% -45.5% MD increase/decrease over time: -4.6% -18.2%
12th Grade Any Alcohol 12th Grade Binge Drinking (5 drinks or more in one sitting)
1994 1996 2001 2002 2004 2007 1994 1996 2001 2002 2004 2007
Kent County 51.9% 65.1% 52.7% 59.5% 58.5% 47.7% Kent County 38.3% 49.3% 40.7% 43.0% 45.7% 34.6%
MD 53.3% 52.4% 47.5% 44.3% 44.1% 42.2% MD 34.2% 36.6% 31.4% 28.8% 29.0% 28.6%
% of 12th Graders Reporting Use of Any Form of Alcohol, Last 30 Days % of 12th Grade Reporting Binge Drinking, Last 30 Days
70.0% 70.0%
52.5% 52.5%
35.0% 35.0%
Kent County Kent County
MD MD
17.5% 17.5%
0% 0%
1994 1996 2001 2002 2004 2007 1994 1996 2001 2002 2004 2007
12th Grade Any Alcohol # % 12th Grade Binge Drinking # %
Kent County increase/decrease over time: -4.2% -8.1% Kent County increase/decrease over time: -3.7% -9.7%
MD increase/decrease over time: -11.1% -20.8% MD increase/decrease over time: -5.6% -16.4%
Source: Maryland Adolescent Survey (2001-2007), GOC tables
NOTE: 1998 Data for Kent County 12th Grade Not Available
6. Trends in Cigarette Use: Percent of Students reporting use in the last 30 days
6th Grade Cigarettes 8th Grade Cigarettes
1994 1996 1998 2001 2002 2004 2007 1994 1996 1998 2001 2002 2004 2007
Kent County 9.6% 12.2% 3.0% 10.2% 0.6% 3.3% 0.8% Kent County 28.5% 23.0% 21.3% 9.5% 20.8% 12.2% 7.9%
MD 5.4% 4.6% 4.2% 2.5% 1.3% 1.5% 1.0% MD 20.8% 17.0% 14.8% 10.6% 6.6% 5.9% 4.2%
% of 6th Graders Reporting Use of Cigarettes, Last 30 Days % of 8th Graders Reporting Use of Cigarettes, Last 30 Days
41.0% 41.0%
30.8%
20.5%
Kent County Kent County
MD MD
10.3%
0% 0%
1994 1996 1998 2001 2002 2004 2007 1994 1996 1998 2001 2002 2004 2007
6th Grade Cigarettes Dif % 8th Grade Cigarettes Dif %
Kent County increase/decrease over time: -8.8% -91.7% Kent County increase/decrease over time: -20.6% -72.3%
MD increase/decrease over time: -4.4% -81.5% MD increase/decrease over time: -16.6% -79.8%
10th Grade Cigarettes 12th Grade Cigarettes
1994 1996 1998 2001 2002 2004 2007 1994 1996 2001 2002 2004 2007
Kent County 40.9% 33.4% 26.4% 31.1% 17.6% 26.8% 10.6% Kent County 34.6% 40.5% 29.2% 29.9% 27.7% 19.2%
MD 26.7% 25.1% 23.9% 16.6% 12.7% 11.2% 9.1% MD 29.9% 32.0% 25.5% 19.8% 19.8% 16.3%
% of 10th Graders Reporting Use of Cigarettes, Last 30 Days % of 12th Graders Reporting Use of Cigarettes, Last 30 Days
41.0% 41.0%
Kent County Kent County
MD MD
0% 0%
1994 1996 1998 2001 2002 2004 2007 1994 1996 2001 2002 2004 2007
1998 data not available for seniors
10th Grade Cigarettes Dif % 12th Grade Cigarettes Dif %
Kent County increase/decrease over time: -30.3% -74.1% Kent County increase/decrease over time: -15.4% -44.5%
MD increase/decrease over time: -17.6% -65.9% MD increase/decrease over time: -13.6% -45.5%
Source: Maryland Adolescent Survey (2001-2007), GOC tables
7. Trends in Use of Any Form of Alcohol: Percent of Students reporting use in the last 30 days
6th Grade Any Alcohol 8th Grade Any Alcohol
1994 1996 1998 2001 2002 2004 2007 1994 1996 1998 2001 2002 2004 2007
Kent County 10.3% 15.8% 6.5% 17.7% 7.2% 4.1% 5.3% Kent County 39.8% 35.7% 28.8% 15.5% 32.7% 22.6% 21.2%
MD 10.4% 7.9% 9.1% 6.3% 5.0% 5.4% 3.8% MD 31.0% 27.1% 26.6% 22.8% 16.4% 16.2% 12.7%
% of 6th Graders Reporting Use of Any Form of Alcohol, Last 30 Days % of 8th Graders Reporting Use of Any Form of Alcohol, Last 30 Days
70.0% 70.0%
52.5% 52.5%
35.0% 35.0%
Kent County Kent County
MD MD
17.5% 17.5%
0% 0%
1994 1996 1998 2001 2002 2004 2007 1994 1996 1998 2001 2002 2004 2007
6th Grade Any Alcohol Dif % 8th Grade Any Alcohol Dif %
Kent County increase/decrease over time: -5.0% -48.5% Kent County increase/decrease over time: -18.6% -46.7%
MD increase/decrease over time: -6.6% -63.5% MD increase/decrease over time: -18.3% -59.0%
10th Grade Any Alcohol 12th Grade Any Alcohol
1994 1996 1998 2001 2002 2004 2007 1994 1996 2001 2002 2004 2007
Kent County 53.6% 57.2% 55.0% 67.6% 38.5% 43.1% 42.4% Kent County 51.9% 65.1% 52.7% 59.5% 58.5% 47.7%
MD 45.0% 43.7% 42.9% 35.9% 35.0% 31.4% 27.8% MD 53.3% 52.4% 47.5% 44.3% 44.1% 42.2%
% of 10th Graders Reporting Use of Any Form of Alcohol, Last 30 Days % of 12th Graders Reporting Use of Any Form of Alcohol, Last 30 Days
70.0% 70.0%
52.5% 52.5%
35.0% 35.0%
Kent County Kent County
MD MD
17.5% 17.5%
0% 0%
1994 1996 1998 2001 2002 2004 2007 1994 1996 2001 2002 2004 2007
1998 data not available for seniors
10th Grade Any Alcohol Dif % 12th Grade Any Alcohol Dif %
Kent County increase/decrease over time: -11.2% -20.9% Kent County increase/decrease over time: -4.2% -8.1%
MD increase/decrease over time: -17.2% -38.2% MD increase/decrease over time: -11.1% -20.8%
Source: Maryland Adolescent Survey (2001-2007), GOC tables
8. Trends in Binge Drinking (5 drinks or more at one time): Percent of Students reporting use in the last 30 days
6th Grade Binge Drinking 8th Grade Binge Drinking
1994 1996 1998 2001 2002 2004 2007 1994 1996 1998 2001 2002 2004 2007
Kent County 4.1% 6.6% 2.5% 8.1% 1.7% 3.3% 0.0% Kent County 20.6% 19.7% 11.5% 11.6% 18.6% 16.5% 12.60%
MD 3.0% 2.6% 3.2% 2.3% 1.3% 1.4% 0.9% MD 13.4% 11.2% 12.0% 9.3% 7.2% 6.6% 4.70%
Report of 6th Graders Reporting Binge Drinking, Last 30 Days Report of 8th Graders Reporting Binge Drinking, Last 30 Days
50.0% 50.0%
37.5% 37.5%
25.0% Kent County 25.0%
MD Kent County
MD
12.5% 12.5%
0% 0%
1994 1996 1998 2001 2002 2004 2007 1994 1996 1998 2001 2002 2004 2007
6th Grade Binge Drinking Dif % 8th Grade Binge Drinking Dif %
Kent County increase/decrease over time: -4.1% -100.0% Kent County increase/decrease over time: -8.0% -38.8%
MD increase/decrease over time: -2.1% -70.0% MD increase/decrease over time: -8.7% -64.9%
10th Grade Binge Drinking 12th Grade Binge Drinking
1994 1996 1998 2001 2002 2004 2007 1994 1996 2001 2002 2004 2007
Kent County 31.8% 37.9% 36.9% 44.8% 33.3% 27.5% 30.3% Kent County 38.3% 49.3% 40.7% 43.0% 45.7% 34.6%
MD 25.4% 25.2% 26.4% 21.1% 19.6% 17.4% 15.3% MD 34.2% 36.6% 31.4% 28.8% 29.0% 28.6%
Report of 12th Graders Reporting Binge Drinking, Last 30 Days
Report of 10th Graders Reporting Binge Drinking, Last 30 Days
50.0%
50.0%
37.5%
37.5%
25.0% 25.0% Kent County
Kent County
MD MD
12.5% 12.5%
0% 0%
1994 1996 1998 2001 2002 2004 2007 1994 1996 2001 2002 2004 2007
1998 Data not available for Seniors
10th Grade Binge Drinking Dif % 12th Grade Binge Drinking Dif %
Kent County increase/decrease over time: -1.5% -4.7% Kent County increase/decrease over time: -3.7% -9.7%
MD increase/decrease over time: -10.1% -39.8% MD increase/decrease over time: -5.6% -16.4%
Source: Maryland Adolescent Survey (2001-2007), GOC tables
9. Trends in Marijuana Use: Percent of Students reporting use in the last 30 days
6th Grade Marijuana 8th Grade Marijuana
1994 1996 1998 2001 2002 2004 2007 1994 1996 1998 2001 2002 2004 2007
Kent County 3.4% 5.6% 0.0% 2.2% 1.7% 0.8% 0.0% Kent County 22.4% 8.9% 14.6% 11.1% 10.9% 6.7% 6.6%
MD 1.8% 1.8% 1.8% 1.2% 0.8% 0.8% 0.8% MD 13.0% 11.6% 10.0% 10.6% 6.9% 6.4% 4.6%
% of 6th Graders Reporting Use of Marijuana, Last 30 Days % of 8th Graders Reporting Use of Marijuana, Last 30 Days
40.0% 40.0%
30.0% 30.0%
20.0% Kent County 20.0% Kent County
MD MD
10.0% 10.0%
0% 0%
1994 1996 1998 2001 2002 2004 2007 1994 1996 1998 2001 2002 2004 2007
6th Grade Marijuana Dif % 8th Grade Marijuana Dif %
Kent County increase/decrease over time: -3.4% -100.0% Kent County increase/decrease over time: -15.8% -70.5%
MD increase/decrease over time: -1.0% -55.6% MD increase/decrease over time: -8.4% -64.6%
10th Grade Marijuana 12th Grade Marijuana
1994 1996 1998 2001 2002 2004 2007 1994 1996 2001 2002 2004 2007
Kent County 25.5% 31.8% 27.6% 40.0% 21.5% 25.5% 13.6% Kent County 22.2% 28.2% 22.1% 25.6% 22.3% 30.0%
MD 22.8% 22.4% 22.7% 19.8% 16.7% 15.6% 13.9% MD 25.3% 27.4% 22.7% 21.0% 21.9% 20.7%
% of 10th Graders Reporting Use of Marijuana, Last 30 Days % of 12th Graders Reporting Use of Marijuana, Last 30 Days
40.0% 40.0%
30.0% 30.0%
20.0% 20.0%
Kent County
MD Kent County
MD
10.0% 10.0%
0% 0%
1994 1996 1998 2001 2002 2004 2007 1994 1996 2001 2002 2004 2007
1998 Data not available for Seniors
10th Grade Marijuana Dif % 12th Grade Marijuana Dif %
Kent County increase/decrease over time: -11.9% -46.7% Kent County increase/decrease over time: 7.8% 35.1%
MD increase/decrease over time: -8.9% -39.0% MD increase/decrease over time: -4.6% -18.2%
Source: Maryland Adolescent Survey (2001-2007), GOC tables
10. Trends in Heroin Use: Percent of Students reporting use in the last 30 days
6th Grade Heroin 8th Grade Heroin
1994 1996 1998 2001 2002 2004 2007 1994 1996 1998 2001 2002 2004 2007
Kent County 0.0% 3.8% 0.0% 0.6% 0.6% 0.8% 0.0% Kent County 3.6% 3.3% 0.0% 2.0% 2.8% 2.4% 2.6%
MD 0.6% 0.4% 0.7% 0.3% 0.3% 0.2% 0.4% MD 2.0% 1.6% 1.8% 1.1% 0.7% 0.8% 0.6%
% of 6th Graders Reporting Use of Heroin, Last 30 Days % of 8th Graders Reporting Use of Heroin, Last 30 Days
10.0% 10.0%
7.5% 7.5%
5.0% Kent County 5.0% Kent County
MD MD
2.5% 2.5%
0% 0%
1994 1996 1998 2001 2002 2004 2007 1994 1996 1998 2001 2002 2004 2007
6th Grade Heroin Dif % 8th Grade Heroin Dif %
Kent County increase/decrease over time: 0.0% 0.0% Kent County increase/decrease over time: -1.0% -27.8%
MD increase/decrease over time: -0.2% -33.3% MD increase/decrease over time: -1.4% -70.0%
10th Grade Heroin 12th Grade Heroin
1994 1996 1998 2001 2002 2004 2007 1994 1996 2001 2002 2004 2007
Kent County 1.8% 4.1% 7.6% 3.5% 2.8% 0.7% 7.6% Kent County 1.2% 0.8% 0.0% 8.4% 1.1% 1.5%
MD 1.0% 1.5% 2.2% 1.1% 1.1% 1.1% 1.1% MD 1.3% 1.6% 0.9% 1.4% 1.5% 1.3%
% of 10th Graders Reporting Use of Heroin, Last 30 Days % of 12th Graders Reporting Use of Heroin, Last 30 Days
10.0% 10.0%
7.5% 7.5%
5.0% Kent County 5.0% Kent County
MD MD
2.5% 2.5%
0% 0%
1994 1996 1998 2001 2002 2004 2007 1994 1996 2001 2002 2004 2007
1998 Data not available for 12th grade
10th Grade Heroin Dif % 12th Grade Heroin Dif %
Kent County increase/decrease over time: 5.8% 322.2% Kent County increase/decrease over time: 0.3% 25.0%
MD increase/decrease over time: 0.1% 10.0% MD increase/decrease over time: 0.0% 0.0%
Source: Maryland Adolescent Survey (2001-2007), GOC tables
11. Trends in Beer-Wine Use: Percent of Students reporting use in the last 30 days
6th Grade Beer-Wine Use 8th Grade Beer-Wine Use
2001 2002 2004 2007 2001 2002 2004 2007
Kent County 15.8% 6.6% 4.1% 5.3% Kent County 14.9% 30.0% 20.1% 19.9%
MD 5.7% 4.4% 4.7% 3.3% MD 20.0% 14.3% 14.2% 10.3%
% diff, KCof 6th Graders reporting Beer-Wine Use, last 30 days
% vs MD 63.9% 33.3% -14.6% % diff, KC vs MD Graders reporting Beer-Wine Use, last 30 days
% of 8th -34.2% 52.3% 29.4%
65.0% 65.0%
48.8%
32.5%
Kent County Kent County
MD MD
16.3%
0% 0%
2001 2002 2004 2007 2001 2002 2004 2007
6th Grade Beer-Wine Use Dif % 8th Grade Beer-Wine Use Dif %
Kent County increase/decrease over time: -11% -26.3% Kent County increase/decrease over time: 5% -9.9%
MD increase/decrease over time: -2% -8.1% MD increase/decrease over time: -10% -29.7%
10th Grade Beer-Wine Use 12th Grade Beer-Wine Use
2001 2002 2004 2007 2001 2002 2004 2007
Kent County 60.9% 34.8% 36.6% 36.4% Kent County 49.9% 55.6% 51.1% 40.8%
MD 32.2% 31.1% 26.3% 22.5% MD 42.4% 38.8% 38.5% 36.3%
% diff, KC 10th Graders reporting Beer-Wine Use, last 30 days
% of vs MD 47.1% 10.6% 28.1% % diff, KC of 12th Graders reporting Beer-Wine Use, 24.7% 30 days
% vs MD 15.0% 30.2% last
65.0% 65.0%
48.8% 48.8%
32.5% 32.5%
Kent County Kent County
MD MD
16.3% 16.3%
0% 0%
2001 2002 2004 2007 2001 2002 2004 2007
10th Grade Beer-Wine Use Dif % 12th Grade Beer-Wine Use Dif %
Kent County increase/decrease over time: -25% -40.2% Kent County increase/decrease over time: -9% -18.2%
MD increase/decrease over time: -10% -30.1% MD increase/decrease over time: -6% -14.4%
Source: Maryland Adolescent Survey (2001-2007), GOC tables
12. Trends in Liquor Use: Percent of Students reporting use in the last 30 days
6th Grade Liquor Use 8th Grade Liquor Use
2001 2002 2004 2007 2001 2002 2004 2007
Kent County 6.9% 2.2% 2.5% 2.3% Kent County 10.7% 23.4% 16.5% 15.9%
MD 2.7% 1.8% 2.4% 1.3% MD 14.3% 10.1% 9.8% 8.0%
% diff, KC6th Graders reporting Liquor18.2%
% of vs MD 60.9% 4.0%
Use, last 30 days % diff, KC vs MD Graders reporting Liquor Use, last 40.6%
% of 8th -33.6% 56.8% 30 days
50.0% 50.0%
37.6% 37.5%
25.3% Kent County 25.0% Kent County
MD MD
12.9% 12.5%
0.5% 0%
2001 2002 2004 2007 2001 2002 2004 2007
6th Grade Liquor Use Dif % 8th Grade Liquor Use Dif %
Kent County increase/decrease over time: -5% -66.7% Kent County increase/decrease over time: 5% 48.6%
MD increase/decrease over time: -1.4% -51.9% MD increase/decrease over time: -6% -44.1%
10th Grade Liquor Use 12th Grade Liquor Use
2001 2002 2004 2007 2001 2002 2004 2007
Kent County 49.8% 31.0% 34.6% 34.8% Kent County 40.7% 45.4% 47.9% 41.5%
MD 27.6% 26.3% 24.6% 22.1% MD 37.5% 34.5% 36.1% 36.0%
% diff, KC10th Graders reporting Liquor Use, last 30 days
% of vs MD 44.6% 15.2% 28.9% % diff, KC vs 12th Graders reporting Liquor Use, last24.6%
% of MD 7.9% 24.0% 30 days
50.0% 50.0%
37.5% 37.5%
25.0% Kent County 25.0% Kent County
MD MD
12.5% 12.5%
0% 0%
2001 2002 2004 2007 2001 2002 2004 2007
10th Grade Liquor Use Dif % 12th Grade Liquor Use Dif %
Kent County increase/decrease over time: -15% -30.1% Kent County increase/decrease over time: 1% 2.0%
MD increase/decrease over time: -6% -19.9% MD increase/decrease over time: -2% -4.0%
Source: Maryland Adolescent Survey (2001-2007), GOC tables
13. Trends in Methamphetamine Use: Percent of Students reporting use in the last 30 days
6th Grade Methamphetamine Use 8th Grade Methamphetamine Use
2001 2002 2004 2007 2001 2002 2004 2007
Kent County 1.6% 0.0% 0.0% 0.0% Kent County 1.9% 3.9% 4.3% 2.6%
MD 0.5% 0.4% 0.3% 0.5% MD 1.3% 1.0% 1.3% 0.6%
% of 6th Graders reporting Methamphetamine Use, last 30 days
% diff, KC vs MD 68.8% % diff, of 8th Graders reporting Methamphetamine Use, last 30 days
% KC vs MD 31.6% 74.4% 69.8%
7.5% 7.5%
Kent County Kent County
MD MD
0% 0%
2001 2002 2004 2007 2001 2002 2004 2007
6th Grade Methamphetamine Use Dif % 8th Grade Methamphetamine Use Dif %
Kent County increase/decrease over time: -2% -100.0% Kent County increase/decrease over time: 1% 36.8%
MD increase/decrease over time: 0.0% 0.0% MD increase/decrease over time: -1% -53.8%
10th Grade Methamphetamine Use 12th Grade Methamphetamine Use
2001 2002 2004 2007 2001 2002 2004 2007
Kent County 5.5% 5.2% 3.9% 10.6% Kent County 0.0% 7.5% 3.2% 2.3%
MD 2.2% 2.2% 1.8% 1.4% MD 1.8% 2.1% 1.9% 1.6%
% diff, KC10th Graders reporting Methamphetamine Use, last 30 days
% of vs MD 60.0% 57.7% 53.8% % % of KC vs MD
diff, 12th Graders reporting Methamphetamine Use, last 30 days
72.0% 40.6%
11.0% 7.5%
8.3% 5.6%
5.5% Kent County 3.8%
MD Kent County
MD
2.8% 1.9%
0% 0%
2001 2002 2004 2007 2001 2002 2004 2007
10th Grade Methamphetamine Use Dif % 12th Grade Methamphetamine Use Dif %
Kent County increase/decrease over time: 5% 92.7% Kent County increase/decrease over time: 2% incr.
MD increase/decrease over time: -1% -36.4% MD increase/decrease over time: -0% -11.1%
Source: Maryland Adolescent Survey (2001-2007), GOC tables
14. Trends in Use of any Drug other than Tobacco or Alcohol: Percent of Students reporting use in the last 30 days
6th Grade Any Drug other than Alcohol or Tobacco 8th Grade Any Drug other than Alcohol or Tobacco
2001 2002 2004 2007 2001 2002 2004 2007
Kent County 10.5% 6.1% 4.1% 0.8% Kent County 13.9% 17.6% 15.9% 13.2%
MD 4.5% 3.7% 4.2% 3.6% MD 15.2% 11.4% 11.3% 8.6%
% of 6th Grader KC vs MD Use of Any Drug other than Alcohol or Tobacco, last 30 days
% diff, reporting 57.1% 39.3% -2.4% % of 8th% diff, KC vs MD Use of Any Drug other than Alcohol or Tobacco, last 30 days
Grader reporting -9.4% 35.2% 28.9%
50.0% 50.0%
37.5% 37.5%
25.0% Kent County 25.0% Kent County
MD MD
12.5% 12.5%
0% 0%
2001 2002 2004 2007 2001 2002 2004 2007
6th Grade Any Drug (ex. Tob. & Alc.) Dif % 8th Grade Any Drug (ex. Tob. & Alc.) Dif %
Kent County increase/decrease over time: -10% -92.4% Kent County increase/decrease over time: -1% -5.0%
MD increase/decrease over time: -0.9% -20.0% MD increase/decrease over time: -7% -43.4%
10th Grade Any Drug other than Alcohol or Tobacco 12th Grade Any Drug other than Alcohol or Tobacco
2001 2002 2004 2007 2001 2002 2004 2007
Kent County 46.7% 27.0% 30.1% 18.2% Kent County 33.4% 29.5% 28.7% 32.3%
MD 24.3% 21.3% 19.6% 17.1% MD 28.2% 26.2% 26.0% 24.0%
% of 10th% diff, KC vs MD Use of Any Drug other than Alcohol or Tobacco, last 30 days
Grader reporting 48.0% 21.1% 34.9% % diff, KC vs MD 15.6% 11.2% 9.4%
% of 12th Grader reporting Use of Any Drug other than Alcohol or Tobacco, last 30 days
50.0% 50.0%
37.5% 37.5%
Kent County
25.0% Kent County 25.0%
MD MD
12.5% 12.5%
0%
0%
2001 2002 2004 2007
2001 2002 2004 2007
10th Grade Any Drug (ex. Tob. & Alc.) Dif % 12th Grade Any Drug (ex. Tob. & Alc.) Dif %
Kent County increase/decrease over time: -29% -61.0% Kent County increase/decrease over time: -1% -3.3%
MD increase/decrease over time: -7% -29.6% MD increase/decrease over time: -4% -14.9%
Source: Maryland Adolescent Survey (2001-2007)
15. Trends in 6th Grade Use of Beer/Wine, Liquor, Methamphetamine, Any Drug Other Than Alcohol or Tobacco:
Percent of Students reporting use in the last 30 days
6th Grade Beer/Wine 6th Grade Liquor
2001 2002 2004 2007 2001 2002 2004 2007
Kent County 15.8% 6.6% 4.1% 5.3% Kent County 6.9% 2.2% 2.5% 2.3%
MD 5.7% 4.4% 4.7% 3.3% MD 2.7% 1.8% 2.4% 1.3%
% of 6th Graders Reporting Use of Beer/Wine, last 30 Days % of 6th Graders Reporting Use of Liquor, last 30 Days
20.0% 20.0%
15.0% 15.0%
10.0% 10.0%
Kent County Kent County
MD MD
5.0% 5.0%
0% 0%
2001 2002 2004 2007 2001 2002 2004 2007
6th Grade Beer/Wine # % 6th Grade Liquor # %
Kent County increase/decrease over time: -10.5% -66.5% Kent County increase/decrease over time: -4.6% -66.7%
MD increase/decrease over time: -2.4% -42.1% MD increase/decrease over time: -1.4% -51.9%
6th Grade Methamphetamine 6th Grade Any Drug Other Than Alcohol or Tobacco
2001 2002 2004 2007 2001 2002 2004 2007
Kent County 1.6% 0.0% 0.0% 0.0% Kent County 10.5% 6.1% 4.1% 0.8%
MD 0.5% 0.4% 0.3% 0.5% MD 4.5% 3.7% 4.2% 3.6%
% of 6th Graders Reporting Use of Methamphetamine, last 30 Days % of 6th Graders Reporting Use of Any Drug Other Than Alcohol or Tobacco, last 30 Days
20.0% 20.0%
15.0% 15.0%
10.0% 10.0%
Kent County Kent County
MD MD
5.0% 5.0%
0% 0%
2001 2002 2004 2007 2001 2002 2004 2007
6th Grade Methamphetamine # % 6th Grade Any Drug Other Than Alc. or Tob. # %
Kent County increase/decrease over time: -1.6% -100.0% Kent County increase/decrease over time: -9.7% -92.4%
MD increase/decrease over time: 0.0% 0.0% MD increase/decrease over time: -0.9% -20.0%
Source: Maryland Adolescent Survey (2001-2007)
16. Trends in 8th Grade Use of Beer/Wine, Liquor, Methamphetamine, Any Drug Other Than Alcohol or Tobacco:
Percent of Students reporting use in the last 30 days
8th Grade Beer/Wine 8th Grade Liquor
2001 2002 2004 2007 2001 2002 2004 2007
Kent County 14.9% 30.0% 20.1% 19.9% Kent County 10.7% 23.4% 16.5% 15.9%
MD 20.0% 14.3% 14.2% 10.3% MD 14.3% 10.1% 9.8% 8.0%
% of 8th Grader Reporting Use of Beer/Wine: Last 30 Days % of 8th Grader Reporting Use of Liquor: Last 30 Day Use
30.0% 30.0%
22.5% 22.5%
15.0% 15.0%
Kent County Kent County
MD MD
7.5% 7.5%
0% 0%
2001 2002 2004 2007 2001 2002 2004 2007
8th Grade Beer/Wine # % 8th Grade Liquor # %
Kent County increase/decrease over time: 5.0% 33.6% Kent County increase/decrease over time: 5.2% 48.6%
MD increase/decrease over time: -9.7% -48.5% MD increase/decrease over time: -6.3% -44.1%
8th Grade Methamphetamine 8th Grade Any Drug Other Than Alcohol or Tobacco
2001 2002 2004 2007 2001 2002 2004 2007
Kent County 1.9% 3.9% 4.3% 2.6% Kent County 13.9% 17.6% 15.9% 13.2%
MD 1.3% 1.0% 1.3% 0.6% MD 15.2% 11.4% 11.3% 8.6%
% of 8th Graders Reporting Use of Methamphetamine, Last 30 Days % of 8th Graders Reporting Use of Any Drug, Other Than Alcohol & Tobacco, Last 30 Days
30.0% 30.0%
22.6% 22.5%
15.3% 15.0%
Kent County Kent County
MD MD
7.9% 7.5%
0.5% 0%
2001 2002 2004 2007 2001 2002 2004
8th Grade Methamphetamine # % 8th Grade Any Drug Other Than Alc. or Tob. # %
Kent County increase/decrease over time: 0.7% 36.8% Kent County increase/decrease over time: -0.7% -5.0%
MD increase/decrease over time: -0.7% -53.8% MD increase/decrease over time: -6.6% -43.4%
Source: Maryland Adolescent Survey (2001-2007)
17. Trends in 10th Grade Use of Beer/Wine, Liquor, Methamphetamine, Any Drug Other Than Alcohol or Tobacco:
Percent of Students reporting use in the last 30 days
10th Grade Beer/Wine 10th Grade Liquor
2001 2002 2004 2007 2001 2002 2004 2007
Kent County 60.9% 34.8% 36.6% 36.4% Kent County 49.8% 31.0% 34.6% 34.8%
MD 32.2% 31.1% 26.3% 22.5% MD 27.6% 26.3% 24.6% 22.1%
% of 10th Graders Reporting Use of Beer/Wine, Last 30 Days % of 10th Graders Reporting Use of Liquor, Last 30 Days
70.0% 70.0%
52.5% 52.5%
35.0% 35.0%
Kent County Kent County
MD MD
17.5% 17.5%
0% 0%
2001 2002 2004 2007 2001 2002 2004 2007
10th Grade Beer/Wine # % 10th Grade Liquor # %
Kent County increase/decrease over time: -24.5% -40.2% Kent County increase/decrease over time: -15.0% -30.1%
MD increase/decrease over time: -9.7% -30.1% MD increase/decrease over time: -5.5% -19.9%
10th Grade Methamphetamine 10th Grade Any Drug Other Than Alcohol or Tobacco
2001 2002 2004 2007 2001 2002 2004 2007
Kent County 5.5% 5.2% 3.9% 10.6% Kent County 46.7% 27.0% 30.1% 18.2%
MD 2.2% 2.2% 1.8% 1.4% MD 24.3% 21.3% 19.6% 17.1%
% of 10th Graders Reporting Use of Methamphetamine, Last 30 Days % of 10th Graders Reporting Use of Any Drug Other Than Alcohol & Tobacco, Last 30 Days
70.0% 70.0%
52.6% 52.5%
35.3% 35.0%
Kent County Kent County
MD MD
17.9% 17.5%
0.5% 0%
2001 2002 2004 2007 2001 2002 2004 2007
10th Grade Methamphetamine # % 10th Grade Any Drug Other Than Alc. or Tob. # %
Kent County increase/decrease over time: 5.1% 92.7% Kent County increase/decrease over time: -28.5% -61.0%
MD increase/decrease over time: -0.8% -36.4% MD increase/decrease over time: -7.2% -29.6%
Source: Maryland Adolescent Survey (2001-2007)
18. Trends in 12th Grade Use of Beer/Wine, Liquor, Methamphetamine, Any Drug Other Than Alcohol or Tobacco:
Percent of Students reporting use in the last 30 days
12th Grade Beer/Wine 12th Grade Liquor
2001 2002 2004 2007 2001 2002 2004 2007
Kent County 49.9% 55.6% 51.1% 40.8% Kent County 40.7% 45.4% 47.9% 41.5%
MD 42.4% 38.8% 38.5% 36.3% MD 37.5% 34.5% 36.1% 36.0%
% of 12th Graders Reporting Use of Beer/Wine, Last 30 Days % of 12th Graders Reporting Use of Liquor, Last 30 Days
60.0% 50.0%
45.0% 37.5%
30.0% 25.0%
Kent County Kent County
MD MD
15.0% 12.5%
0% 0%
2001 2002 2004 2007 2001 2002 2004 2007
12th Grade Beer/Wine # % 12th Grade Liquor # %
Kent County increase/decrease over time: -9.1% -18.2% Kent County increase/decrease over time: 0.8% 2.0%
MD increase/decrease over time: -6.1% -14.4% MD increase/decrease over time: -1.5% -4.0%
12th Grade Methamphetamine 12th Grade Any Drug Other Than Alcohol or Tobacco
2001 2002 2004 2007 2001 2002 2004 2007
Kent County 0.0% 7.5% 3.2% 2.3% Kent County 33.4% 29.5% 28.7% 32.3%
MD 1.8% 2.1% 1.9% 1.6% MD 28.2% 26.2% 26.0% 24.0%
% of 12th Graders Reporting Use of Methamphetamine, Last 30 Days % of 12th Graders Reporting Use ofAny Drug, Other Than Alcohol & Tobacco,
60.0% 60.0%
45.0% 50.8%
30.0% 41.5%
Kent County Kent County
MD MD
15.0% 32.3%
0% 23.0%
2001 2002 2004 2007 2001 2002 2004 2007
12th Grade Methamphetamine # % 12th Grade Any Drug Other Than Alc. or Tob. # %
Kent County increase/decrease over time: 2.3% incr Kent County increase/decrease over time: -1.1% -3.3%
MD increase/decrease over time: -0.2% -11.1% MD increase/decrease over time: -4.2% -14.9%
Source: Maryland Adolescent Survey (2001-2007)
19. 12th Grade Use of Selected Prescription Drugs in the Last Year
Kent County, Maryland and the State of Maryland
12th Grade Amphetamines 12th Grade Barbituates & Tranquilizers
2001 2002 2004 2007 2001 2002 2004 2007
Kent County 8.2% 13.5% 16.0% 10.0% Kent County 4.8% 9.9% 6.4% 5.4%
MD 9.3% 9.5% 8.1% 5.4% MD 5.1% 5.3% 5.2% 4.2%
% of 12th Graders Reporting Use of Amphetamines, Last 12 months % of 12th Graders Reporting Use of Barbituates & Tranquilizers, Last 12 months
20.0% 20.0%
15.0%
10.0%
Kent County Kent County
MD MD
5.0%
0% 0%
2001 2002 2004 2007 2001 2002 2004 2007
12th Grade Amphetamines # % 12th Grade Barbituates & Tranquilizers # %
Kent County increase/decrease over time:
time:1.8% 22.0% Kent County increase/decrease over time: 0.6% 12.5%
MD increase/decrease over time: -3.9% -41.9% MD increase/decrease over time: -0.9% -17.6%
12th Grade Narcotics 12th Grade Ritalin
2001 2002 2004 2007 2001 2002 2004 2007
Kent County 7.5% 11.6% 9.6% 14.6% Kent County 6.6% 9.8% 5.3% 0.0%
MD 6.4% 7.3% 6.9% 6.9% MD 3.2% 3.4% 3.4% 3.1%
% of 12th Graders Reporting Use of Narcotics, Last 12 months % of 12th Grade Reporting Use of Ritalin, Last 12 months
15.0% 20.0%
11.3% 15.0%
7.5% 10.0%
Kent County Kent County
MD MD
3.8% 5.0%
0% 0%
2001 2002 2004 2007 2001 2002 2004 2007
12th Grade Narcotics # % 12th Grade Ritalin # %
Kent County increase/decrease over time:
time:7.1% 94.7% Kent County increase/decrease over time: -6.6% -100%
MD increase/decrease over time: 0.5% 7.8% MD increase/decrease over time: -0.1% -3%
Source: Maryland Adolescent Survey (2001-2007)
Prepared by: Kent County Adolescent Substance Abuse Coalition, Kent County Behavioral Health Prevention Office, Kent County Sheriff's Office
Maryland Adolescent Survey asks questions about non-medical use of the following prescription drugs "Amphetamines (uppers, bennies, speed, dexies);
Barbituates and/or tranquilizers (Downers, Reds, Valium); Narcotics (Codeine, Morphine, Methadone, Percodan); Ritalin."
[MAS may be under reporting non-medical prescription drug use, since many prescription drugs are not named in the survey]