SlideShare a Scribd company logo
1 of 23
Download to read offline
5
The epidemiology of obesity
ALLISON M. HODGE
PAUL Z. ZIMMET
Epidemiology provides a basis for understanding the extent and public
health implications of obesity within and between populations. Essential for
the development of a framework for global comparisons of prevalence and
incidence of obesity and overweight, is the standardization of their defi-
nition and measurement. Thus the contribution of epidemiology to such a
need is addressed first. This chapter also discusses the dramatic rise in preva-
lence of obesity in developing and newly developed nations that has occur-
red concurrently with modernization of lifestyle.
DEFINITIONS OF OBESITY AND ITS MEASUREMENT
The importance of obesity as a risk factor for a number of diseases including
non-insulin-dependent diabetes (NIDDM), cardiovascular disease (CVD),
hypertension, gallstones and certain cancers, is well documented. Obesity is
defined as a condition in which there is an excess of body fat, as opposed to
overweight, defined as a condition in which the body weight exceeds a
reference level. The level at which body fat content is considered excessive is
based upon the excess morbidity and mortality associated with increasing
body fat content. However, there is still no international standard method
used for measurement of body fat, nor are there reference levels with which
to compare different measures which have been widely accepted. This lack
of consistency has hindered comparison of the prevalence of obesity among
different populations and the study of secular trends.
At present, anthropometric measurements are all that is practicable for
epidemiological studies. Height and weight are the most commonly used
parameters for assessing fatness but skinfold thicknesses are also used
(Durnin and Womersley, 1974). A number of methods have been developed
for interpreting weight and height. Relative weight compares an individual's
weight with an 'optimum' weight-for-height. Metropolitan Life Insurance
tables (1959) were the first widely used source of 'optimum' weight, the
levels being based on the mortality rates experienced by insured subjects in
the United States. The population from which these figures were derived
was not representative of the total population of the US, or indeed any other
Baillidre"s Clinical Endocrinology and Metabolism-- 577
Vol. 8, No. 3, July 1994 Copyright © 1994, by Bailli~reTindall
ISBN 0-7020-1851-1 All rights of reproduction in any form reserved
578 A. M. HODGE AND P. Z. ZIMMET
nation, yet the Metropolitan Life figures have been widely used as a
standard for many years.
Other studies have used population specific standards for 'optimum'
weight (Dhurandhar and Kulkarni, 1992) but the level of relative weight
considered to represent obesity has also varied between 120% (Dhurandar
and Kulkarni, 1992) and 140% (Aluli, 1991). Many studies have defined
overweight and severe overweight as greater than or equal to the 85th and
95th percentiles respectively of the distribution of height and weight for men
and non-pregnant women 20-29 years of age in the NHANES II study. This
approach is based on the assumption that beyond the upper age limit of the
reference group, increases in weight reflect fat accumulation.
Quetelet's index or BMI (weight (kg)/height (m)2) is now the commonly
used parameter by which fatness is classified but other body mass indices
using exponentials other than 2 have also been estimated (Abraham and
Johnson, 1980; Lopez and Masse, 1992). Body mass index is an indicator of
body fat content with correlation coefficients generally above 0.5 (Bray,
1992).
Some BMI classification systems have different cut-off points depending
on age and sex, while others have a single value. The simplest classification,
recommended by Garrow (1983), Bray (1992) and the National Heart
Foundation of Australia (NHF, 1983, 1990), has obesity as a BMI greater
than 30 kg/m2 for both sexes. The WHO classification has three levels of
obesity, and considers the major risk to be when BMI > 30 kg/m2 (World
Health Organization, 1990). Canada uses a similar, simple system, but
obesity begins at BMI >27kg/m 2 (Canadian Guidelines for Healthy
Weights, 1988).
While the decision as to where the lower limit of obesity should be is arbi-
trary, the level must reflect an increasing risk of morbidity and/or mortality.
Keys (1980) has looked at linear and quadratic relationships between BMI
and probability of death in a number of populations. The linear relationships
showed a decrease in probability of death with increasing BMI but a quadra-
tic relationship fitted the data better. These U-shaped curves indicated that
the probability of death began to rise steeply at BMIs between about 29 and
34 in different populations. Stevens et al (1992) found a similar relationship
in black, but not white, men in the Charleston Heart Study. From their
figures it appears that the risk of coronary heart disease death rose sharply
when BMI was greater than about 35 kg/m2. Figure i shows the age-
standardized rates of hypertension, diabetes mellitus, hypercholesterol-
aemia (i> 5.5 mmol/1) and hypertriglyceridaemia (I>2.0 mmol/1) for increas-
ing levels of BMI in Western Samoan men and women from our 1991 survey.
These plots indicate that no specific level of BMI is associated with a sudden
increase in CVD risk factor prevalence but above a BMI of 25-31 kg/m2, risk
is relatively higher. More specific cut-points are probably not justified. A
simple classification such as those above, which can be applied to all ages and
sexes, would be sufficient to show effects of obesity on health and to
compare populations.
THE EPIDEMIOLOGY OF OBESITY
Prevalence (%)
50
579
Hypercholesterolemia
I Hypertriglycerldemla
4 0 - -
~< Diabetes 7 */
[] Hypertenslo~
3o
20
10
0
22 22-24 24-26 26-28 28-30 30-32 32-34 34-36 >36
(a) BMI
Prevalence (%)
5O
40
30
-~ Hypercholesterolemia
--~-- Hy/~ke
rtrig lyceridem ia
D/abk~ke
s
2O
J
10
O~ I i ~ I I t I
22 22-24 24-26 26-28 28-30 30-32 32-34 34-36 ~36
(b) BMI
Figure 1. The prevalence of cardiovascular disease risk factors and non-insulin-dependent
diabetes (NIDDM) by BMI in Western Samoan men (a) and women (b).
580 A.M. HODGE AND V. Z. ZIMMET
FAT DISTRIBUTION
The measurement and definition of fat distribution has become an important
issue for research, with many studies over the last 20-30 years indicating that
body-fat distribution is a risk factor for NIDDM, hypertension and CVD
independent of general obesity. Vague (1956) first identified the effects of
fat distribution, coining the terms android and gynoid fat distributions to
identify male and female fat distribution patterns respectively. Fat distri-
bution patterns have been identified by a number of terms which are not well
defined. Central, upper body, gynoid and abdominal obesity appear to be
used somewhat synonymously to refer to fat located in the trunk or
abdomen, rather than in lower body or peripheral deposits. Most of the
studies examining the effects of fat distribution on health outcomes have
used skinfolds, usually subscapular and triceps (Baumgartner et al, 1987;
Donahue et al, 1987; Reichley et al, 1987; Selby et al, 1989; Fontbonne et al,
1992; Yao et al, 1992; Stern et al, 1983) or waist-hip circumference ratio
(Hartz et al, 1984; Folsom et al, 1989a; Lundgren et al, 1989; Van Noord et
al, 1990; Iso et al, 1991; Shelgikar et al, 1991; Bonora et al, 1992; Lackland et
al, 1992; McKeigue et al, 1992; Mykk~inen et al, 1992; Shetterly et al, 1993;
Stevens et al, 1992; Terry et al, 1992) as the measure of body fat distribution.
Haffner et al (1987) differentiated between upper body obesity as measured
by WHR and centralized obesity as measured by subscapular/triceps skin-
fold thickness ratio (STR). Both were found to be independently associated
with NIDDM and CVD risk factor levels, thus the authors concluded that
they measured different things and if only one measure was to be made,
WHR was preferable to STR.
Historically there has been a tendency to move from skinfold to circum-
ference measures. Although specific sites have been identified for skinfold
measurements, the method is not well standardized and large interobserver
variations occur. Waist-hip circumference ratio (WHR) appears to be easier
to measure (van der Kooy and Seidell, 1993), especially in obese subjects,
but the levels at which waist and hips should be measured have not been
consistent and large variations in the ratio may result from small variations
in measurement site (Alexander and Dugdale, 1990).
More recent work utilizing computed tomography (CT) and other scans
on the truncal area have indicated that it is the intra-abdominal adipose
tissue area, rather than subcutaneous fat that is most closely related to
metabolic disorders (Deprds et al, 1989; Zamboni et al, 1992). Waist
circumference has been found to correlate better with intra-abdominal adi-
pose area by CT scan in both men and women than does WHR (Ferland et
al, 1989; Depr6s et al, 1991; Busetto et al, 1992; Koester et al, 1992) and
Seidell et al (1989) and Mueller et al (1991) have shown waist circumference
in women to be as good as WHR at explaining variations in CVD risk factor
levels, while in men waist circumference was more strongly correlated with
CVD risk factors than was WHR (Seidell et al, 1992). A new index of fat
distribution, the conicity index, has been described by Valdez et al (1993).
The conicity index is calculated from height, weight and waist girth and
appears to predict CVD risk as well as does WHR, but whether it will be any
THE EPIDEMIOLOGY OF OBESITY 581
more useful remains to be seen. Sagittal abdominal diameter is also highly
correlated with intra-abdominal adipose area (Kvist et al, 1988; Armellini et
al, 1993; van der Kooy and Seidell, 1993). As yet there is no standard
anthropometric method for measurement of sagittal diameter and in most
cases it has been derived from CT scan. Further studies are required to
determine the most appropriate method for measurement of sagittal dia-
meter in the field and to determine whether it is a good predictor of CVD
risk factors, NIDDM and mortality.
For epidemiological studies, waist and hip circumferences still appear to
be the most useful measurements but it may be more useful to analyse them
separately rather than as a ratio. While waist and hip measurements con-
tinue to be used it is important that standard methods are used to allow
comparison across populations. It is suggested that waist circumference
should be measured at a point halfwaybetween the lower costal margin and
the iliac crest, while hip circumference should be measured as the maximum
circumference around the buttocks posteriorly and indicated anteriorly by
the symphysis pubis (Dowse and Zimmet, 1992). Use of arbitrary cut-off
points for WHR is not appropriate unless these levels have been shown to be
related to increased risk of morbidity or mortalityin the population to which
they are to be applied.
Fat distribution may vary between ethnic groups and recent work in Paci-
fic populations has shown that large differences in BMI can occur without
differences in WHR. In Western Samoa, Polynesians from three geographic
locations with varying degrees of modernization were surveyed, mean BMI
and the prevalence of NIDDM increased with increasing modernization but
WHR did not vary. Waist and hip circumferences varied significantly
between locations, suggesting that additional adipose tissue was distributed
evenly in Samoans. A similar observation has been noted in Melanesians in
Papua New Guinea (PNG), where six sites varying in levels of modernity
were surveyed. Only minor differences in WHR were noted while BMI
varied significantly between populations. In obese Micronesian Nauruans
the correlation between WHR and BMI was lower than reported for other
populations and subscapular: triceps skinfold ratio (STR) was relatively low
compared with other leaner populations (Hodge et al, 1993), suggesting that
Nauruans may deposit fat more evenly than other populations. This
suggestion is supported by the fact that waist and hip circumferences were
individually much more highly correlated with weight and BMI than was
WHR (Hodge et al, 1993). Other studies have shown that for similar levels
of BMI there are differences in measures of fat distribution between ethnic
groups for black versus white men in the US (Lackland et al, 1992), for
South Asian versus European men and women (McKeigue et al, 1992) and
for Afro-Caribbean versus European men in the French Telecom Study
(Fontbonne et al, 1992). When Australian Aboriginal women were com-
pared with white women of the same BMI they had a higher body fat content
and it was more centrally located (Rutishauser and McKay, 1986).
582 A. M. HODGE AND P. Z. ZIMMET
8
O
;>
O
8
;>
[..,
t".l
~ m
•
: I~,
•~ ~-
a
~ .~<
O O
t~
A
I[
o
N ~
II
t~
r~
~ -s ~ ..~ m
z
< ~
¢~O 0o o ~_.
~ ~ ~ ©
~ ,..,
~,-, ~ ,.., ~2 ~
=
,,6od
©
A
II
©
•~ ~ O tt3
1>~ r"-
O
0~
z
O
o O
A
II
©
O
O
e-,~,
z
.o
O
z
o
¢q.~
2
~o
THE EPIDEMIOLOGY OF OBESITY 583
Ak~
0
~t¢'3
,. i <'7'?
~,-~ t¢3 t¢3
t~
= ,-,E
o o O
N N~:
~ oo t--
"~ c5 ~6
~,~
&Z~ A
© ©
AX~,~ ^ ^X ~.= .:
II ~ II ~ ~>~ "+~,+
~..~ ~ ~ o~..~
.~ -
.,..~, t~ ,..
='~
,¢ ~ .~
r~,~.~ o~~ ~ '~
o,'~ ~ .o~
oo
~ ~
r.o ~ "O
A~
tl
O
?-~
cq~
t'q
A
©
e,/)~
O +~
.
~E
.,¢
I'-.-
t~
584
EPIDEMIOLOGY OF OBESITY
A. M. HODGE AND P. Z. ZIMMET
Western populations
Table 1 shows the prevalence of obesity and overweight as defined by
various criteria in a number of Western populations. These data illustrate
some of the features associated with the distribution of obesity within and
between populations. Where the NHANES II criteria for severe overweight
are used it is assumed that this category is equivalent to obesity. Temporal
trends are evident in the study of Danish draftees, showing increasing
prevalence of obesity in successive birth cohorts (S0rensen and Price, 1990).
The Australian studies (National Heart Foundation, 1983, 1990) show small
increases in the rate of obesity in both men and women between 1983 and
1989 and, although the age groups studied are slightly different, this is likely
to be a real effect. The rates for severe overweight from the NHANES I
(1971-74) and NHANES II (1976-80) survey indicate small increases in
prevalence of obesity in men and women in the United States although the
criteria used differ between these reports. Kuczmarski (1992) has compared
the results of the two surveys using common cut-off points which gives an
increase of only 1.2 percentage points. Within certain groups the increase
was much higher, for example in black males the prevalence of severe over-
weight rose by six percentage points between the two surveys. A gender bias
towards higher rates of obesity in females than males is apparent in most
populations, even though the lower limit of severe overweight or obesity is
slightly higher in females using the NHANES II criteria.
Ethnic comparisons are reported by Pawson et al (1991), Hazuda et al
(1991) and Kuczmarski (1992) for different groups in the US. Data from the
Hispanic Health and Nutrition survey (Pawson et al, 1991) show higher
prevalence of obesity in Mexican American men than Cuban men, but in
women the difference is greater between Mexican Americans and Puerto
Ricans. Kuczmarski (1992) presents data comparing the Hispanic groups
with American blacks and whites. Black women had the highest prevalence
of obesity, and Cuban women the lowest, with white Americans of both
sexes also being relatively lean. The Cubans were one of the few groups
where men were more likely to be obese than women. The San Antonio
Heart Study (Hazuda et al, 1991) also compares obesity in Mexican Ameri-
cans and non-Hispanic whites in a geographically defined sample area.
Mexican American men and women were more obese than white Ameri-
cans, especially among women where the difference was more than twofold.
Two studies each compared three Western populations (Millar and
Stephens, 1987; Laurier et al, 1992). In both studies the prevalence of
obesity was higher in the US. Table i does not contain any age comparisons
but figures for three groups of young men in Denmark (S0rensen and Price,
1990), Italy (Zenere et al, 1992) and Portugal (Castro et al, 1992) indicate
very low rates of obesity within these younger age groups.
THE EPIDEMIOLOGY OF OBESITY 585
Non-Western populations
Results for the prevalence of obesity from non-Western populations are
summarized in Table 2. These data include information on the effect of age
on the prevalence of obesity in a number of populations. Among a group of
predominantly Pima Indians, the prevalence of obesity in men and women
tended to increase over the first three decades of adulthood and then
decline, although there was a high prevalence in the oldest group of men
(Knowler et al, 1991), Japanese men of 45--69years studied in Japan, Hawaii
and California, showed a tendency for obesity to decline in prevalence with
age (Curb and Marcus, 1991). Among a small, volunteer sample of adults in
Bombay the prevalence of obesity increased with age group, but the age
breakdown was not adequate to show a fall in prevalence in the oldest age
groups (Dhurandar and Kulkarni, 1992). In four groups, from different
countries of origin, surveyed in Israel there was a clear trend toward
increased obesity in women over 50 years compared with younger women,
but the trend was less marked in men (Kaufman et al, 1992).
Ethnic comparisons performed within similar environments indicate pos-
sible genetic effects on susceptibility to obesity. Beckles et al (1985)
reported on three ethnic groups in Port-of-Spain, Trinidad. In this study,
men and women of African origin were more likely to be obese than those of
mixed (Afro-European) or Indian origin. In Israel, men and women born
locally were compared with those born in Asia, North Africa or Europe/
United States (Kaufman et al, 1992). The prevalence of obesity did not vary
much in men but among women there were big differences between ethnic
groups, the relative ranking depended on age, but in both age groups the
women of North African origin were the most obese.
Migration studies look at members of the same ethnic group living in
different environments. The study of Japanese men (Curb and Marcus,
1991) showed that Japanese men living in Hawaii or California suffer from a
greater prevalence of obesity than those remaining in Japan. McGarvey
(1991) has studied the effect of migration and westernization in Samoans
living in Western Samoa (most traditional), American Samoa (less
traditional) and Hawaii (urban). The prevalence of obesity increased with
changes from more to less traditional; in men there was a continual gradient
across four locations, while in women there was a big jump from Western
Samoa to American Samoa, followed by small increases with further
westernization. The prevalence of obesity in some of these non-European
populations is extremely high, especially in the Samoans (McGarvey, 1991),
the Pima Indians (Knowler et al, 1991) and the women from Trinidad
(Beckles et al, 1985).
Pacific and Indian Ocean Island populations
We have collected data on the prevalence of obesity in ten Pacific Island
populations and in the multiethnic populations of the Indian Ocean islands
of Mauritius and Rodrigues over the last 16 years which is presented in
Table 3. The most striking feature of this table is the extremely high age-
586 A. M. HODGE AND P. Z. ZIMMET
©
8
0
2-
e~
.~e~
c~ t"-,I
m e~
© ,"
A A~
II II
'ft.
"r- 0
'~ ~ .~ vo~
~ ~ °~o
c¢~ t--I cq
m~
A~
~A~
©
Z
t¢3
~m
m~
II A~
0
0
.d'~ r".-
~ < ~
.o~m~
mZ
<~
¢q
A~
II
,.o
©
<
A~
II
O
~E
.~" c,
O
THE EPIDEMIOLOGY OF OBESITY 587
ea
~ a4 d ,-; 4 A
~ m m ,---* ,a:~ V
0
M
e-............-,-..-~
^
,, =~ o
o0 0
O
(/) .~
¢q
G~
G~ t~
e~
-}- v...~o~
~o6~
,,60~
~t'¢3
~T~. ~.
<
%
A~
e-,
O
;>
O
©
>..
A
o~
t"q
~2
I.~ t-,q tr3
D
X
%
A
II
©
.=.
"O
©
.-~A~
=
t'-q
t¢3
O
X3:
%
~5
A
II
2
©
¢..)
¢..q
¢.,q
t'¢3
G~
K
¢..)
O
<
r~
588 A. M. HODGE AND P. Z. ZIMMET
Table 3. Age-standardized* prevalence of obesity (body mass index >30kg/m2)
adults aged 25-69 years in various Pacific and Indian island populations.
Age-standardizedprevalence
Population Men Women
Micronesians
Nauru 1975/76 69.4 61.7
1982 67.5 76.4
1987 64.8 70.3
Kiribati 1981--Urban 29.8 34.5
--Rural 11.8 13.1
Polynesians
Western Samoa 1978---Urban 38.8 59.1
--Rural 17.7 37.0
Western Samoa 1991--Urban 5K4 76.8
--Rural 41.5 59.2
Wallis Island 1980~Urban 35.9 65.4
--Rural 24.1 48.1
Raratonga--Cook Islands 1980 39.0 49.1
Nuie 1980 21.0 36.0
Tuvalu 1977 24.0 47.5
LoyaltyIslands--New Caledonia 1979 5.0 31.3
Melanesians
Papua New Guinea 1991--Urban coastal 36.3 54.3
--Rural coastal 23.9 18.6
--Highlands 4.7 5.3
Fiji 1980--Urban 17.8 40.8
--Rural 9.4 24.2
LoyaltyIslands--New Caledonia 1979 10.5 25.0
Asian Indians
Mauritius 1987 3.3 11.3
1992 5.1 16.2
Fiji 1980--Urban 4.3 20.0
--Rural 2.8 9.5
Creoles
Mauritius 1987 3.8 13.3
1992 8.0 20.7
Rodrigues 1992 9.8 31.1
Chinese
Mauritius 1987 6.2 4.9
1992 2.1 6.0
Australians 1989 Urban 11.1 12.7
*Age-standardizedto Segi's world population.
standardized prevalence of obesity observed in many of these populations in
comparison with the Australian population. Urban versus rural differences
in the prevalence of obesity are highlighted in Kiribati, Papua New Guinea,
Fiji, Western Samoa and Polynesians in Wallis Islands or Noumea. Ethnic
differences are evident in Mauritius and Fiji where Asian Indians tend to
suffer less from obesity than Creoles (African origin) or Melanesians.
Chinese in Mauritius show a low prevalence of obesity. Temporal trends can
be seen in Mauritius (1987-1992) and Western Samoa (1978-1991) where
marked increases in the prevalence of obesity have occurred, especially in
rural Western Samoa.
THE EPIDEMIOLOGY OF OBESITY 589
Prevalence (%)
°°[
40
~ Mauritius Indian '92
Western Samoa R
/  + Westor°Samoa',,O
30
20
10
0 P I I
25-34 35-44 45-54 55-64 65-69
Age group (years)
(a)
Prevalence (%)
5O
Mauritius Indian '92
-+- Western Samoa '91 R
40
-~ Western Samoa '91 U
Australia '89
~ ~ ~ Nauru 'AZ
30
20
]~
I I
25-34 35-44 45-54
Age group (years)
* R=rural, U=urban
(b)
55-64 65-69
Figure 2. The prevalence of obesity (BMI > 30 kg/m2) by age group in men (a) and women (b)
from different populations.
590 A. M. HODGE AND P. Z. ZIMMET
Effects of age
Some examples of changes in the prevalence of obesity with age in men and
women are presented in Figure 2. The pattern of increasing obesity up to
middle-age followed by a plateau or decrease in prevalence in populations
other than Nauruans is commonly found and may be related to greater
weight loss in older subjects (Rissanen et al, 1988; McGarvey, 1991).
Effects of modernization, acculturation and socioeconomic status
Rural-urban comparisons and migration studies are used as evidence for an
effect of acculturation or modernization in increasing the prevalence of
obesity. This effect has been attributed to reduced levels of physical activity
and dietary changes that occur with westernization. Decreased physical
activity has been observed in urban compared with rural groups in Kiribati
(King et al, 1984), Western Samoa (Zimrnet et al, 1981), Fiji (Zimmet et al,
1983) and Papua New Guinea. Differences in diet are less clear, while
dietary composition changes as populations become more westernized (to
include more saturated fat and less fibre, thus becoming more energy dense)
the actual intake may not be greater (Taylor et al, 1992). Other factors that
vary with modernization are occupation and education, as well as stresses
from an urban society. In Western Samoa, BMI was positively associated
with educational level and occupation in men, and this contrasts with data in
Western populations (see later).
A modernity score was calculated for subjects in Papua New Guinea
which took into account subject's and father's employment, education level,
type of house in which subject dwelt, proximity of home to a large town, the
period of living in an urban area and an increment based on the spouse's
score. Modernity score was associated with obesity in men and women.
Other studies in Pacific populations have recorded similar findings. In
Ponape, weight increased with modernity score or with increasingly
westernized location (Patrick et al, 1983). In Palau, weight increased slightly
with increasing modernity score, while the increase in subscapular skinfolds
was more dramatic (Labarthe et al, 1973).
In developed countries the situation tends to be reversed (Sobal and
Stunkard, 1989). Lower socioeconomic status is associated with higher rates
of obesity, especially in women, and in the US may be partly responsible for
the higher rates of obesity seen among black and Hispanic populations.
Among black women 25-50 years of age in the US, low socioeconomic status
was independently related with increased BMI, but in men the relationship
was not significant (Croft et al, 1992). Data from NHANES II indicate that
race and poverty status were independent predictors of obesity in women in
the US (Van Itallie, 1985). Hazuda et al (1988) looked at the effect of socio-
economic status and acculturation on obesity in Mexican Americans taking
part in the San Antonio Heart Study. In men increasing acculturation, i.e.
adoption of white American values and attitudes, was associated with a
linear fall in the rate of obesity whilst socioeconomic status had no effect. In
women both acculturation and socioeconomic status were important, the
THE EPIDEMIOLOGY OF OBESITY 591
former more so. Among white Americans in Tecumseh, Michigan, males
with 12 or more years of schooling were fatter than those with less schooling
while in women the results were reversed (Garnet al, 1977). Household
income level was similarly related to obesity. In Australia, lower socio-
economic status is also associated with increased levels of obesity in men and
women (Australian Institute of Health and Welfare, 1992).
Different attitudes towards obesity may be behind these observations. In
Western society obesity is generally not socially acceptable, especially for
women. The pressure to conform to standards set by society appears to be
greater among more affluent groups. The more educated women may also
be more aware of the adverse health consequences of obesity. In Pacific
Islanders obesity was, and in some cases still is, a symbol of wealth and
increased social status (Dowse et al, 1992).
HEALTH CONSEQUENCES OF OBESITY
Obesity and NIDDM
Obesity has long been recognized as a risk factor for NIDDM. The WHO
study group on diabetes has named obesity as the single most important
factor in the development of NIDDM (World Health Organization, 1985).
A number of prospective studies have shown obesity to be related to an
increased incidence of NIDDM; Lundgren et al (1989) in Swedish women,
Ohlson et al (1985) in Swedish men and Modan et al (1986) in Israeli men
and women. Knowler et al (1981) report an increase in the incidence of dia-
betes in Pima Indians from 0.8+0.8 cases/1000 in subjects with BMI
< 20 kg/m2 to 72.2 + 14.5 cases/1000 when BMI/> 40 kg/m2. Tai et al (1992)
found the relative risk for NIDDM in the top versus lowest quartile of BMI
in Chinese adults to be 2.87 over 4 years of follow-up. In US women fol-
lowed up for 8 years the relative risk of NIDDM for BMIs 23-23.9 kg/m2
compared with BMIs <22 kg/m2 was 3.6 (Colditz et al, 1990). Prevalence
studies have also demonstrated associations between obesity and NIDDM
(Hartz et al, 1984; Haffner et al, 1986; Van Noord et al, 1990; Cassano et al,
1992). In Mauritius, odds ratios for NIDDM in the highest versus the lowest
tertile of BMI were between 4.5 and 5.0 in men of different ethnic groups,
the equivalent figures in women were 3.0-9.0 (Dowse et al, 1991). Among
Pimas (Knowler et al, 1981) and Israelis (Modan et al, 1986) obesity was not
related to prevalence of NIDDM, possibly reflecting weight loss associated
with glucose intolerance. Fat distribution indices are also closely related to
the prevalence (Hartz et al, 1984; Haffner et al, 1986; Van Noord et al, 1990;
Cassano et al, 1992) and incidence of NIDDM (Ohlson et al, 1985;
Lundgren et al, 1989), and appear as important as overall obesity.
Obesity and cardiovascular disease
An association between obesity and cardiovascular disease (CVD) is fre-
quently observed in prospective studies (Keys, 1980; Garfinkel, 1985;
592 A. M. HODGE AND P. Z. ZIMMET
Donahue et al, 1987; Tuomilehto et al, 1987; Ducimetiere and Richard,
1989; Fitzgerald and Jarrett, 1992), but it is less clear whether this is a direct
effect or is mediated through the effect of obesity on blood pressure, plasma
lipids, insulin levels or glucose tolerance, all of which in turn, are risk factors
for CVD (Barrett-Connor, 1985). Terry et al (1992) found the relative risk
of death from ischaemic heart disease for an increase of one standard
deviation in BMI, ranged from 1.22 to 1.25 in a 23-year follow-up of over
80 000 white men discharged from the United States Army in 1946-47,
variations in BMI did not contribute to stroke mortality. This study does not
consider other risk factors for CVD. In the US Railroad Study (Yao et al,
1991), BMI was associated with coronary heart disease (CHD) mortality but
the relationship was not significant after adjusting for other risk factors,
while a measure of fat distribution (chest girth/shoulder diameter) remained
significant. In Charleston, US, Stevens et al (1992) found BMI a significant
predictor of all cause and coronary heart disease mortality in black, but not
white men, even when correcting for other risk factors. At the 26-year
follow-up of subjects in the Framingham study obesity was found to be a
significant predictor of CVD, independent of other risk factors (Hubert et
al, 1983). Smoking is an important confounder of the association between
obesity and CHD. In Finnish male smokers the effect of BMI on survival was
not significant, but in non-smokers, survival time decreased with increasing
BMI (Tuomilehto et al, 1987). Cigarette smoking is not always controlled
for and could contribute to inconsistencies between studies. Fat distribution
is also important in relation to CVD (Stokes et al, 1987; Ducimetiere and
Richard, 1989; Yao et al, 1991; Stevens et al, 1992; Terry et al, 1992) and
may in fact be more important than general adiposity (Larsson et al, 1984;
Lapidus et al, 1984; Donahue et al, 1987).
Obesity and dyslipidaemia
A stronger association between general obesity, rather than abdominal
obesity, and dyslipidaemia has been observed in young black and white
adults (Folsom et al, 1989a), in elderly Finns (Mykkfinen et al, 1992), young
Italian men (Bonora et al, 1992) and American men and women
(Baumgartner et al, 1987). Seidell et al (1989) and Reichley et al (1987)
found, to the contrary, that fat distribution was more important than overall
fatness.
Obesity and blood pressure
Both general obesity and fat distribution have been observed to be related to
elevated blood pressure and increased prevalence of hypertension (Hartz et
al, 1984; Folsom et al, 1989a; Iso et al, 1991; Lackland et al, 1992; Seidell et
al, 1992). Overall fatness appears to explain more of the variation in blood
pressure when compared with fat distribution (Baumgartner et al, 1987;
Reichley et al, 1987; Folsom et al, 1989b; Seidell et al, 1989). In a pro-
spective study Selby et al (1989) found baseline BMI and subscapular skin-
fold thickness to be independent predictors of hypertension, with
THE EPIDEMIOLOGY OF OBESITY 593
unadjusted odds ratios of 3.85 and 3.75 respectively for the top versus the
bottom quintile. In another prospective study, Cassano et al (1990) also
found both abdominal and overall fatness predictive of hypertension.
Other conditions associated with obesity
A large American study has shown that the mortality rate for cancer is
increased by obesity, with colorectal and prostate cancers in men and
cancers of the endometrium, gallbladder, cervix, breast and ovary in
women, being more common in obese subjects (Garfinkel, 1985). The
increases in mortality rate for cancer are much smaller than those observed
for coronary heart disease or digestive disease. Obesity has also been found
to be a risk factor for gallbladder disease. In two studies, both BMI and
WHR were associated with gallbladder disease in women (Hartz et al, 1984;
Haffner et al, 1989), but in men, Haffner et al (1989) found only BMI to be
significant.
'Syndrome X'
The common occurrence of NIDDM or impaired glucose tolerance, with
other CVD risk factors such as dyslipidaemia, hypertension and obesity, or
with CVD mortality, is well recognized and hyperinsulinaemia has been
proposed to be the underlying cause linking these. Possible mechanisms
have been discussed by Zimmet (1993), Bj6rntorp (1993), DeFronzo and
Ferannini (1991), Moller and Flier (1991) and Reaven (1988). Many titles
have been used to describe various combinations of these metabolic and
morphologic risk factors and diseases, with different authors including and
excluding different features. Bj6rntorp in a recent review (1993) describes
how visceral (deep abdominal) adiposity may be integral to this cluster of
risk factors and diseases and should be included in the syndrome he terms
the 'civilization syndrome'.
Studies on these 'syndromes' have generally been performed in subjects
of European origin and there is some evidence that the patterns of risk
factors observed in non-Europeans is slightly different. In American Samoa
and among the Samoans in Hawaii and California, a study of causes of death
showed deaths from CVD to be fewer than would be predicted on the basis
of the prevalence of obesity and hypertension, in comparison with Ameri-
cans of European origin, while deaths from NIDDM were rising (Baker and
Crews, 1986). It has been suggested that NIDDM may be one of the first
diseases to appear following modernization of lifestyle, and that there may
be a lag phase to the appearance of coronary artery disease, related to the
length of exposure necessary for the development of atheroma (Zimmet et
al, 1990). Nauruans, Pimas and Blacks of African origin also appear to have
relatively low levels of CVD risk factors compared with Caucasians based on
the degree of obesity and frequency of NIDDM (Fontbonne et al, 1992;
Hodge et al, 1993).
The propensity of Pacific islanders to obesity and NIDDM may have an
anthropological basis. Neel (1962) hypothesized that the marked tendency
594 A. M. HODGE AND P. Z. ZIMMET
to obesity in traditional living populations, e.g. hunter-gatherers, experi-
encing modernization was the result of a 'thrifty genotype'. This trait would
promote efficient storage of fat in times of plenty and allow a survival advan-
tage at times of hardship, e.g. the 'feast and famine' scenario that may have
been encountered with long canoe voyages and uncertain climatic con-
ditions. In modern times, the genotype has become a disadvantage,
favouring the development of obesity and NIDDM (Dowse and Zimmet,
1993). Hyperinsulinaemia and insulin resistance may be the phenotypic
expression of this 'thrifty gene' (Zimmet, 1991; Dowse and Zimmet, 1993).
With modernization, hyperinsulinaemia/insulin resistance and compen-
satory hyperinsulinaemia, lead ultimately to pancreatic [3-cell decompen-
sation and clinical diabetes. While the 'thrifty genotype' has not yet been
proven, the frequency with which obesity, glucose intolerance and associ-
ated CVD risk factors occur in Pacific Island populations certainly support
this attractive hypothesis.
SUMMARY
Obesity and pattern of fat distribution are both important factors related to
poor health outcomes. Many measures of obesity and fat distribution pat-
tern have been employed by different authors and to facilitate inter-
population comparisons and interpretation of secular trends it is necessary
that standardized methods for measurement and classification are set in
place. The use of BMI as a measure of fatness for epidemiological studies is
widely accepted, easilymeasured and BMI predicts morbidity and mortality
in many populations. The most appropriate level at which to define obesity is
a matter of debate but systems which use BMI/> 25 and ~<30 kg/ma as over-
weight, and BMI > 30 kg/m2as obese for all adults are simple, easily remem-
bered, already widely used and BMIs above 30 kg/m2 are clearly associated
with increased risk of morbidity and mortality. In some populations there
may be a case for using a lower cut-off but not unless there is specific
evidence to support this. For the present WHR is probably the best method
for assessing fat distribution, although waist circumference on its own may
be more useful in determining risk levels. Standard sites for measurement of
both waist and hip girths have been described.
There is a large variation in the prevalence of obesity across the
populations for which data is available, with high prevalences of obesity and
dramatic secular trends especially apparent in modernizing Pacific Island
populations. The 'thrifty genotype' hypothesis has been invoked to try and
explain this situation.
The clustering of obesity, NIDDM and CVD risk factors has been recog-
nized and various 'syndromes' have been described which group different
factors together, with hyperinsulinaemia and insulin resistance proposed as
the underlying problem.
Acknowledgements
Much of this work was supported by grant DK-25446 from the National Institute of Diabetes
and Digestive and Kidney Diseases.
THE EPIDEMIOLOGY OF OBESITY 595
REFERENCES
Abraham S & Johnson CL (1980) Prevalence of severe obesity in adults in the United States.
American Journal of ClinicalNutrition 33: 364-369.
Alexander H & Dugdale A (1990) Which waist-hip ratio? MedicalJournalofAustralia 153:367
(Letter).
Alnli NE (1991) Prevalence of obesity in a Native Hawaiian population. American Journal of
ClinicalNutrition 53: 1556S-1560S.
Armellini F, Zamboni M, Robbi R et al (1993) Total and intra-abdominal fat measurements by
ultrasound and computerized tomography. InternationalJournal of Obesity 17: 209-214.
Australian Institute of Health and Welfare (1992) Australia's Health 1992: the third biennial
report of the Australian Institute of Health and Welfare, Australian Government Printing
Service, Canberra.
Ayatollahi SMT & Carpenter RG (1993) Height, weight, BMI and weight-for-height of adults
in southern Iran: how should obesity be defined? Annals of Human Biology 20: 13-19.
Baker PT & Crews DE (1986) Mortality patterns and some biological predictors. In Baker PT,
Hanna JM & Baker TS (eds) The ChangingSamoans, Behaviour and Health in Transition,
pp 93-122. New York: Oxford University Press.
Barrett-Connor EL (1985) Obesity, atherosclerosis, and coronary artery disease. Annals of
Internal Medicine 103: 1010-1019.
Baumgartner RN, Roche AF, Chumlea C et al (1987) Fatness and fat patterns: association with
plasma lipids and blood pressures in adults, 18 to 57 years of age. American Journal of
Epidemiology 126: 614-628,
Beckles GLA, Miller GJ, Alexis SD et al (1985) Obesity on women in an urban Trinidadian
community. Prevalence and associated characteristics. InternationalJournal of Obesity 9:
127-135.
Bj6rntorp P (1993) Visceral obesity: a 'civilization syndrome'. Obesity Research 1: 206-222.
Bonora E, Zenere M, Branzi et al (1992) Influence of body fat and its regional location on risk
factors for atherosclerosis in young men. American Journal of Epidemiology 135: 1271-
1278.
Bray GA (1992) Pathophysiology of obesity. American Journal of ClinicalNutrition 55: 448S-
494S.
Broussard BA, Johnson A, Himes JH et al (1991) Prevalence of obesity in American Indians
and Alaska Natives. American Journal of ClinicalNutrition 53: 1535S-1542S.
Busetto L, Baggio MB, Zurlo F et al (1992) Assessment of abdominal fat distribution in obese
patients: anthropometry veruscomputerized tomography. InternationalJournalof Obesity
16: 731-736.
Canadian Guidelines for Healthy Weights (1988) Report of an Expert Group convened by
Health Promotion Directorate Health Services and Promotion Branch. Minister of
National Health and Welfare, Ottawa.
Cassano PA, Segal MR, Vokonas PS & Weiss ST (1990) Body fat distribution, blood pressure,
and hypertension, a prospective cohort study of men in the Normative Aging Study.
Annals of Epidemiology 1: 33-48.
Cassano PA, Rosner B, Vokonas PS & Weiss ST (1992) Obesity and body fat distribution in
relation to incidence ofnon-insulin dependent diabetes mellitus. A prospective cohort study
of men in the Normative Aging Study. American Journalof Epidemiology 136: 1474.1486.
Castro J, Baptista F, Henrique M & Galvao-Teles A (1992) Prevalence of obesity in young
Portuguese men. InternationalJournal of Obesity 16 (supplement 1): P255 (Abstract).
Colditz GA, Willett WC, Stampfer MJ et al (1990) Weight as a risk factor for clinical diabetes in
women. American Journal of Epidemiology 132: 501-513.
Croft JB, Strogatz DS, Sherman AJ et al (1992) Socioeconomic and behavioral correlates of
body mass index in black adults: the Pitt County Study. American Journal of PublicHealth
82: 821-826.
Curb JD & Marcus EB (1991) Body fat and obesity in Japanese Americans. American Journal
of ClinicalNutrition 53: 1552S-1555S.
DeFronzo RA & Ferannini E (1991) Insulin resistance. A multifaceted syndrome responsible
for NIDDM, obesity, hypertension, dyslipidemia, and atherosclerotic cardiovascular
disease. Diabetes Care 14: 173-194.
596 A. M. HODGE AND P. Z. ZIMMET
Depr6s J-P, Nadeau A, Tremblay A et al (1989) Role of deep abdominal fat in the association
between regional adipose tissue distribution and glucose tolerance in obese women.
Diabetes 38: 304-309.
Deprds J-P, Prud'homme D, Pouliot M-C et al (1991) Estimation of deep abdominal adipose-
tissue accumulation from simple anthropometric measurements in men. American Journal
of ClinicalNutrition 54: 471-477.
Dhurandar NV & Kulkarni PR (1992) Prevalence of obesity in Bombay. InternationalJournal
of Obesity 16: 367-375.
Donahue RP, Abbott RD, Bloom E et al (1987) Central obesity and coronary heart disease in
men. Lancet i: 821-824.
Dowse GK & Zimmet PZ (1992) A model protocol for a diabetes and other noncommunicable
disease field survey. World Health Statistics Quarterly45: 360-372.
Dowse G & Zimmet P (1993) The thrifty genotype in non-insulin-dependent diabetes: the
hypothesis survives. British MedicalJournal 306: 532-533.
Dowse GK, Zimmet PZ, Gareeboo H et al (1991) Abdominal obesity and physical inactivity as
risk factors for NIDDM and impaired glucose tolerance in Indian, Creole, and Chinese
Mauritians. Diabetes Care14: 271-282.
Dowse G, Zimmet P, Collins & Finch C (1992) Obesity in Pacific populations. In Bj6rntorp P &
Brodoff B (eds) Obesity, pp 619-639. Philadelphia, PA: JB Lippincott.
Ducimetiere P & Richard JL (1989) The relationship between subsets of anthropometric upper
versus lower body measurements and coronary heart disease risk in middle-aged men. The
Paris Prospective Study I. InternationalJournal of Obesity 13: 111-122.
Durnin JVGA & Womersley J (1974) Body fat assessed from total body density and its
estimation from skinfold thicknesses: measurements on 484 men and women aged from 16
to 72 years. BritishJournal of Nutrition 32: 77-97.
Ferland M, Despr6s J-P & Tremblay A (1989) Assessment of adipose tissue distribution by
computed axial tomography in obese women: association with body density and
anthropometric measurements. BritishJournal of Nutrition 61: 139-148.
Ferrannini E, Haffner SM, Mitchell BD & Stern MP (1991) Hyperinsulinemia: the key feature
of a cardiovascular and metabolic syndrome. Diabetologia34: 416-422.
Folsom AR, Prineas RJ, Kaye SA & Soler JT (1989a) Body fat distribution and self-reported
prevalence of hypertension, heart attack, and other heart disease in older women. Inter-
nationalJournal of Epidemiology 18: 361-367.
Folsom AR, Burke GL, Ballew C et al (1989b) Relation of body fatness and its distribution to
cardiovascular risk factors in young blacks and whites, the role of insulin. American
Journal of Epidemiology 130: 11-24.
Fontbonne A, Papoz L, Eschwege E et al (1992) Features of insulin-resistance syndrome in
men from French Caribbean Islands. The Telecom Study. Diabetes41: 1385-1389.
Fitzgerald AP & Jarret RJ (1992) Body weight and coronary heart disease mortality: an analysis
in relation to age and smoking habit. 15 years follow-up data from the Whitehall Study.
InternationalJournal of Obesity 16: 119-123.
Garfinkel L (1985) Overweight and cancer. Annals of Internal Medicine 103: 1034-1036.
Garn SM, Bailey SM, Cole PE & Higgins ITT (1977) Level of education, level of income, and
level of fatness in adults. American Journal of ClinicalNutrition 30: 721-725.
Garrow JS (1983) Indices of adiposity. Nutrition abstractsand reviewsseriesA 53: 697-708.
Haffner SM, Stern MP, Hazuda HP et al (1986) Role of obesity and fat distribution in non-
insulin-dependent diabetes mellitus in Mexican Americans and non-Hispanic whites.
Diabetes Care9: 153-161.
Haffner SM, Stern MP, Hazuda HP et al (1987) Do upper-body and centralized adiposity
measure different aspects of regional body-fat distribution? Relationship to non-insulin-
dependent diabetes mellitus, lipids, and lipoproteins. Diabetes36: 43-51.
Haffner SM, Diehl AK, Stern MP & Hazuda HP (1989) Central adiposity and gallbladder
disease in Mexican Americans. American Journal of Epidemiology 129: 587-595.
Hartz A J, Rupley DC & Rimm AA (1984) The association of girth measurements with disease
in 32 856 women. American Journal of Epidemiology 119: 71-80.
Hazuda HP, Haffner SM, Stern MP & Eifler CW (1988) Effects of acculturation and socio-
economic status on obesity and diabetes in Mexican Americans, the San Antonio Heart
Study. American Journal of Epidemiology 128: 1289-1301.
Hazuda HP, Mitchell BD, Haffner SM & Stern MP (1991) Obesity in Mexican American
THE EPIDEMIOLOGY OF OBESITY 597
subgroups: findings from the San Antonio Heart Study. American Journal of Clinical
Nutrition 53: 1529S-1534S.
Hodge AM, Dowse GK & Zimmet PZ (1993) Association of body mass index and waist-hip
circumference ratio with cardiovascular disease risk factors in Micronesian Nauruans.
InternationalJournal of Obesity 17: 399-407.
Hubert HB, Feinleib M, McNamara PM & Castelli WP (1983) Obesity as an independent risk
factor for cardiovascular disease: a 26-year follow-up of participants in the Framingham
Heart Study. Circulation67: 968-977.
Hughes K, Yeo PPB, Lun KC et al (1990) Obesity and body mass index in Chinese, Malays and
Indians in Singapore. Annals Academy of Medicine 19: 333-338.
Iso H, Kiyama M & Naito Y (1991) The relation of body fat distribution and body mass with
haemoglobin Ale, blood pressure and blood lipids in urban Japanese men. International
Journal of Epidemiology 20: 88-94.
Kaufman NA, Friedlander Y, Kark J & Berry EM (1992) The distribution of BMI in Jerusalem
with respect to sex, age, ethnicity and parity. International Journal of Obesity 16
(supplement 1): P249 (Abstract).
Keys A (1980) Overweight, obesity, coronary heart disease and mortality. Nutrition Reviews
38: 297--307.
King H, Taylor R, Zimmet Pet al (1984) Non-insulin-dependent diabetes (NIDDM) in a newly
independent Pacific Nation: the Republic of Kiribati. Diabetes"Care7: 409-415.
Knowler WC, Petitt DJ, Savage PJ & Bennett PH (1981) Diabetes incidence in Pima Indians:
contributions of obesity and parenteral diabetes. American Journal of Epidemiology 113:
144-156.
Knowler WC, Pettit DJ, Saad MF et al (1991) Obesity in the Pima Indians: its magnitude and
relationship with diabetes. American Journal of ClinicalNutrition 53: 1543S-1551S.
Koester RS, Hunter GR, Snyder Set al (1992) Estimation of computerized tomography
derived abdominal fat distribution. InternationalJournal of Obesity 16- 543-554.
Kuczmarski RJ (1992) Prevalence of overweight and weight gain in the United States.
American Journal of ClinicalNutrition 55: 495S-502S.
Kvist H, Chowdhury B, Grang~trd U et al (1988) Total and visceral adipose-tissue volumes
derived from measurements with computed tomography in adult men and women: predic-
tive equations. American Journal of ClinicalNutrition 48: 1351-1361.
Labarthe D, Reed D, Brody J & Stallones R (1973) Health effects of modernization. American
Journal of Epidemiology 98: 161-174.
Lackland DT, Orchard TJ & Keil JE (1992) Are race differences in the prevalence of hyper-
tension explained by body mass and fat distribution? A survey in a biracial population.
InternationalJournal of Epidemiology 21: 236-245.
Lapidus L, Bengtsson C, Larsson Bet al (1984) Distribution of adipose tissue and risk of cardio-
vascular disease and death: a 12 year follow up of participants in the population study of
women in Gothenburg, Sweden. British MedicalJournal 289: 1257-1261.
Larsson B, Sv~rdsudd K, Welin Let al (1984) Abdominal adipose tissue distribution, obesity,
and risk of cardiovascular disease and death: 13 year follow up of participants in the study
of men born in 1913. British MedicalJournal 288: 1401-1404.
Laurier D, Guiget M, Chau NP et al (1992) Prevalence of obesity: a comparative survey in
France, the United Kingdom and the United States. InternationalJournal of Obesity 16:
565-572.
Lopez LM & Masse B (1992) Comparisons of body mass indexes and cutoff points for estimat-
ing the prevalence of overweight in Hispanic women. Journal of the American Dietetic
Association 92: 1343-1347.
Lundgren H, Bengtsson C, Blohme Get al (1989) Adiposity and adipose tissue distribution in
relation to incidence of diabetes in women: results from a prospective population study in
Gothenburg, Sweden. InternationalJournal of Obesity 13: 413-423.
McGarvey ST (1991) Obesity in Samoans and a perspective on its etiology in Polynesians.
American Journal of ClinicalNutrition 53: 1585S-1594S.
McKeigue PM, Pierpoint T, Ferrie JE & Marmot MG (1992) Relationship of glucose
intolerance and hyperinsulinaemia to body fat pattern in South Asians and Europeans.
Diabetologia 35: 785-791.
Metropolitan Life Insurance Company (1959) New weight standards for men and women.
Statistics Bulletin. Metropolitan Life Insurance Company 40: 1.
598 A. M. HODGE AND P. Z. ZIMMET
Millar WJ & Stephens T (1987) The prevalence of overweight and obesity in Britain, Canada,
and United States. American Journal of Public Health 77: 38--41.
Modan M, Karaski A, Halkin H et al (1986) Effect of past and concurrent body mass index on
prevalence of glucose intolerance and Type 2 (non-insulin-dependent) diabetes and on
insulin response. Diabetologia 29: 82--89.
Moller DE & Flier JS (1991) Insulin resistance-mechanisms, syndromes, and implications. New
England Journal of Medicine 325: 938-948.
Mueller WH, Wear ML, Hanis CL et al (1991) Which measure of body fat distribution is best
for epidemiological research? American Journal of Epidemiology 133: 858-869.
MYkk~nen L, Laakso M & Pytr~il~ K (1992) Association of obesity and distribution of obesity
with glucose tolerance and cardiovascular risk factors in the elderly. International Journal
of Obesity 16: 695-704.
National Heart Foundation of Australia (1983) Risk factor prevalence study. Report No. 2
1983.
National Heart Foundation of Australia (1990) Risk factor prevalence study. Report No. 3
1990.
Neel JV (1962) Diabetes mellitns: a thrifty genotype rendered detrimental by 'progress'?
American Journal of Human Genetics 14: 353-362.
Ohlson L-O, Larsson B, Sv/irdsudd K et al (1985) The influence of body fat distribution in the
incidence of diabetes mellitus. 13.5 years of follow-up of the participants in the study of
men born in 1913. Diabetes 34: 1055-1058.
Patrick RC, Prior IAM, Smith JC & Smith AH (1983) Relationship between blood pressure
and modernity among Ponapeans. International Journal of Epidemiology 12: 36-44.
Pawson IG, Martorell R & Mendoza FE (1991) Prevalence of overweight and obesity in US
Hispanic populations. American Journal of Clinical Nutrition 53: 1522S-1528S.
Reaven GM (1988) Role of insulin resistance in human disease. Diabetes'37: 1595-1607.
Reeder BA, Angal A, Ledoux M et al (1992) Obesity and its relation to cardiovascular disease
risk factors in Canadian adults. Canadian Medical Association Journal 146: 2009-2019.
Reichley KB, Mueller WH, Hanis CL et al (1987) Centralized obesity and cardiovascular
disease risk in Mexican Americans. American Journal of Epidemiology 125: 373-386.
Rissanen A, Helitvaara M & Aromaa A (1988) Overweight and anthropometric changes in
adulthood: a prospective study of 17 000 Finns. International Journal of Obesity 12: 391-
401.
Rutishauser IHE & McKay H (1986) Anthropometric status and body composition in
Aboriginal women of the Kimberley region. Medical Journal of Australia 144: $8-S10.
Seidell JC, Cigolino M, Charzewska J et al (1989) Indicators of fat distribution, serum lipids,
and blood pressure in European women born in 1948: the European Fat Distribution
Study. International Journal of Epidemiology 130: 53-65.
Seidell JC, Cigolini M, Charzewska J et al (1992) Fat distribution in European men: a com-
parison of anthropometric measurements in relation to cardiovascular risk factors. Inter-
national Journal of Obesity 16: 17-22.
Selby JV, Freidman GD & Quesenberry CP Jr (1989) Precursors of essential hypertension, the
role of body fat distribution pattern. American Journal of Epidemiology 129: 43-53.
Shelgikar KM, Hockaday TDR & Yajnik CS (1991) Central rather than generalized obesity is
related to hyperglycaemia in Asian Indian subjects. Diabetic Medicine 8: 712-717.
Shetterly SM, Marshall JA, Baxter J & Hamman RF (1993) Waist-hip ratio measurement
location influences associations with measures of glucose and lipid metabolism, the San
Luis Valley Diabetes Study. Annals of Epidemiology 3: 295-299.
Sobal J & Stunkard AJ (1989) Socioeconomic status and obesity: a review of the literature.
Psychological Bulletin 105: 260--275.
Sorensen TIA & Price RA (1990) Secular trends in body mass index among Danish young men.
International Journal of Obesity 14: 411-419.
Stern MP, Gaskill SP, Hazuda HP, Gardner LI & Haffner SM (1983) Does obesity explain
excess prevalence of diabetes among Mexican Americans? Results of the San Antonio
Heart Study. Diabetologia 24: 272-277.
Stevens J, Keil JE, Rust PF et al (1992) Body mass index and body girths as predictors of
mortality in black and white men. American Journal of Epidemiology 135: 1137-1146.
Stokes JIII, Garrison RJ & Kannal WB (1987) The independent contributions of various
indices of obesity to the 22-year incidence of coronary heart disease: the Framingham
THE EPIDEM1OLOGY OF OBESITY 599
Study. In Vague J (ed.) Metabolic Complications of Human Obesity, pp 49-57.
Amsterdam: Elsevier.
Tai T-Y, Chuang L-M, Wu H-P & Chen C-J (1992) Association of body build with non-insulin-
dependent diabetes mellitus and hypertension among Chinese adults: a 4-year follow-up
study. International Journal of Epidemiology 21: 511-517.
Taylor R, Badcock J, King H et al (1992) Dietary intake, exercise, obesity and noncommuni-
cable disease in rural and urban populations of three Pacificisland countries. Journalof the
American College of Nutrition 11: 283-293.
Terry RB, Page WF & Haskell WL (1992) Waist/hip ratio, body mass index and premature
cardiovascular disease mortality in US Army veterans during a twenty-three year follow-
up study. International Journal of Obesity 16: 417-423.
Tuomilehto J, Salonen JT, Marri Bet al (1987) Body weight and risk of myocardial infarction
and death in the adult population of eastern Finland. British Medical Journal 295: 623-627.
Vague J (1956) The degree of masculine differentiation of obesiries: a factor determining pre-
disposition to diabetes, atherosclerosis, gout, and uric calculus disease. American Journal
of Clinical Nutrition 4: 20-34.
Valdez R, Seidell JC, Ahn YI & Weiss KM (1993) A new index of abdominal adiposity as an
indicator of risk for cardiovascular disease. A cross-population study. International
Journal of Obesity 17: 7%82.
van der Kooy K & Seidell JC (1993) Techniques for the measurement of visceralfat: a practical
guide. International Journal of Obesity 17: 187-196.
Van Itallie TB (1985) Health implications of overweight and obesity in the United States.
Annals of lnternal Medicine 103: 983-988.
Van Noord PAH, Seidell JC, Den Tonkelaar Iet al (1990) The relationship between fat distri-
bution and some chronic diseases in 11825 women participating in the DOM-Project.
International Journal of Epidemiology 19: 564-570.
World Health Organization (1985) Diabetes Mellitus. Report of a WHO Study Group. Techni-
cal Report Series No. 727. Geneva: World Health Organization.
World Health Organization (1990) Diet, Nutrition, and the Prevention of Chronic Diseases,
pp 69-74. Report of a WHO Study Group. Technical Report Series No. 797. Geneva:
World Health Organization.
Yao C-H, Slattery ML, Jacobs DR Jr & Folsom AR (1991) Anthropometric predictors of
coronary heart disease and total mortality: findings from the US Railroad Study. American
Journal of Epidemiology 134: 1278-1289.
Zamboui M, Armellini F & Milani MP (1992) Body fat distribution in pre- and post-
menopausal women: metabolic and anthropometric variables and their inter-
relationships. International Journal of Obesity 16: 495-504.
Zenere M, Bonora E, Branzi Pet al (1992) Prevalence of ponderal excess and its relationships
with generic and environmental factors in young men. International Journal of Obesity 16
(supplement 1): P251 (Abstract).
Zimmet P (1991) Challenges in diabetes epidemiology--from West to the rest. Kelly West
Lecture. Diabetes Care 15: 232-252.
Zimmet PZ (1993) Hyperinsulinemnia--how innocent a bystander? Diabetes Care 16
(supplement3): 56--70.
Zimmet P, Faaiuso S, Ainuu Jet al (1981) The prevalence of diabetes in the rural and urban
Polynesian population of Western Samoa. Diabetes 30: 45-51.
Zimmet P, Taylor R, Ram Pet al (1983) Prevalence of impaired glucose tolerance in the biracial
(Melanesian and Indian) population of Fiji: a rural-urban comparison. American Journal
of Epidemiology 118: 673-688.
Zimmet P, Dowse G, Serjeantson S & King H (1990) The epidemiology and natural history of
NIDDM-lessons from the South Pacific. Diabetes Metabolism Reviews 6: 91-124.

More Related Content

Similar to 5 The epidemiology of obesity.pdf

Menezes, 2012 - An Optimal Method for Measuring Body Fat in Overweight Indivi...
Menezes, 2012 - An Optimal Method for Measuring Body Fat in Overweight Indivi...Menezes, 2012 - An Optimal Method for Measuring Body Fat in Overweight Indivi...
Menezes, 2012 - An Optimal Method for Measuring Body Fat in Overweight Indivi...
Mariana Menezes
 

Similar to 5 The epidemiology of obesity.pdf (12)

Menezes, 2012 - An Optimal Method for Measuring Body Fat in Overweight Indivi...
Menezes, 2012 - An Optimal Method for Measuring Body Fat in Overweight Indivi...Menezes, 2012 - An Optimal Method for Measuring Body Fat in Overweight Indivi...
Menezes, 2012 - An Optimal Method for Measuring Body Fat in Overweight Indivi...
 
Association of central obesity and severity in cholelithiasis during cholecys...
Association of central obesity and severity in cholelithiasis during cholecys...Association of central obesity and severity in cholelithiasis during cholecys...
Association of central obesity and severity in cholelithiasis during cholecys...
 
Th lam opac203
Th lam opac203Th lam opac203
Th lam opac203
 
obesity by Dr.subhash dwivedi ,BHMS FINAL YEAR STUDENTS
obesity by Dr.subhash dwivedi ,BHMS FINAL YEAR STUDENTSobesity by Dr.subhash dwivedi ,BHMS FINAL YEAR STUDENTS
obesity by Dr.subhash dwivedi ,BHMS FINAL YEAR STUDENTS
 
Body Composition Profiling: The Stepping Stone Towards Precision Medicine in ...
Body Composition Profiling: The Stepping Stone Towards Precision Medicine in ...Body Composition Profiling: The Stepping Stone Towards Precision Medicine in ...
Body Composition Profiling: The Stepping Stone Towards Precision Medicine in ...
 
Obesity-Copy.pdf
Obesity-Copy.pdfObesity-Copy.pdf
Obesity-Copy.pdf
 
Crimson Publishers-Dietary Lifestyle, Way of Life Practices and Corpulence: ...
Crimson Publishers-Dietary Lifestyle, Way of Life Practices and  Corpulence: ...Crimson Publishers-Dietary Lifestyle, Way of Life Practices and  Corpulence: ...
Crimson Publishers-Dietary Lifestyle, Way of Life Practices and Corpulence: ...
 
A Systematic Review Of The Literature Concerning The Relationship Between Obe...
A Systematic Review Of The Literature Concerning The Relationship Between Obe...A Systematic Review Of The Literature Concerning The Relationship Between Obe...
A Systematic Review Of The Literature Concerning The Relationship Between Obe...
 
Obesity
Obesity Obesity
Obesity
 
Obesity and survival on dialysis
Obesity and survival on dialysisObesity and survival on dialysis
Obesity and survival on dialysis
 
ABDOMINAL OBESITY AND ITS ASSOCIATED RISK FACTORS - AN UPDATE
ABDOMINAL OBESITY AND ITS ASSOCIATED RISK FACTORS - AN UPDATEABDOMINAL OBESITY AND ITS ASSOCIATED RISK FACTORS - AN UPDATE
ABDOMINAL OBESITY AND ITS ASSOCIATED RISK FACTORS - AN UPDATE
 
Overweight and obesity in adults health consequences
Overweight and obesity in adults health consequencesOverweight and obesity in adults health consequences
Overweight and obesity in adults health consequences
 

More from Kayla Jones

More from Kayla Jones (20)

Free Printable Stationery - Letter Size. Online assignment writing service.
Free Printable Stationery - Letter Size. Online assignment writing service.Free Printable Stationery - Letter Size. Online assignment writing service.
Free Printable Stationery - Letter Size. Online assignment writing service.
 
Critique Response Sample Summary Response Essa
Critique Response Sample Summary Response EssaCritique Response Sample Summary Response Essa
Critique Response Sample Summary Response Essa
 
Definisi Dan Contoh Paragraph Cause And Effe
Definisi Dan Contoh Paragraph Cause And EffeDefinisi Dan Contoh Paragraph Cause And Effe
Definisi Dan Contoh Paragraph Cause And Effe
 
Analysis on A s Laundry Shop A Profit Maximization Approach.pdf
Analysis on A s Laundry Shop  A Profit Maximization Approach.pdfAnalysis on A s Laundry Shop  A Profit Maximization Approach.pdf
Analysis on A s Laundry Shop A Profit Maximization Approach.pdf
 
A Close and Distant Reading of Shakespearean Intertextuality.pdf
A Close and Distant Reading of Shakespearean Intertextuality.pdfA Close and Distant Reading of Shakespearean Intertextuality.pdf
A Close and Distant Reading of Shakespearean Intertextuality.pdf
 
A CRITICAL ANALYSIS OF THE STATUS AND APPLICATION OF THE RESPONSIBILITY TO PR...
A CRITICAL ANALYSIS OF THE STATUS AND APPLICATION OF THE RESPONSIBILITY TO PR...A CRITICAL ANALYSIS OF THE STATUS AND APPLICATION OF THE RESPONSIBILITY TO PR...
A CRITICAL ANALYSIS OF THE STATUS AND APPLICATION OF THE RESPONSIBILITY TO PR...
 
A Developmental Evolutionary Framework for Psychology.pdf
A Developmental Evolutionary Framework for Psychology.pdfA Developmental Evolutionary Framework for Psychology.pdf
A Developmental Evolutionary Framework for Psychology.pdf
 
A Pedagogical Model for Improving Thinking About Learning.pdf
A Pedagogical Model for Improving Thinking About Learning.pdfA Pedagogical Model for Improving Thinking About Learning.pdf
A Pedagogical Model for Improving Thinking About Learning.pdf
 
Agri-tourism handbook.pdf
Agri-tourism handbook.pdfAgri-tourism handbook.pdf
Agri-tourism handbook.pdf
 
1001 Solved Engineering Fundamentals Problems 3rd Ed..pdf.pdf
1001 Solved Engineering Fundamentals Problems 3rd Ed..pdf.pdf1001 Solved Engineering Fundamentals Problems 3rd Ed..pdf.pdf
1001 Solved Engineering Fundamentals Problems 3rd Ed..pdf.pdf
 
A THEORETICAL FRAMEWORK OF STRESS MANAGEMENT- CONTEMPORARY APPROACHES, MODELS...
A THEORETICAL FRAMEWORK OF STRESS MANAGEMENT- CONTEMPORARY APPROACHES, MODELS...A THEORETICAL FRAMEWORK OF STRESS MANAGEMENT- CONTEMPORARY APPROACHES, MODELS...
A THEORETICAL FRAMEWORK OF STRESS MANAGEMENT- CONTEMPORARY APPROACHES, MODELS...
 
Assessing Testing Practices with Reference to Communicative Competence in Ess...
Assessing Testing Practices with Reference to Communicative Competence in Ess...Assessing Testing Practices with Reference to Communicative Competence in Ess...
Assessing Testing Practices with Reference to Communicative Competence in Ess...
 
abstract on climate change.pdf
abstract on climate change.pdfabstract on climate change.pdf
abstract on climate change.pdf
 
A research strategy for text desigbers The role of headings.pdf
A research strategy for text desigbers  The role of headings.pdfA research strategy for text desigbers  The role of headings.pdf
A research strategy for text desigbers The role of headings.pdf
 
An Analysis Of Consumers Perception Towards Rebranding A Study Of Hero Moto...
An Analysis Of Consumers  Perception Towards Rebranding  A Study Of Hero Moto...An Analysis Of Consumers  Perception Towards Rebranding  A Study Of Hero Moto...
An Analysis Of Consumers Perception Towards Rebranding A Study Of Hero Moto...
 
A Psicologia Da Crian A Jean Piaget
A Psicologia Da Crian A Jean PiagetA Psicologia Da Crian A Jean Piaget
A Psicologia Da Crian A Jean Piaget
 
An Exposition Of The Nature Of Volunteered Geographical Information And Its S...
An Exposition Of The Nature Of Volunteered Geographical Information And Its S...An Exposition Of The Nature Of Volunteered Geographical Information And Its S...
An Exposition Of The Nature Of Volunteered Geographical Information And Its S...
 
Addressing Homelessness In Public Parks
Addressing Homelessness In Public ParksAddressing Homelessness In Public Parks
Addressing Homelessness In Public Parks
 
A Critical Analysis Of The Academic Papers Written By Experienced Associate A...
A Critical Analysis Of The Academic Papers Written By Experienced Associate A...A Critical Analysis Of The Academic Papers Written By Experienced Associate A...
A Critical Analysis Of The Academic Papers Written By Experienced Associate A...
 
A STUDY ON CUSTOMER SATISFACTION TOWARDS SERVICE QUALITY AND COMPANY IMAGE OF...
A STUDY ON CUSTOMER SATISFACTION TOWARDS SERVICE QUALITY AND COMPANY IMAGE OF...A STUDY ON CUSTOMER SATISFACTION TOWARDS SERVICE QUALITY AND COMPANY IMAGE OF...
A STUDY ON CUSTOMER SATISFACTION TOWARDS SERVICE QUALITY AND COMPANY IMAGE OF...
 

Recently uploaded

Seal of Good Local Governance (SGLG) 2024Final.pptx
Seal of Good Local Governance (SGLG) 2024Final.pptxSeal of Good Local Governance (SGLG) 2024Final.pptx
Seal of Good Local Governance (SGLG) 2024Final.pptx
negromaestrong
 

Recently uploaded (20)

Measures of Dispersion and Variability: Range, QD, AD and SD
Measures of Dispersion and Variability: Range, QD, AD and SDMeasures of Dispersion and Variability: Range, QD, AD and SD
Measures of Dispersion and Variability: Range, QD, AD and SD
 
Ecological Succession. ( ECOSYSTEM, B. Pharmacy, 1st Year, Sem-II, Environmen...
Ecological Succession. ( ECOSYSTEM, B. Pharmacy, 1st Year, Sem-II, Environmen...Ecological Succession. ( ECOSYSTEM, B. Pharmacy, 1st Year, Sem-II, Environmen...
Ecological Succession. ( ECOSYSTEM, B. Pharmacy, 1st Year, Sem-II, Environmen...
 
PROCESS RECORDING FORMAT.docx
PROCESS      RECORDING        FORMAT.docxPROCESS      RECORDING        FORMAT.docx
PROCESS RECORDING FORMAT.docx
 
General Principles of Intellectual Property: Concepts of Intellectual Proper...
General Principles of Intellectual Property: Concepts of Intellectual  Proper...General Principles of Intellectual Property: Concepts of Intellectual  Proper...
General Principles of Intellectual Property: Concepts of Intellectual Proper...
 
Key note speaker Neum_Admir Softic_ENG.pdf
Key note speaker Neum_Admir Softic_ENG.pdfKey note speaker Neum_Admir Softic_ENG.pdf
Key note speaker Neum_Admir Softic_ENG.pdf
 
Seal of Good Local Governance (SGLG) 2024Final.pptx
Seal of Good Local Governance (SGLG) 2024Final.pptxSeal of Good Local Governance (SGLG) 2024Final.pptx
Seal of Good Local Governance (SGLG) 2024Final.pptx
 
Class 11th Physics NEET formula sheet pdf
Class 11th Physics NEET formula sheet pdfClass 11th Physics NEET formula sheet pdf
Class 11th Physics NEET formula sheet pdf
 
Z Score,T Score, Percential Rank and Box Plot Graph
Z Score,T Score, Percential Rank and Box Plot GraphZ Score,T Score, Percential Rank and Box Plot Graph
Z Score,T Score, Percential Rank and Box Plot Graph
 
2024-NATIONAL-LEARNING-CAMP-AND-OTHER.pptx
2024-NATIONAL-LEARNING-CAMP-AND-OTHER.pptx2024-NATIONAL-LEARNING-CAMP-AND-OTHER.pptx
2024-NATIONAL-LEARNING-CAMP-AND-OTHER.pptx
 
This PowerPoint helps students to consider the concept of infinity.
This PowerPoint helps students to consider the concept of infinity.This PowerPoint helps students to consider the concept of infinity.
This PowerPoint helps students to consider the concept of infinity.
 
Explore beautiful and ugly buildings. Mathematics helps us create beautiful d...
Explore beautiful and ugly buildings. Mathematics helps us create beautiful d...Explore beautiful and ugly buildings. Mathematics helps us create beautiful d...
Explore beautiful and ugly buildings. Mathematics helps us create beautiful d...
 
Energy Resources. ( B. Pharmacy, 1st Year, Sem-II) Natural Resources
Energy Resources. ( B. Pharmacy, 1st Year, Sem-II) Natural ResourcesEnergy Resources. ( B. Pharmacy, 1st Year, Sem-II) Natural Resources
Energy Resources. ( B. Pharmacy, 1st Year, Sem-II) Natural Resources
 
ICT role in 21st century education and it's challenges.
ICT role in 21st century education and it's challenges.ICT role in 21st century education and it's challenges.
ICT role in 21st century education and it's challenges.
 
INDIA QUIZ 2024 RLAC DELHI UNIVERSITY.pptx
INDIA QUIZ 2024 RLAC DELHI UNIVERSITY.pptxINDIA QUIZ 2024 RLAC DELHI UNIVERSITY.pptx
INDIA QUIZ 2024 RLAC DELHI UNIVERSITY.pptx
 
Python Notes for mca i year students osmania university.docx
Python Notes for mca i year students osmania university.docxPython Notes for mca i year students osmania university.docx
Python Notes for mca i year students osmania university.docx
 
Micro-Scholarship, What it is, How can it help me.pdf
Micro-Scholarship, What it is, How can it help me.pdfMicro-Scholarship, What it is, How can it help me.pdf
Micro-Scholarship, What it is, How can it help me.pdf
 
Unit-V; Pricing (Pharma Marketing Management).pptx
Unit-V; Pricing (Pharma Marketing Management).pptxUnit-V; Pricing (Pharma Marketing Management).pptx
Unit-V; Pricing (Pharma Marketing Management).pptx
 
Role Of Transgenic Animal In Target Validation-1.pptx
Role Of Transgenic Animal In Target Validation-1.pptxRole Of Transgenic Animal In Target Validation-1.pptx
Role Of Transgenic Animal In Target Validation-1.pptx
 
Holdier Curriculum Vitae (April 2024).pdf
Holdier Curriculum Vitae (April 2024).pdfHoldier Curriculum Vitae (April 2024).pdf
Holdier Curriculum Vitae (April 2024).pdf
 
Sociology 101 Demonstration of Learning Exhibit
Sociology 101 Demonstration of Learning ExhibitSociology 101 Demonstration of Learning Exhibit
Sociology 101 Demonstration of Learning Exhibit
 

5 The epidemiology of obesity.pdf

  • 1. 5 The epidemiology of obesity ALLISON M. HODGE PAUL Z. ZIMMET Epidemiology provides a basis for understanding the extent and public health implications of obesity within and between populations. Essential for the development of a framework for global comparisons of prevalence and incidence of obesity and overweight, is the standardization of their defi- nition and measurement. Thus the contribution of epidemiology to such a need is addressed first. This chapter also discusses the dramatic rise in preva- lence of obesity in developing and newly developed nations that has occur- red concurrently with modernization of lifestyle. DEFINITIONS OF OBESITY AND ITS MEASUREMENT The importance of obesity as a risk factor for a number of diseases including non-insulin-dependent diabetes (NIDDM), cardiovascular disease (CVD), hypertension, gallstones and certain cancers, is well documented. Obesity is defined as a condition in which there is an excess of body fat, as opposed to overweight, defined as a condition in which the body weight exceeds a reference level. The level at which body fat content is considered excessive is based upon the excess morbidity and mortality associated with increasing body fat content. However, there is still no international standard method used for measurement of body fat, nor are there reference levels with which to compare different measures which have been widely accepted. This lack of consistency has hindered comparison of the prevalence of obesity among different populations and the study of secular trends. At present, anthropometric measurements are all that is practicable for epidemiological studies. Height and weight are the most commonly used parameters for assessing fatness but skinfold thicknesses are also used (Durnin and Womersley, 1974). A number of methods have been developed for interpreting weight and height. Relative weight compares an individual's weight with an 'optimum' weight-for-height. Metropolitan Life Insurance tables (1959) were the first widely used source of 'optimum' weight, the levels being based on the mortality rates experienced by insured subjects in the United States. The population from which these figures were derived was not representative of the total population of the US, or indeed any other Baillidre"s Clinical Endocrinology and Metabolism-- 577 Vol. 8, No. 3, July 1994 Copyright © 1994, by Bailli~reTindall ISBN 0-7020-1851-1 All rights of reproduction in any form reserved
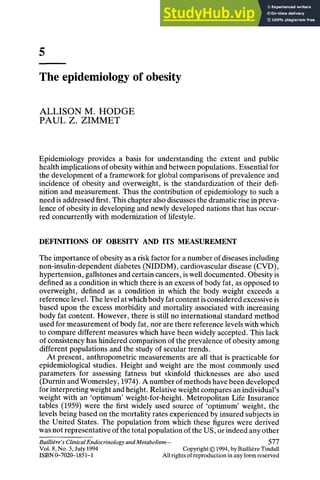
  • 2. 578 A. M. HODGE AND P. Z. ZIMMET nation, yet the Metropolitan Life figures have been widely used as a standard for many years. Other studies have used population specific standards for 'optimum' weight (Dhurandhar and Kulkarni, 1992) but the level of relative weight considered to represent obesity has also varied between 120% (Dhurandar and Kulkarni, 1992) and 140% (Aluli, 1991). Many studies have defined overweight and severe overweight as greater than or equal to the 85th and 95th percentiles respectively of the distribution of height and weight for men and non-pregnant women 20-29 years of age in the NHANES II study. This approach is based on the assumption that beyond the upper age limit of the reference group, increases in weight reflect fat accumulation. Quetelet's index or BMI (weight (kg)/height (m)2) is now the commonly used parameter by which fatness is classified but other body mass indices using exponentials other than 2 have also been estimated (Abraham and Johnson, 1980; Lopez and Masse, 1992). Body mass index is an indicator of body fat content with correlation coefficients generally above 0.5 (Bray, 1992). Some BMI classification systems have different cut-off points depending on age and sex, while others have a single value. The simplest classification, recommended by Garrow (1983), Bray (1992) and the National Heart Foundation of Australia (NHF, 1983, 1990), has obesity as a BMI greater than 30 kg/m2 for both sexes. The WHO classification has three levels of obesity, and considers the major risk to be when BMI > 30 kg/m2 (World Health Organization, 1990). Canada uses a similar, simple system, but obesity begins at BMI >27kg/m 2 (Canadian Guidelines for Healthy Weights, 1988). While the decision as to where the lower limit of obesity should be is arbi- trary, the level must reflect an increasing risk of morbidity and/or mortality. Keys (1980) has looked at linear and quadratic relationships between BMI and probability of death in a number of populations. The linear relationships showed a decrease in probability of death with increasing BMI but a quadra- tic relationship fitted the data better. These U-shaped curves indicated that the probability of death began to rise steeply at BMIs between about 29 and 34 in different populations. Stevens et al (1992) found a similar relationship in black, but not white, men in the Charleston Heart Study. From their figures it appears that the risk of coronary heart disease death rose sharply when BMI was greater than about 35 kg/m2. Figure i shows the age- standardized rates of hypertension, diabetes mellitus, hypercholesterol- aemia (i> 5.5 mmol/1) and hypertriglyceridaemia (I>2.0 mmol/1) for increas- ing levels of BMI in Western Samoan men and women from our 1991 survey. These plots indicate that no specific level of BMI is associated with a sudden increase in CVD risk factor prevalence but above a BMI of 25-31 kg/m2, risk is relatively higher. More specific cut-points are probably not justified. A simple classification such as those above, which can be applied to all ages and sexes, would be sufficient to show effects of obesity on health and to compare populations.
  • 3. THE EPIDEMIOLOGY OF OBESITY Prevalence (%) 50 579 Hypercholesterolemia I Hypertriglycerldemla 4 0 - - ~< Diabetes 7 */ [] Hypertenslo~ 3o 20 10 0 22 22-24 24-26 26-28 28-30 30-32 32-34 34-36 >36 (a) BMI Prevalence (%) 5O 40 30 -~ Hypercholesterolemia --~-- Hy/~ke rtrig lyceridem ia D/abk~ke s 2O J 10 O~ I i ~ I I t I 22 22-24 24-26 26-28 28-30 30-32 32-34 34-36 ~36 (b) BMI Figure 1. The prevalence of cardiovascular disease risk factors and non-insulin-dependent diabetes (NIDDM) by BMI in Western Samoan men (a) and women (b).
  • 4. 580 A.M. HODGE AND V. Z. ZIMMET FAT DISTRIBUTION The measurement and definition of fat distribution has become an important issue for research, with many studies over the last 20-30 years indicating that body-fat distribution is a risk factor for NIDDM, hypertension and CVD independent of general obesity. Vague (1956) first identified the effects of fat distribution, coining the terms android and gynoid fat distributions to identify male and female fat distribution patterns respectively. Fat distri- bution patterns have been identified by a number of terms which are not well defined. Central, upper body, gynoid and abdominal obesity appear to be used somewhat synonymously to refer to fat located in the trunk or abdomen, rather than in lower body or peripheral deposits. Most of the studies examining the effects of fat distribution on health outcomes have used skinfolds, usually subscapular and triceps (Baumgartner et al, 1987; Donahue et al, 1987; Reichley et al, 1987; Selby et al, 1989; Fontbonne et al, 1992; Yao et al, 1992; Stern et al, 1983) or waist-hip circumference ratio (Hartz et al, 1984; Folsom et al, 1989a; Lundgren et al, 1989; Van Noord et al, 1990; Iso et al, 1991; Shelgikar et al, 1991; Bonora et al, 1992; Lackland et al, 1992; McKeigue et al, 1992; Mykk~inen et al, 1992; Shetterly et al, 1993; Stevens et al, 1992; Terry et al, 1992) as the measure of body fat distribution. Haffner et al (1987) differentiated between upper body obesity as measured by WHR and centralized obesity as measured by subscapular/triceps skin- fold thickness ratio (STR). Both were found to be independently associated with NIDDM and CVD risk factor levels, thus the authors concluded that they measured different things and if only one measure was to be made, WHR was preferable to STR. Historically there has been a tendency to move from skinfold to circum- ference measures. Although specific sites have been identified for skinfold measurements, the method is not well standardized and large interobserver variations occur. Waist-hip circumference ratio (WHR) appears to be easier to measure (van der Kooy and Seidell, 1993), especially in obese subjects, but the levels at which waist and hips should be measured have not been consistent and large variations in the ratio may result from small variations in measurement site (Alexander and Dugdale, 1990). More recent work utilizing computed tomography (CT) and other scans on the truncal area have indicated that it is the intra-abdominal adipose tissue area, rather than subcutaneous fat that is most closely related to metabolic disorders (Deprds et al, 1989; Zamboni et al, 1992). Waist circumference has been found to correlate better with intra-abdominal adi- pose area by CT scan in both men and women than does WHR (Ferland et al, 1989; Depr6s et al, 1991; Busetto et al, 1992; Koester et al, 1992) and Seidell et al (1989) and Mueller et al (1991) have shown waist circumference in women to be as good as WHR at explaining variations in CVD risk factor levels, while in men waist circumference was more strongly correlated with CVD risk factors than was WHR (Seidell et al, 1992). A new index of fat distribution, the conicity index, has been described by Valdez et al (1993). The conicity index is calculated from height, weight and waist girth and appears to predict CVD risk as well as does WHR, but whether it will be any
  • 5. THE EPIDEMIOLOGY OF OBESITY 581 more useful remains to be seen. Sagittal abdominal diameter is also highly correlated with intra-abdominal adipose area (Kvist et al, 1988; Armellini et al, 1993; van der Kooy and Seidell, 1993). As yet there is no standard anthropometric method for measurement of sagittal diameter and in most cases it has been derived from CT scan. Further studies are required to determine the most appropriate method for measurement of sagittal dia- meter in the field and to determine whether it is a good predictor of CVD risk factors, NIDDM and mortality. For epidemiological studies, waist and hip circumferences still appear to be the most useful measurements but it may be more useful to analyse them separately rather than as a ratio. While waist and hip measurements con- tinue to be used it is important that standard methods are used to allow comparison across populations. It is suggested that waist circumference should be measured at a point halfwaybetween the lower costal margin and the iliac crest, while hip circumference should be measured as the maximum circumference around the buttocks posteriorly and indicated anteriorly by the symphysis pubis (Dowse and Zimmet, 1992). Use of arbitrary cut-off points for WHR is not appropriate unless these levels have been shown to be related to increased risk of morbidity or mortalityin the population to which they are to be applied. Fat distribution may vary between ethnic groups and recent work in Paci- fic populations has shown that large differences in BMI can occur without differences in WHR. In Western Samoa, Polynesians from three geographic locations with varying degrees of modernization were surveyed, mean BMI and the prevalence of NIDDM increased with increasing modernization but WHR did not vary. Waist and hip circumferences varied significantly between locations, suggesting that additional adipose tissue was distributed evenly in Samoans. A similar observation has been noted in Melanesians in Papua New Guinea (PNG), where six sites varying in levels of modernity were surveyed. Only minor differences in WHR were noted while BMI varied significantly between populations. In obese Micronesian Nauruans the correlation between WHR and BMI was lower than reported for other populations and subscapular: triceps skinfold ratio (STR) was relatively low compared with other leaner populations (Hodge et al, 1993), suggesting that Nauruans may deposit fat more evenly than other populations. This suggestion is supported by the fact that waist and hip circumferences were individually much more highly correlated with weight and BMI than was WHR (Hodge et al, 1993). Other studies have shown that for similar levels of BMI there are differences in measures of fat distribution between ethnic groups for black versus white men in the US (Lackland et al, 1992), for South Asian versus European men and women (McKeigue et al, 1992) and for Afro-Caribbean versus European men in the French Telecom Study (Fontbonne et al, 1992). When Australian Aboriginal women were com- pared with white women of the same BMI they had a higher body fat content and it was more centrally located (Rutishauser and McKay, 1986).
  • 6. 582 A. M. HODGE AND P. Z. ZIMMET 8 O ;> O 8 ;> [.., t".l ~ m • : I~, •~ ~- a ~ .~< O O t~ A I[ o N ~ II t~ r~ ~ -s ~ ..~ m z < ~ ¢~O 0o o ~_. ~ ~ ~ © ~ ,.., ~,-, ~ ,.., ~2 ~ = ,,6od © A II © •~ ~ O tt3 1>~ r"- O 0~ z O o O A II © O O e-,~, z .o O z o ¢q.~ 2 ~o
  • 7. THE EPIDEMIOLOGY OF OBESITY 583 Ak~ 0 ~t¢'3 ,. i <'7'? ~,-~ t¢3 t¢3 t~ = ,-,E o o O N N~: ~ oo t-- "~ c5 ~6 ~,~ &Z~ A © © AX~,~ ^ ^X ~.= .: II ~ II ~ ~>~ "+~,+ ~..~ ~ ~ o~..~ .~ - .,..~, t~ ,.. ='~ ,¢ ~ .~ r~,~.~ o~~ ~ '~ o,'~ ~ .o~ oo ~ ~ r.o ~ "O A~ tl O ?-~ cq~ t'q A © e,/)~ O +~ . ~E .,¢ I'-.- t~
  • 8. 584 EPIDEMIOLOGY OF OBESITY A. M. HODGE AND P. Z. ZIMMET Western populations Table 1 shows the prevalence of obesity and overweight as defined by various criteria in a number of Western populations. These data illustrate some of the features associated with the distribution of obesity within and between populations. Where the NHANES II criteria for severe overweight are used it is assumed that this category is equivalent to obesity. Temporal trends are evident in the study of Danish draftees, showing increasing prevalence of obesity in successive birth cohorts (S0rensen and Price, 1990). The Australian studies (National Heart Foundation, 1983, 1990) show small increases in the rate of obesity in both men and women between 1983 and 1989 and, although the age groups studied are slightly different, this is likely to be a real effect. The rates for severe overweight from the NHANES I (1971-74) and NHANES II (1976-80) survey indicate small increases in prevalence of obesity in men and women in the United States although the criteria used differ between these reports. Kuczmarski (1992) has compared the results of the two surveys using common cut-off points which gives an increase of only 1.2 percentage points. Within certain groups the increase was much higher, for example in black males the prevalence of severe over- weight rose by six percentage points between the two surveys. A gender bias towards higher rates of obesity in females than males is apparent in most populations, even though the lower limit of severe overweight or obesity is slightly higher in females using the NHANES II criteria. Ethnic comparisons are reported by Pawson et al (1991), Hazuda et al (1991) and Kuczmarski (1992) for different groups in the US. Data from the Hispanic Health and Nutrition survey (Pawson et al, 1991) show higher prevalence of obesity in Mexican American men than Cuban men, but in women the difference is greater between Mexican Americans and Puerto Ricans. Kuczmarski (1992) presents data comparing the Hispanic groups with American blacks and whites. Black women had the highest prevalence of obesity, and Cuban women the lowest, with white Americans of both sexes also being relatively lean. The Cubans were one of the few groups where men were more likely to be obese than women. The San Antonio Heart Study (Hazuda et al, 1991) also compares obesity in Mexican Ameri- cans and non-Hispanic whites in a geographically defined sample area. Mexican American men and women were more obese than white Ameri- cans, especially among women where the difference was more than twofold. Two studies each compared three Western populations (Millar and Stephens, 1987; Laurier et al, 1992). In both studies the prevalence of obesity was higher in the US. Table i does not contain any age comparisons but figures for three groups of young men in Denmark (S0rensen and Price, 1990), Italy (Zenere et al, 1992) and Portugal (Castro et al, 1992) indicate very low rates of obesity within these younger age groups.
  • 9. THE EPIDEMIOLOGY OF OBESITY 585 Non-Western populations Results for the prevalence of obesity from non-Western populations are summarized in Table 2. These data include information on the effect of age on the prevalence of obesity in a number of populations. Among a group of predominantly Pima Indians, the prevalence of obesity in men and women tended to increase over the first three decades of adulthood and then decline, although there was a high prevalence in the oldest group of men (Knowler et al, 1991), Japanese men of 45--69years studied in Japan, Hawaii and California, showed a tendency for obesity to decline in prevalence with age (Curb and Marcus, 1991). Among a small, volunteer sample of adults in Bombay the prevalence of obesity increased with age group, but the age breakdown was not adequate to show a fall in prevalence in the oldest age groups (Dhurandar and Kulkarni, 1992). In four groups, from different countries of origin, surveyed in Israel there was a clear trend toward increased obesity in women over 50 years compared with younger women, but the trend was less marked in men (Kaufman et al, 1992). Ethnic comparisons performed within similar environments indicate pos- sible genetic effects on susceptibility to obesity. Beckles et al (1985) reported on three ethnic groups in Port-of-Spain, Trinidad. In this study, men and women of African origin were more likely to be obese than those of mixed (Afro-European) or Indian origin. In Israel, men and women born locally were compared with those born in Asia, North Africa or Europe/ United States (Kaufman et al, 1992). The prevalence of obesity did not vary much in men but among women there were big differences between ethnic groups, the relative ranking depended on age, but in both age groups the women of North African origin were the most obese. Migration studies look at members of the same ethnic group living in different environments. The study of Japanese men (Curb and Marcus, 1991) showed that Japanese men living in Hawaii or California suffer from a greater prevalence of obesity than those remaining in Japan. McGarvey (1991) has studied the effect of migration and westernization in Samoans living in Western Samoa (most traditional), American Samoa (less traditional) and Hawaii (urban). The prevalence of obesity increased with changes from more to less traditional; in men there was a continual gradient across four locations, while in women there was a big jump from Western Samoa to American Samoa, followed by small increases with further westernization. The prevalence of obesity in some of these non-European populations is extremely high, especially in the Samoans (McGarvey, 1991), the Pima Indians (Knowler et al, 1991) and the women from Trinidad (Beckles et al, 1985). Pacific and Indian Ocean Island populations We have collected data on the prevalence of obesity in ten Pacific Island populations and in the multiethnic populations of the Indian Ocean islands of Mauritius and Rodrigues over the last 16 years which is presented in Table 3. The most striking feature of this table is the extremely high age-
  • 10. 586 A. M. HODGE AND P. Z. ZIMMET © 8 0 2- e~ .~e~ c~ t"-,I m e~ © ," A A~ II II 'ft. "r- 0 '~ ~ .~ vo~ ~ ~ °~o c¢~ t--I cq m~ A~ ~A~ © Z t¢3 ~m m~ II A~ 0 0 .d'~ r".- ~ < ~ .o~m~ mZ <~ ¢q A~ II ,.o © < A~ II O ~E .~" c, O
  • 11. THE EPIDEMIOLOGY OF OBESITY 587 ea ~ a4 d ,-; 4 A ~ m m ,---* ,a:~ V 0 M e-............-,-..-~ ^ ,, =~ o o0 0 O (/) .~ ¢q G~ G~ t~ e~ -}- v...~o~ ~o6~ ,,60~ ~t'¢3 ~T~. ~. < % A~ e-, O ;> O © >.. A o~ t"q ~2 I.~ t-,q tr3 D X % A II © .=. "O © .-~A~ = t'-q t¢3 O X3: % ~5 A II 2 © ¢..) ¢..q ¢.,q t'¢3 G~ K ¢..) O < r~
  • 12. 588 A. M. HODGE AND P. Z. ZIMMET Table 3. Age-standardized* prevalence of obesity (body mass index >30kg/m2) adults aged 25-69 years in various Pacific and Indian island populations. Age-standardizedprevalence Population Men Women Micronesians Nauru 1975/76 69.4 61.7 1982 67.5 76.4 1987 64.8 70.3 Kiribati 1981--Urban 29.8 34.5 --Rural 11.8 13.1 Polynesians Western Samoa 1978---Urban 38.8 59.1 --Rural 17.7 37.0 Western Samoa 1991--Urban 5K4 76.8 --Rural 41.5 59.2 Wallis Island 1980~Urban 35.9 65.4 --Rural 24.1 48.1 Raratonga--Cook Islands 1980 39.0 49.1 Nuie 1980 21.0 36.0 Tuvalu 1977 24.0 47.5 LoyaltyIslands--New Caledonia 1979 5.0 31.3 Melanesians Papua New Guinea 1991--Urban coastal 36.3 54.3 --Rural coastal 23.9 18.6 --Highlands 4.7 5.3 Fiji 1980--Urban 17.8 40.8 --Rural 9.4 24.2 LoyaltyIslands--New Caledonia 1979 10.5 25.0 Asian Indians Mauritius 1987 3.3 11.3 1992 5.1 16.2 Fiji 1980--Urban 4.3 20.0 --Rural 2.8 9.5 Creoles Mauritius 1987 3.8 13.3 1992 8.0 20.7 Rodrigues 1992 9.8 31.1 Chinese Mauritius 1987 6.2 4.9 1992 2.1 6.0 Australians 1989 Urban 11.1 12.7 *Age-standardizedto Segi's world population. standardized prevalence of obesity observed in many of these populations in comparison with the Australian population. Urban versus rural differences in the prevalence of obesity are highlighted in Kiribati, Papua New Guinea, Fiji, Western Samoa and Polynesians in Wallis Islands or Noumea. Ethnic differences are evident in Mauritius and Fiji where Asian Indians tend to suffer less from obesity than Creoles (African origin) or Melanesians. Chinese in Mauritius show a low prevalence of obesity. Temporal trends can be seen in Mauritius (1987-1992) and Western Samoa (1978-1991) where marked increases in the prevalence of obesity have occurred, especially in rural Western Samoa.
  • 13. THE EPIDEMIOLOGY OF OBESITY 589 Prevalence (%) °°[ 40 ~ Mauritius Indian '92 Western Samoa R / + Westor°Samoa',,O 30 20 10 0 P I I 25-34 35-44 45-54 55-64 65-69 Age group (years) (a) Prevalence (%) 5O Mauritius Indian '92 -+- Western Samoa '91 R 40 -~ Western Samoa '91 U Australia '89 ~ ~ ~ Nauru 'AZ 30 20 ]~ I I 25-34 35-44 45-54 Age group (years) * R=rural, U=urban (b) 55-64 65-69 Figure 2. The prevalence of obesity (BMI > 30 kg/m2) by age group in men (a) and women (b) from different populations.
  • 14. 590 A. M. HODGE AND P. Z. ZIMMET Effects of age Some examples of changes in the prevalence of obesity with age in men and women are presented in Figure 2. The pattern of increasing obesity up to middle-age followed by a plateau or decrease in prevalence in populations other than Nauruans is commonly found and may be related to greater weight loss in older subjects (Rissanen et al, 1988; McGarvey, 1991). Effects of modernization, acculturation and socioeconomic status Rural-urban comparisons and migration studies are used as evidence for an effect of acculturation or modernization in increasing the prevalence of obesity. This effect has been attributed to reduced levels of physical activity and dietary changes that occur with westernization. Decreased physical activity has been observed in urban compared with rural groups in Kiribati (King et al, 1984), Western Samoa (Zimrnet et al, 1981), Fiji (Zimmet et al, 1983) and Papua New Guinea. Differences in diet are less clear, while dietary composition changes as populations become more westernized (to include more saturated fat and less fibre, thus becoming more energy dense) the actual intake may not be greater (Taylor et al, 1992). Other factors that vary with modernization are occupation and education, as well as stresses from an urban society. In Western Samoa, BMI was positively associated with educational level and occupation in men, and this contrasts with data in Western populations (see later). A modernity score was calculated for subjects in Papua New Guinea which took into account subject's and father's employment, education level, type of house in which subject dwelt, proximity of home to a large town, the period of living in an urban area and an increment based on the spouse's score. Modernity score was associated with obesity in men and women. Other studies in Pacific populations have recorded similar findings. In Ponape, weight increased with modernity score or with increasingly westernized location (Patrick et al, 1983). In Palau, weight increased slightly with increasing modernity score, while the increase in subscapular skinfolds was more dramatic (Labarthe et al, 1973). In developed countries the situation tends to be reversed (Sobal and Stunkard, 1989). Lower socioeconomic status is associated with higher rates of obesity, especially in women, and in the US may be partly responsible for the higher rates of obesity seen among black and Hispanic populations. Among black women 25-50 years of age in the US, low socioeconomic status was independently related with increased BMI, but in men the relationship was not significant (Croft et al, 1992). Data from NHANES II indicate that race and poverty status were independent predictors of obesity in women in the US (Van Itallie, 1985). Hazuda et al (1988) looked at the effect of socio- economic status and acculturation on obesity in Mexican Americans taking part in the San Antonio Heart Study. In men increasing acculturation, i.e. adoption of white American values and attitudes, was associated with a linear fall in the rate of obesity whilst socioeconomic status had no effect. In women both acculturation and socioeconomic status were important, the
  • 15. THE EPIDEMIOLOGY OF OBESITY 591 former more so. Among white Americans in Tecumseh, Michigan, males with 12 or more years of schooling were fatter than those with less schooling while in women the results were reversed (Garnet al, 1977). Household income level was similarly related to obesity. In Australia, lower socio- economic status is also associated with increased levels of obesity in men and women (Australian Institute of Health and Welfare, 1992). Different attitudes towards obesity may be behind these observations. In Western society obesity is generally not socially acceptable, especially for women. The pressure to conform to standards set by society appears to be greater among more affluent groups. The more educated women may also be more aware of the adverse health consequences of obesity. In Pacific Islanders obesity was, and in some cases still is, a symbol of wealth and increased social status (Dowse et al, 1992). HEALTH CONSEQUENCES OF OBESITY Obesity and NIDDM Obesity has long been recognized as a risk factor for NIDDM. The WHO study group on diabetes has named obesity as the single most important factor in the development of NIDDM (World Health Organization, 1985). A number of prospective studies have shown obesity to be related to an increased incidence of NIDDM; Lundgren et al (1989) in Swedish women, Ohlson et al (1985) in Swedish men and Modan et al (1986) in Israeli men and women. Knowler et al (1981) report an increase in the incidence of dia- betes in Pima Indians from 0.8+0.8 cases/1000 in subjects with BMI < 20 kg/m2 to 72.2 + 14.5 cases/1000 when BMI/> 40 kg/m2. Tai et al (1992) found the relative risk for NIDDM in the top versus lowest quartile of BMI in Chinese adults to be 2.87 over 4 years of follow-up. In US women fol- lowed up for 8 years the relative risk of NIDDM for BMIs 23-23.9 kg/m2 compared with BMIs <22 kg/m2 was 3.6 (Colditz et al, 1990). Prevalence studies have also demonstrated associations between obesity and NIDDM (Hartz et al, 1984; Haffner et al, 1986; Van Noord et al, 1990; Cassano et al, 1992). In Mauritius, odds ratios for NIDDM in the highest versus the lowest tertile of BMI were between 4.5 and 5.0 in men of different ethnic groups, the equivalent figures in women were 3.0-9.0 (Dowse et al, 1991). Among Pimas (Knowler et al, 1981) and Israelis (Modan et al, 1986) obesity was not related to prevalence of NIDDM, possibly reflecting weight loss associated with glucose intolerance. Fat distribution indices are also closely related to the prevalence (Hartz et al, 1984; Haffner et al, 1986; Van Noord et al, 1990; Cassano et al, 1992) and incidence of NIDDM (Ohlson et al, 1985; Lundgren et al, 1989), and appear as important as overall obesity. Obesity and cardiovascular disease An association between obesity and cardiovascular disease (CVD) is fre- quently observed in prospective studies (Keys, 1980; Garfinkel, 1985;
  • 16. 592 A. M. HODGE AND P. Z. ZIMMET Donahue et al, 1987; Tuomilehto et al, 1987; Ducimetiere and Richard, 1989; Fitzgerald and Jarrett, 1992), but it is less clear whether this is a direct effect or is mediated through the effect of obesity on blood pressure, plasma lipids, insulin levels or glucose tolerance, all of which in turn, are risk factors for CVD (Barrett-Connor, 1985). Terry et al (1992) found the relative risk of death from ischaemic heart disease for an increase of one standard deviation in BMI, ranged from 1.22 to 1.25 in a 23-year follow-up of over 80 000 white men discharged from the United States Army in 1946-47, variations in BMI did not contribute to stroke mortality. This study does not consider other risk factors for CVD. In the US Railroad Study (Yao et al, 1991), BMI was associated with coronary heart disease (CHD) mortality but the relationship was not significant after adjusting for other risk factors, while a measure of fat distribution (chest girth/shoulder diameter) remained significant. In Charleston, US, Stevens et al (1992) found BMI a significant predictor of all cause and coronary heart disease mortality in black, but not white men, even when correcting for other risk factors. At the 26-year follow-up of subjects in the Framingham study obesity was found to be a significant predictor of CVD, independent of other risk factors (Hubert et al, 1983). Smoking is an important confounder of the association between obesity and CHD. In Finnish male smokers the effect of BMI on survival was not significant, but in non-smokers, survival time decreased with increasing BMI (Tuomilehto et al, 1987). Cigarette smoking is not always controlled for and could contribute to inconsistencies between studies. Fat distribution is also important in relation to CVD (Stokes et al, 1987; Ducimetiere and Richard, 1989; Yao et al, 1991; Stevens et al, 1992; Terry et al, 1992) and may in fact be more important than general adiposity (Larsson et al, 1984; Lapidus et al, 1984; Donahue et al, 1987). Obesity and dyslipidaemia A stronger association between general obesity, rather than abdominal obesity, and dyslipidaemia has been observed in young black and white adults (Folsom et al, 1989a), in elderly Finns (Mykkfinen et al, 1992), young Italian men (Bonora et al, 1992) and American men and women (Baumgartner et al, 1987). Seidell et al (1989) and Reichley et al (1987) found, to the contrary, that fat distribution was more important than overall fatness. Obesity and blood pressure Both general obesity and fat distribution have been observed to be related to elevated blood pressure and increased prevalence of hypertension (Hartz et al, 1984; Folsom et al, 1989a; Iso et al, 1991; Lackland et al, 1992; Seidell et al, 1992). Overall fatness appears to explain more of the variation in blood pressure when compared with fat distribution (Baumgartner et al, 1987; Reichley et al, 1987; Folsom et al, 1989b; Seidell et al, 1989). In a pro- spective study Selby et al (1989) found baseline BMI and subscapular skin- fold thickness to be independent predictors of hypertension, with
  • 17. THE EPIDEMIOLOGY OF OBESITY 593 unadjusted odds ratios of 3.85 and 3.75 respectively for the top versus the bottom quintile. In another prospective study, Cassano et al (1990) also found both abdominal and overall fatness predictive of hypertension. Other conditions associated with obesity A large American study has shown that the mortality rate for cancer is increased by obesity, with colorectal and prostate cancers in men and cancers of the endometrium, gallbladder, cervix, breast and ovary in women, being more common in obese subjects (Garfinkel, 1985). The increases in mortality rate for cancer are much smaller than those observed for coronary heart disease or digestive disease. Obesity has also been found to be a risk factor for gallbladder disease. In two studies, both BMI and WHR were associated with gallbladder disease in women (Hartz et al, 1984; Haffner et al, 1989), but in men, Haffner et al (1989) found only BMI to be significant. 'Syndrome X' The common occurrence of NIDDM or impaired glucose tolerance, with other CVD risk factors such as dyslipidaemia, hypertension and obesity, or with CVD mortality, is well recognized and hyperinsulinaemia has been proposed to be the underlying cause linking these. Possible mechanisms have been discussed by Zimmet (1993), Bj6rntorp (1993), DeFronzo and Ferannini (1991), Moller and Flier (1991) and Reaven (1988). Many titles have been used to describe various combinations of these metabolic and morphologic risk factors and diseases, with different authors including and excluding different features. Bj6rntorp in a recent review (1993) describes how visceral (deep abdominal) adiposity may be integral to this cluster of risk factors and diseases and should be included in the syndrome he terms the 'civilization syndrome'. Studies on these 'syndromes' have generally been performed in subjects of European origin and there is some evidence that the patterns of risk factors observed in non-Europeans is slightly different. In American Samoa and among the Samoans in Hawaii and California, a study of causes of death showed deaths from CVD to be fewer than would be predicted on the basis of the prevalence of obesity and hypertension, in comparison with Ameri- cans of European origin, while deaths from NIDDM were rising (Baker and Crews, 1986). It has been suggested that NIDDM may be one of the first diseases to appear following modernization of lifestyle, and that there may be a lag phase to the appearance of coronary artery disease, related to the length of exposure necessary for the development of atheroma (Zimmet et al, 1990). Nauruans, Pimas and Blacks of African origin also appear to have relatively low levels of CVD risk factors compared with Caucasians based on the degree of obesity and frequency of NIDDM (Fontbonne et al, 1992; Hodge et al, 1993). The propensity of Pacific islanders to obesity and NIDDM may have an anthropological basis. Neel (1962) hypothesized that the marked tendency
  • 18. 594 A. M. HODGE AND P. Z. ZIMMET to obesity in traditional living populations, e.g. hunter-gatherers, experi- encing modernization was the result of a 'thrifty genotype'. This trait would promote efficient storage of fat in times of plenty and allow a survival advan- tage at times of hardship, e.g. the 'feast and famine' scenario that may have been encountered with long canoe voyages and uncertain climatic con- ditions. In modern times, the genotype has become a disadvantage, favouring the development of obesity and NIDDM (Dowse and Zimmet, 1993). Hyperinsulinaemia and insulin resistance may be the phenotypic expression of this 'thrifty gene' (Zimmet, 1991; Dowse and Zimmet, 1993). With modernization, hyperinsulinaemia/insulin resistance and compen- satory hyperinsulinaemia, lead ultimately to pancreatic [3-cell decompen- sation and clinical diabetes. While the 'thrifty genotype' has not yet been proven, the frequency with which obesity, glucose intolerance and associ- ated CVD risk factors occur in Pacific Island populations certainly support this attractive hypothesis. SUMMARY Obesity and pattern of fat distribution are both important factors related to poor health outcomes. Many measures of obesity and fat distribution pat- tern have been employed by different authors and to facilitate inter- population comparisons and interpretation of secular trends it is necessary that standardized methods for measurement and classification are set in place. The use of BMI as a measure of fatness for epidemiological studies is widely accepted, easilymeasured and BMI predicts morbidity and mortality in many populations. The most appropriate level at which to define obesity is a matter of debate but systems which use BMI/> 25 and ~<30 kg/ma as over- weight, and BMI > 30 kg/m2as obese for all adults are simple, easily remem- bered, already widely used and BMIs above 30 kg/m2 are clearly associated with increased risk of morbidity and mortality. In some populations there may be a case for using a lower cut-off but not unless there is specific evidence to support this. For the present WHR is probably the best method for assessing fat distribution, although waist circumference on its own may be more useful in determining risk levels. Standard sites for measurement of both waist and hip girths have been described. There is a large variation in the prevalence of obesity across the populations for which data is available, with high prevalences of obesity and dramatic secular trends especially apparent in modernizing Pacific Island populations. The 'thrifty genotype' hypothesis has been invoked to try and explain this situation. The clustering of obesity, NIDDM and CVD risk factors has been recog- nized and various 'syndromes' have been described which group different factors together, with hyperinsulinaemia and insulin resistance proposed as the underlying problem. Acknowledgements Much of this work was supported by grant DK-25446 from the National Institute of Diabetes and Digestive and Kidney Diseases.
  • 19. THE EPIDEMIOLOGY OF OBESITY 595 REFERENCES Abraham S & Johnson CL (1980) Prevalence of severe obesity in adults in the United States. American Journal of ClinicalNutrition 33: 364-369. Alexander H & Dugdale A (1990) Which waist-hip ratio? MedicalJournalofAustralia 153:367 (Letter). Alnli NE (1991) Prevalence of obesity in a Native Hawaiian population. American Journal of ClinicalNutrition 53: 1556S-1560S. Armellini F, Zamboni M, Robbi R et al (1993) Total and intra-abdominal fat measurements by ultrasound and computerized tomography. InternationalJournal of Obesity 17: 209-214. Australian Institute of Health and Welfare (1992) Australia's Health 1992: the third biennial report of the Australian Institute of Health and Welfare, Australian Government Printing Service, Canberra. Ayatollahi SMT & Carpenter RG (1993) Height, weight, BMI and weight-for-height of adults in southern Iran: how should obesity be defined? Annals of Human Biology 20: 13-19. Baker PT & Crews DE (1986) Mortality patterns and some biological predictors. In Baker PT, Hanna JM & Baker TS (eds) The ChangingSamoans, Behaviour and Health in Transition, pp 93-122. New York: Oxford University Press. Barrett-Connor EL (1985) Obesity, atherosclerosis, and coronary artery disease. Annals of Internal Medicine 103: 1010-1019. Baumgartner RN, Roche AF, Chumlea C et al (1987) Fatness and fat patterns: association with plasma lipids and blood pressures in adults, 18 to 57 years of age. American Journal of Epidemiology 126: 614-628, Beckles GLA, Miller GJ, Alexis SD et al (1985) Obesity on women in an urban Trinidadian community. Prevalence and associated characteristics. InternationalJournal of Obesity 9: 127-135. Bj6rntorp P (1993) Visceral obesity: a 'civilization syndrome'. Obesity Research 1: 206-222. Bonora E, Zenere M, Branzi et al (1992) Influence of body fat and its regional location on risk factors for atherosclerosis in young men. American Journal of Epidemiology 135: 1271- 1278. Bray GA (1992) Pathophysiology of obesity. American Journal of ClinicalNutrition 55: 448S- 494S. Broussard BA, Johnson A, Himes JH et al (1991) Prevalence of obesity in American Indians and Alaska Natives. American Journal of ClinicalNutrition 53: 1535S-1542S. Busetto L, Baggio MB, Zurlo F et al (1992) Assessment of abdominal fat distribution in obese patients: anthropometry veruscomputerized tomography. InternationalJournalof Obesity 16: 731-736. Canadian Guidelines for Healthy Weights (1988) Report of an Expert Group convened by Health Promotion Directorate Health Services and Promotion Branch. Minister of National Health and Welfare, Ottawa. Cassano PA, Segal MR, Vokonas PS & Weiss ST (1990) Body fat distribution, blood pressure, and hypertension, a prospective cohort study of men in the Normative Aging Study. Annals of Epidemiology 1: 33-48. Cassano PA, Rosner B, Vokonas PS & Weiss ST (1992) Obesity and body fat distribution in relation to incidence ofnon-insulin dependent diabetes mellitus. A prospective cohort study of men in the Normative Aging Study. American Journalof Epidemiology 136: 1474.1486. Castro J, Baptista F, Henrique M & Galvao-Teles A (1992) Prevalence of obesity in young Portuguese men. InternationalJournal of Obesity 16 (supplement 1): P255 (Abstract). Colditz GA, Willett WC, Stampfer MJ et al (1990) Weight as a risk factor for clinical diabetes in women. American Journal of Epidemiology 132: 501-513. Croft JB, Strogatz DS, Sherman AJ et al (1992) Socioeconomic and behavioral correlates of body mass index in black adults: the Pitt County Study. American Journal of PublicHealth 82: 821-826. Curb JD & Marcus EB (1991) Body fat and obesity in Japanese Americans. American Journal of ClinicalNutrition 53: 1552S-1555S. DeFronzo RA & Ferannini E (1991) Insulin resistance. A multifaceted syndrome responsible for NIDDM, obesity, hypertension, dyslipidemia, and atherosclerotic cardiovascular disease. Diabetes Care 14: 173-194.
  • 20. 596 A. M. HODGE AND P. Z. ZIMMET Depr6s J-P, Nadeau A, Tremblay A et al (1989) Role of deep abdominal fat in the association between regional adipose tissue distribution and glucose tolerance in obese women. Diabetes 38: 304-309. Deprds J-P, Prud'homme D, Pouliot M-C et al (1991) Estimation of deep abdominal adipose- tissue accumulation from simple anthropometric measurements in men. American Journal of ClinicalNutrition 54: 471-477. Dhurandar NV & Kulkarni PR (1992) Prevalence of obesity in Bombay. InternationalJournal of Obesity 16: 367-375. Donahue RP, Abbott RD, Bloom E et al (1987) Central obesity and coronary heart disease in men. Lancet i: 821-824. Dowse GK & Zimmet PZ (1992) A model protocol for a diabetes and other noncommunicable disease field survey. World Health Statistics Quarterly45: 360-372. Dowse G & Zimmet P (1993) The thrifty genotype in non-insulin-dependent diabetes: the hypothesis survives. British MedicalJournal 306: 532-533. Dowse GK, Zimmet PZ, Gareeboo H et al (1991) Abdominal obesity and physical inactivity as risk factors for NIDDM and impaired glucose tolerance in Indian, Creole, and Chinese Mauritians. Diabetes Care14: 271-282. Dowse G, Zimmet P, Collins & Finch C (1992) Obesity in Pacific populations. In Bj6rntorp P & Brodoff B (eds) Obesity, pp 619-639. Philadelphia, PA: JB Lippincott. Ducimetiere P & Richard JL (1989) The relationship between subsets of anthropometric upper versus lower body measurements and coronary heart disease risk in middle-aged men. The Paris Prospective Study I. InternationalJournal of Obesity 13: 111-122. Durnin JVGA & Womersley J (1974) Body fat assessed from total body density and its estimation from skinfold thicknesses: measurements on 484 men and women aged from 16 to 72 years. BritishJournal of Nutrition 32: 77-97. Ferland M, Despr6s J-P & Tremblay A (1989) Assessment of adipose tissue distribution by computed axial tomography in obese women: association with body density and anthropometric measurements. BritishJournal of Nutrition 61: 139-148. Ferrannini E, Haffner SM, Mitchell BD & Stern MP (1991) Hyperinsulinemia: the key feature of a cardiovascular and metabolic syndrome. Diabetologia34: 416-422. Folsom AR, Prineas RJ, Kaye SA & Soler JT (1989a) Body fat distribution and self-reported prevalence of hypertension, heart attack, and other heart disease in older women. Inter- nationalJournal of Epidemiology 18: 361-367. Folsom AR, Burke GL, Ballew C et al (1989b) Relation of body fatness and its distribution to cardiovascular risk factors in young blacks and whites, the role of insulin. American Journal of Epidemiology 130: 11-24. Fontbonne A, Papoz L, Eschwege E et al (1992) Features of insulin-resistance syndrome in men from French Caribbean Islands. The Telecom Study. Diabetes41: 1385-1389. Fitzgerald AP & Jarret RJ (1992) Body weight and coronary heart disease mortality: an analysis in relation to age and smoking habit. 15 years follow-up data from the Whitehall Study. InternationalJournal of Obesity 16: 119-123. Garfinkel L (1985) Overweight and cancer. Annals of Internal Medicine 103: 1034-1036. Garn SM, Bailey SM, Cole PE & Higgins ITT (1977) Level of education, level of income, and level of fatness in adults. American Journal of ClinicalNutrition 30: 721-725. Garrow JS (1983) Indices of adiposity. Nutrition abstractsand reviewsseriesA 53: 697-708. Haffner SM, Stern MP, Hazuda HP et al (1986) Role of obesity and fat distribution in non- insulin-dependent diabetes mellitus in Mexican Americans and non-Hispanic whites. Diabetes Care9: 153-161. Haffner SM, Stern MP, Hazuda HP et al (1987) Do upper-body and centralized adiposity measure different aspects of regional body-fat distribution? Relationship to non-insulin- dependent diabetes mellitus, lipids, and lipoproteins. Diabetes36: 43-51. Haffner SM, Diehl AK, Stern MP & Hazuda HP (1989) Central adiposity and gallbladder disease in Mexican Americans. American Journal of Epidemiology 129: 587-595. Hartz A J, Rupley DC & Rimm AA (1984) The association of girth measurements with disease in 32 856 women. American Journal of Epidemiology 119: 71-80. Hazuda HP, Haffner SM, Stern MP & Eifler CW (1988) Effects of acculturation and socio- economic status on obesity and diabetes in Mexican Americans, the San Antonio Heart Study. American Journal of Epidemiology 128: 1289-1301. Hazuda HP, Mitchell BD, Haffner SM & Stern MP (1991) Obesity in Mexican American
  • 21. THE EPIDEMIOLOGY OF OBESITY 597 subgroups: findings from the San Antonio Heart Study. American Journal of Clinical Nutrition 53: 1529S-1534S. Hodge AM, Dowse GK & Zimmet PZ (1993) Association of body mass index and waist-hip circumference ratio with cardiovascular disease risk factors in Micronesian Nauruans. InternationalJournal of Obesity 17: 399-407. Hubert HB, Feinleib M, McNamara PM & Castelli WP (1983) Obesity as an independent risk factor for cardiovascular disease: a 26-year follow-up of participants in the Framingham Heart Study. Circulation67: 968-977. Hughes K, Yeo PPB, Lun KC et al (1990) Obesity and body mass index in Chinese, Malays and Indians in Singapore. Annals Academy of Medicine 19: 333-338. Iso H, Kiyama M & Naito Y (1991) The relation of body fat distribution and body mass with haemoglobin Ale, blood pressure and blood lipids in urban Japanese men. International Journal of Epidemiology 20: 88-94. Kaufman NA, Friedlander Y, Kark J & Berry EM (1992) The distribution of BMI in Jerusalem with respect to sex, age, ethnicity and parity. International Journal of Obesity 16 (supplement 1): P249 (Abstract). Keys A (1980) Overweight, obesity, coronary heart disease and mortality. Nutrition Reviews 38: 297--307. King H, Taylor R, Zimmet Pet al (1984) Non-insulin-dependent diabetes (NIDDM) in a newly independent Pacific Nation: the Republic of Kiribati. Diabetes"Care7: 409-415. Knowler WC, Petitt DJ, Savage PJ & Bennett PH (1981) Diabetes incidence in Pima Indians: contributions of obesity and parenteral diabetes. American Journal of Epidemiology 113: 144-156. Knowler WC, Pettit DJ, Saad MF et al (1991) Obesity in the Pima Indians: its magnitude and relationship with diabetes. American Journal of ClinicalNutrition 53: 1543S-1551S. Koester RS, Hunter GR, Snyder Set al (1992) Estimation of computerized tomography derived abdominal fat distribution. InternationalJournal of Obesity 16- 543-554. Kuczmarski RJ (1992) Prevalence of overweight and weight gain in the United States. American Journal of ClinicalNutrition 55: 495S-502S. Kvist H, Chowdhury B, Grang~trd U et al (1988) Total and visceral adipose-tissue volumes derived from measurements with computed tomography in adult men and women: predic- tive equations. American Journal of ClinicalNutrition 48: 1351-1361. Labarthe D, Reed D, Brody J & Stallones R (1973) Health effects of modernization. American Journal of Epidemiology 98: 161-174. Lackland DT, Orchard TJ & Keil JE (1992) Are race differences in the prevalence of hyper- tension explained by body mass and fat distribution? A survey in a biracial population. InternationalJournal of Epidemiology 21: 236-245. Lapidus L, Bengtsson C, Larsson Bet al (1984) Distribution of adipose tissue and risk of cardio- vascular disease and death: a 12 year follow up of participants in the population study of women in Gothenburg, Sweden. British MedicalJournal 289: 1257-1261. Larsson B, Sv~rdsudd K, Welin Let al (1984) Abdominal adipose tissue distribution, obesity, and risk of cardiovascular disease and death: 13 year follow up of participants in the study of men born in 1913. British MedicalJournal 288: 1401-1404. Laurier D, Guiget M, Chau NP et al (1992) Prevalence of obesity: a comparative survey in France, the United Kingdom and the United States. InternationalJournal of Obesity 16: 565-572. Lopez LM & Masse B (1992) Comparisons of body mass indexes and cutoff points for estimat- ing the prevalence of overweight in Hispanic women. Journal of the American Dietetic Association 92: 1343-1347. Lundgren H, Bengtsson C, Blohme Get al (1989) Adiposity and adipose tissue distribution in relation to incidence of diabetes in women: results from a prospective population study in Gothenburg, Sweden. InternationalJournal of Obesity 13: 413-423. McGarvey ST (1991) Obesity in Samoans and a perspective on its etiology in Polynesians. American Journal of ClinicalNutrition 53: 1585S-1594S. McKeigue PM, Pierpoint T, Ferrie JE & Marmot MG (1992) Relationship of glucose intolerance and hyperinsulinaemia to body fat pattern in South Asians and Europeans. Diabetologia 35: 785-791. Metropolitan Life Insurance Company (1959) New weight standards for men and women. Statistics Bulletin. Metropolitan Life Insurance Company 40: 1.
  • 22. 598 A. M. HODGE AND P. Z. ZIMMET Millar WJ & Stephens T (1987) The prevalence of overweight and obesity in Britain, Canada, and United States. American Journal of Public Health 77: 38--41. Modan M, Karaski A, Halkin H et al (1986) Effect of past and concurrent body mass index on prevalence of glucose intolerance and Type 2 (non-insulin-dependent) diabetes and on insulin response. Diabetologia 29: 82--89. Moller DE & Flier JS (1991) Insulin resistance-mechanisms, syndromes, and implications. New England Journal of Medicine 325: 938-948. Mueller WH, Wear ML, Hanis CL et al (1991) Which measure of body fat distribution is best for epidemiological research? American Journal of Epidemiology 133: 858-869. MYkk~nen L, Laakso M & Pytr~il~ K (1992) Association of obesity and distribution of obesity with glucose tolerance and cardiovascular risk factors in the elderly. International Journal of Obesity 16: 695-704. National Heart Foundation of Australia (1983) Risk factor prevalence study. Report No. 2 1983. National Heart Foundation of Australia (1990) Risk factor prevalence study. Report No. 3 1990. Neel JV (1962) Diabetes mellitns: a thrifty genotype rendered detrimental by 'progress'? American Journal of Human Genetics 14: 353-362. Ohlson L-O, Larsson B, Sv/irdsudd K et al (1985) The influence of body fat distribution in the incidence of diabetes mellitus. 13.5 years of follow-up of the participants in the study of men born in 1913. Diabetes 34: 1055-1058. Patrick RC, Prior IAM, Smith JC & Smith AH (1983) Relationship between blood pressure and modernity among Ponapeans. International Journal of Epidemiology 12: 36-44. Pawson IG, Martorell R & Mendoza FE (1991) Prevalence of overweight and obesity in US Hispanic populations. American Journal of Clinical Nutrition 53: 1522S-1528S. Reaven GM (1988) Role of insulin resistance in human disease. Diabetes'37: 1595-1607. Reeder BA, Angal A, Ledoux M et al (1992) Obesity and its relation to cardiovascular disease risk factors in Canadian adults. Canadian Medical Association Journal 146: 2009-2019. Reichley KB, Mueller WH, Hanis CL et al (1987) Centralized obesity and cardiovascular disease risk in Mexican Americans. American Journal of Epidemiology 125: 373-386. Rissanen A, Helitvaara M & Aromaa A (1988) Overweight and anthropometric changes in adulthood: a prospective study of 17 000 Finns. International Journal of Obesity 12: 391- 401. Rutishauser IHE & McKay H (1986) Anthropometric status and body composition in Aboriginal women of the Kimberley region. Medical Journal of Australia 144: $8-S10. Seidell JC, Cigolino M, Charzewska J et al (1989) Indicators of fat distribution, serum lipids, and blood pressure in European women born in 1948: the European Fat Distribution Study. International Journal of Epidemiology 130: 53-65. Seidell JC, Cigolini M, Charzewska J et al (1992) Fat distribution in European men: a com- parison of anthropometric measurements in relation to cardiovascular risk factors. Inter- national Journal of Obesity 16: 17-22. Selby JV, Freidman GD & Quesenberry CP Jr (1989) Precursors of essential hypertension, the role of body fat distribution pattern. American Journal of Epidemiology 129: 43-53. Shelgikar KM, Hockaday TDR & Yajnik CS (1991) Central rather than generalized obesity is related to hyperglycaemia in Asian Indian subjects. Diabetic Medicine 8: 712-717. Shetterly SM, Marshall JA, Baxter J & Hamman RF (1993) Waist-hip ratio measurement location influences associations with measures of glucose and lipid metabolism, the San Luis Valley Diabetes Study. Annals of Epidemiology 3: 295-299. Sobal J & Stunkard AJ (1989) Socioeconomic status and obesity: a review of the literature. Psychological Bulletin 105: 260--275. Sorensen TIA & Price RA (1990) Secular trends in body mass index among Danish young men. International Journal of Obesity 14: 411-419. Stern MP, Gaskill SP, Hazuda HP, Gardner LI & Haffner SM (1983) Does obesity explain excess prevalence of diabetes among Mexican Americans? Results of the San Antonio Heart Study. Diabetologia 24: 272-277. Stevens J, Keil JE, Rust PF et al (1992) Body mass index and body girths as predictors of mortality in black and white men. American Journal of Epidemiology 135: 1137-1146. Stokes JIII, Garrison RJ & Kannal WB (1987) The independent contributions of various indices of obesity to the 22-year incidence of coronary heart disease: the Framingham
  • 23. THE EPIDEM1OLOGY OF OBESITY 599 Study. In Vague J (ed.) Metabolic Complications of Human Obesity, pp 49-57. Amsterdam: Elsevier. Tai T-Y, Chuang L-M, Wu H-P & Chen C-J (1992) Association of body build with non-insulin- dependent diabetes mellitus and hypertension among Chinese adults: a 4-year follow-up study. International Journal of Epidemiology 21: 511-517. Taylor R, Badcock J, King H et al (1992) Dietary intake, exercise, obesity and noncommuni- cable disease in rural and urban populations of three Pacificisland countries. Journalof the American College of Nutrition 11: 283-293. Terry RB, Page WF & Haskell WL (1992) Waist/hip ratio, body mass index and premature cardiovascular disease mortality in US Army veterans during a twenty-three year follow- up study. International Journal of Obesity 16: 417-423. Tuomilehto J, Salonen JT, Marri Bet al (1987) Body weight and risk of myocardial infarction and death in the adult population of eastern Finland. British Medical Journal 295: 623-627. Vague J (1956) The degree of masculine differentiation of obesiries: a factor determining pre- disposition to diabetes, atherosclerosis, gout, and uric calculus disease. American Journal of Clinical Nutrition 4: 20-34. Valdez R, Seidell JC, Ahn YI & Weiss KM (1993) A new index of abdominal adiposity as an indicator of risk for cardiovascular disease. A cross-population study. International Journal of Obesity 17: 7%82. van der Kooy K & Seidell JC (1993) Techniques for the measurement of visceralfat: a practical guide. International Journal of Obesity 17: 187-196. Van Itallie TB (1985) Health implications of overweight and obesity in the United States. Annals of lnternal Medicine 103: 983-988. Van Noord PAH, Seidell JC, Den Tonkelaar Iet al (1990) The relationship between fat distri- bution and some chronic diseases in 11825 women participating in the DOM-Project. International Journal of Epidemiology 19: 564-570. World Health Organization (1985) Diabetes Mellitus. Report of a WHO Study Group. Techni- cal Report Series No. 727. Geneva: World Health Organization. World Health Organization (1990) Diet, Nutrition, and the Prevention of Chronic Diseases, pp 69-74. Report of a WHO Study Group. Technical Report Series No. 797. Geneva: World Health Organization. Yao C-H, Slattery ML, Jacobs DR Jr & Folsom AR (1991) Anthropometric predictors of coronary heart disease and total mortality: findings from the US Railroad Study. American Journal of Epidemiology 134: 1278-1289. Zamboui M, Armellini F & Milani MP (1992) Body fat distribution in pre- and post- menopausal women: metabolic and anthropometric variables and their inter- relationships. International Journal of Obesity 16: 495-504. Zenere M, Bonora E, Branzi Pet al (1992) Prevalence of ponderal excess and its relationships with generic and environmental factors in young men. International Journal of Obesity 16 (supplement 1): P251 (Abstract). Zimmet P (1991) Challenges in diabetes epidemiology--from West to the rest. Kelly West Lecture. Diabetes Care 15: 232-252. Zimmet PZ (1993) Hyperinsulinemnia--how innocent a bystander? Diabetes Care 16 (supplement3): 56--70. Zimmet P, Faaiuso S, Ainuu Jet al (1981) The prevalence of diabetes in the rural and urban Polynesian population of Western Samoa. Diabetes 30: 45-51. Zimmet P, Taylor R, Ram Pet al (1983) Prevalence of impaired glucose tolerance in the biracial (Melanesian and Indian) population of Fiji: a rural-urban comparison. American Journal of Epidemiology 118: 673-688. Zimmet P, Dowse G, Serjeantson S & King H (1990) The epidemiology and natural history of NIDDM-lessons from the South Pacific. Diabetes Metabolism Reviews 6: 91-124.