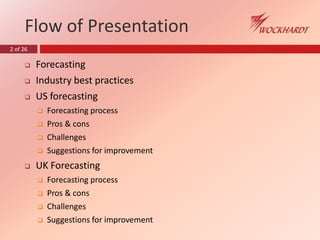
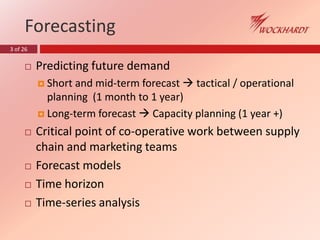
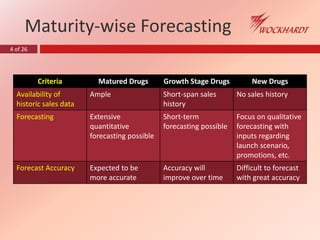
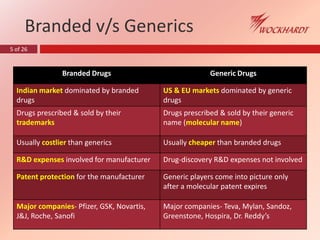
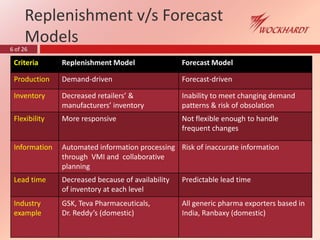
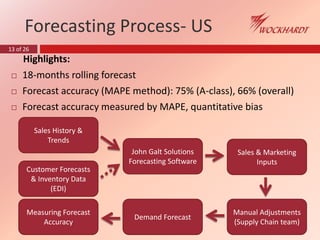
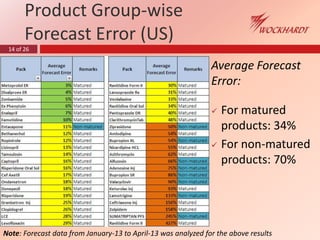
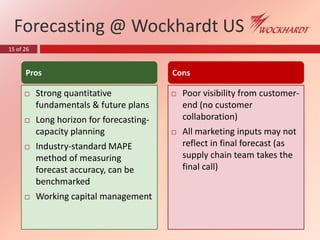
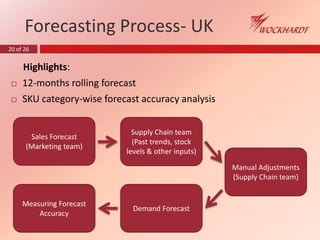
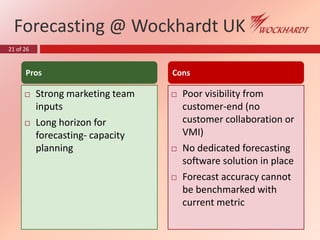
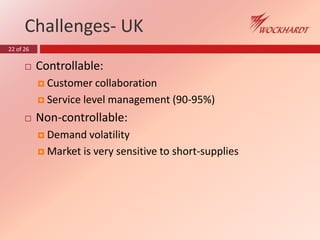
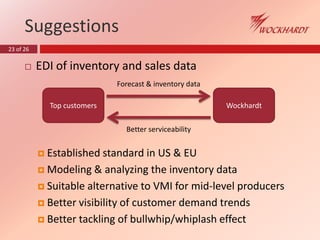
Japan IT Week 2024 Brochure by 47Billion (English)
Forecasting in Regulated Markets
1. 1 of 26
FORECASTING IN REGULATED MARKETS
(US & UK)
Kaustubh V. Kokane
Summer Trainee- Supply Chain
Mentor- Mr. Umang Gandhi (GM- Supply Chain)
27th June, 2013
Thursday
2. 2 of 26
Flow of Presentation
Forecasting
Industry best practices
US forecasting
Forecasting process
Pros & cons
Challenges
Suggestions for improvement
UK Forecasting
Forecasting process
Pros & cons
Challenges
Suggestions for improvement
3. 3 of 26
Forecasting
Predicting future demand
Short and mid-term forecast tactical / operational
planning (1 month to 1 year)
Long-term forecast Capacity planning (1 year +)
Critical point of co-operative work between supply
chain and marketing teams
Forecast models
Time horizon
Time-series analysis
4. 4 of 26
Maturity-wise Forecasting
Criteria Matured Drugs Growth Stage Drugs New Drugs
Availability of
historic sales data
Ample Short-span sales
history
No sales history
Forecasting Extensive
quantitative
forecasting possible
Short-term
forecasting possible
Focus on qualitative
forecasting with
inputs regarding
launch scenario,
promotions, etc.
Forecast Accuracy Expected to be
more accurate
Accuracy will
improve over time
Difficult to forecast
with great accuracy
5. 5 of 26
Branded v/s Generics
Branded Drugs Generic Drugs
Indian market dominated by branded
drugs
US & EU markets dominated by generic
drugs
Drugs prescribed & sold by their
trademarks
Drugs prescribed & sold by their generic
name (molecular name)
Usually costlier than generics Usually cheaper than branded drugs
R&D expenses involved for manufacturer Drug-discovery R&D expenses not involved
Patent protection for the manufacturer Generic players come into picture only
after a molecular patent expires
Major companies- Pfizer, GSK, Novartis,
J&J, Roche, Sanofi
Major companies- Teva, Mylan, Sandoz,
Greenstone, Hospira, Dr. Reddy’s
6. 6 of 26
Replenishment v/s Forecast
Models
Criteria Replenishment Model Forecast Model
Production Demand-driven Forecast-driven
Inventory Decreased retailers’ &
manufacturers’ inventory
Inability to meet changing demand
patterns & risk of obsolation
Flexibility More responsive Not flexible enough to handle
frequent changes
Information Automated information processing
through VMI and collaborative
planning
Risk of inaccurate information
Lead time Decreased because of availability
of inventory at each level
Predictable lead time
Industry
example
GSK, Teva Pharmaceuticals,
Dr. Reddy’s (domestic)
All generic pharma exporters based in
India, Ranbaxy (domestic)
7. 7 of 26
Effects of Ineffective Demand
Planning
Higher production cost
Overstocking or stock-outs
Inefficient logistics
Dissatisfied customers- losing to competition
FDA cracking up on expired drugs
9. 9 of 26
Data used for Forecasting
Primary Data
Point-of-sale data not readily
available
Proprietary patient data
(through third-party services
such as e-talk’)
Secondary Data
Purchase data from distributors
(fee-for-service)
Vendor-managed inventory
examples:
(US)
(Denmark)
Channel data (ex. Retailers’ IMS
access to pharma co’s-
- partnership)
Utilize sales force (feedback from
retailers)
10. 10 of 26
Pfizer (Australia)
Implemented standardized
forecasting tool
Developed demand management
skills
Integrated demand forecast review
process in business planning
11. 11 of 26
Teva Pharmaceuticals, UK
Was relying on stand-alone Excel sheets for
forecasting large no. of SKU’s (till 2009)
Laborious and time-consuming process
Implemented customized demand management
tool- RefleX to forecast & plan demand
Forecast accuracy improved from 65% to 80%
Seamless business integration thereafter
13. 13 of 26
Forecasting Process- US
Manual Adjustments
(Supply Chain team)
Customer Forecasts
& Inventory Data
(EDI)
John Galt Solutions
Forecasting Software
Sales & Marketing
Inputs
Demand Forecast
Sales History &
Trends
Measuring Forecast
Accuracy
Highlights:
18-months rolling forecast
Forecast accuracy (MAPE method): 75% (A-class), 66% (overall)
Forecast accuracy measured by MAPE, quantitative bias
14. 14 of 26
Product Group-wise
Forecast Error (US)
Average Forecast
Error:
For matured
products: 34%
For non-matured
products: 70%
Note: Forecast data from January-13 to April-13 was analyzed for the above results
15. 15 of 26
Strong quantitative
fundamentals & future plans
Long horizon for forecasting-
capacity planning
Industry-standard MAPE
method of measuring
forecast accuracy, can be
benchmarked
Working capital management
Poor visibility from customer-
end (no customer
collaboration)
All marketing inputs may not
reflect in final forecast (as
supply chain team takes the
final call)
Pros Cons
Forecasting @ Wockhardt US
16. 16 of 26
Challenges- US
Controllable:
Lack of visibility (customer side)
Penalties related to tendering
Non-controllable:
Demand volatility
Sales concentration- top 3 wholesalers
Market is very sensitive to short-supplies
17. 17 of 26
Suggestions
‘Bias’-based forecast accuracy monitoring
Consistently lower or higher forecast than actual sales
In April 2013 (forecasted over 4 months):
30% SKU’s – Under-forecasted
18% SKU’s – Over-forecasted
Causes:
Undetected patterns
“Beat the numbers” approach
Weighted bias / size-based bias
18. 18 of 26
Suggestions
Shift from MAPE to WMAPE (Weighed Mean Absolute
Percentage Error)
Yields more meaningful analysis of forecast accuracy
19. 19 of 26
Suggestions
Consensus forecasting:
Particularly for non-matured drugs (high uncertainty)
Concurrent forecasting team with SC and marketing
executives (S&OP)
Review supply and demand requirements frequently
20. 20 of 26
Forecasting Process- UK
Sales Forecast
(Marketing team)
Supply Chain team
(Past trends, stock
levels & other inputs)
Manual Adjustments
(Supply Chain team)
Demand Forecast
Measuring Forecast
Accuracy
Highlights:
12-months rolling forecast
SKU category-wise forecast accuracy analysis
21. 21 of 26
Strong marketing team
inputs
Long horizon for
forecasting- capacity
planning
Poor visibility from
customer-end (no
customer collaboration or
VMI)
No dedicated forecasting
software solution in place
Forecast accuracy cannot
be benchmarked with
current metric
Forecasting @ Wockhardt UK
Pros Cons
22. 22 of 26
Challenges- UK
Controllable:
Customer collaboration
Service level management (90-95%)
Non-controllable:
Demand volatility
Market is very sensitive to short-supplies
23. 23 of 26
Suggestions
EDI of inventory and sales data
Established standard in US & EU
Modeling & analyzing the inventory data
Suitable alternative to VMI for mid-level producers
Better visibility of customer demand trends
Better tackling of bullwhip/whiplash effect
Top customers Wockhardt
Forecast & inventory data
Better serviceability
24. 24 of 26
Suggestions
Quarterly benchmarking against competitors for
forecast accuracy and market share
Shifting to industry-standard metric of measuring
forecast accuracy (MAPE / WMAPE)
Particular Forecast Accuracy
US Generic Marketers ~70%
Wockhardt US 60-70%
Teva Pharmaceuticals UK 85%
25. 25 of 26
Suggestions
Validate forecasts for established drugs:
Scientific validation in statgraphics
Remove bias and better selection of forecasting model
Quantitative forecasting software:
Optimum use of available data; data mining
Useful for established products
26. 26 of 26
Kaustubh V. Kokane
Summer Trainee- Supply Chain
Mentor- Mr. Umang Gandhi (GM- Supply Chain)
Institute-
Prin. L. N. Welingkar Institute of Management, Mumbai
Thank You !
Editor's Notes
DRL- Symphony software support for pull-based replenishment
ForecastX is a forecasting tool from John Galt solutions.
US forecast accuracy data valid from Apr-12 to Mar-13A-class SKU- 42Total SKU- 180
Collaborative forecasting
Competitors like Teva are implementing customer collaboration strategies while servicing VMI model. In case of Wockhardt, FFS model would be a realistic alternative.
Teva’s forecast accuracy was 65% in 2009. They implemented a sophisticated customized demand planning tool- FOREX to forecast and plan for demand which improved their forecast accuracy to 85%