1. ⾏動應⽤程式市場普及程度之實證分析研究:論排⾏前
25之App特性
An Empirical Analysis On iOS App Popularity: On
App-specific Characteristics of App Crossing the
Top 25 Threshold
Abstract
This paper focuses on Apple App Store market and how app-specific characteristics––app
size, app name length, Chinese version and other factors––affect the probability of apps
crossing the top 25 ranking thresholds.
By stratified random sampling, 1,998 apps were selected from the App Store database. We
then applied logistic regression to examine the odds ratios of the determinants of crossing the
thresholds versus base category. Our results complement previous literature about factors
affecting the ranking; additionally, we found app size and app name length are significant to
the probability of crossing the threshold. Though Chinese version is not significant in base
model, its interaction is positively associated with certain categories.
Such insight could potentially benefit app developer’s planning in regards to their priority
of app development and corporate strategic decision.
Keywords: App Store popularity, App Store ranking, mobile application markets,
logistic regression, interaction effects in logistic regression.
2. 1
1. Introduction
Apps designed for tablets and smartphones have been one of the thriving businesses in
recent years. Among all the other major digital distribution platforms for mobile applications
like Google Play Store, Amazon Appstore, or Windows Store, Apple’s App Store (henceforth,
App Store) stands out from the competition in regards to total app revenues.
Mobile application markets (henceforth, MAMs) do show similarities like “The Long Tail,”
which has described merchandise such as books, music, games, and streaming services for its
great varieties (Chris, 2006). But MAMs have several distinct features from above services.
First, unlike other digital platforms of long tail markets, developers of apps can actually
interact with app users after the initial release. Based on users’ feedbacks and ratings,
developers can provide updated version to improve their product features (Lee & Raghu,
2014). Second, some specific App characteristics like app size, OS compatibility, the number
of languages, or available platform might have the impact on user’s incentive to install or
uninstall apps. Third, flexible monetization of apps is apparently different from books, music,
or other pay-to-receive online media content. Different sources of income such as
in-app-advertising and in-app-purchases make freemium strategy an option while a developer
can boost its active users first by making their apps free, then monetizes app in different ways
(Liu, Au, & Choi, 2014). Finally, developers could reuse their codes and as they accumulate
experiences of app development, they could build a portfolio of apps on various categories
faster (Lee & Raghu, 2014).
However, the data of App Store is restricted especially to the individual researchers and
most researchers only focused on apps listed on top 200 or 300 charts. Even though both
Google Play Store and App Store enable mining of ranked apps over top paid or top free
category, data of less popular apps was often unavailable or unable to observe (Hoon, Vasa,
Schneider, & Grundy, 2013); these apps are classified by research company, Adjust Inc. as
zombie apps which are apps that appear on no top list during two-third of their available days.
In order to include those neglected apps of less popular ones, we managed to
semi-manually select 1,998 apps by stratified random sampling method. Given the property of
collected data is cross-sectional; we averaged certain data to control the effects. In this paper,
we try to discover which app characteristics lead to better-performed apps.
Our major research questions are listed as below:
1.Does an app of greater size mean a higher chance of getting on the top 25 lists?
2.As China market led to all countries in absolute growth in 2015 Q3, does the app of
Chinese language localization feature outperform other competition (App Annie Inc.,
2015)?
3.Does OS compatibility of an app affect its chance getting on top list?
3. 2
4.What are the other possible app-specific factors, which might have an impact on crossing
the threshold?
Our work and the attempt to answer these questions could help developers to understand
an overall landscape of advantages with specific app categories over others, and how they
could improve their chance of getting apps on the top chart.
The rest of this paper is structured as follows: In section two, we explore related literature.
In section three, the data description, sampling method, and the applied theoretical model are
presented. In section four, we discuss the results of the empirical model estimation and the
interaction term. Finally, we conclude our findings and propose implications for future
researchers in section five.
2. Literature Review
2.1 The long tail phenomenon in digital economy
(Chris, 2006) popularized the term long tail that product of low sales volumes cluster
together could form a larger market share exceeding its bestsellers under the condition that the
channel distribution reached a certain scale. The researchers of the long tail market also
identify that similar patterns in another online-product categories such as CDs, DVDs, digital
cameras and etc. (Brynjolfsson, Hu, & Smith, 2006).
There were some unofficial data such as app sales revenue data released by famous app
developers like Joel Comm and Ajnavare Ltd showing that downloads of apps close to a
power-law distribution according to their ranks. (Garg & Telang, 2012) observed app data
within top 200 charts gathered in a month and estimated first rank iPhone app gets 150 times
more downloads than app ranked at 200 and the estimated number of downloads versus app
rank on top paid list also show a power-law distribution. Based on these related evidence, it is
reasonable to assume consumers of MAMs share certain similar behaviors to its wide
spectrum of App categories.
2.2 The effects of public ranking list
(Sorensen, 2007) analyzed the impact of the New York Times bestseller list on sales,
measuring the effect of public ranking information on demand and he found that the listed
book did receive a moderate increase in term of sales. Such behaviors of referring people’s
opinions could be explained by observational learning (Cai, Chen, & Fang, 2007); the field
experiment conducted in this paper shows once the popularity rankings revealed to customers
in a restaurant, the demand for top 5 dishes was increased by an average of 15 to 18 percent.
(Carare, 2012) investigated the observational effect on the basis of previous choices of
other consumers on App Store market, and he discovered that top 25 to top 50 list is an
important threshold. As app has made onto the top 25 or 50 appearing more likely to stay on
top charts than other apps that have not crossed the threshold. Interestingly, this top 25 to 50
threshold also corresponds to the rank charts displayed by the first two scrolling pages of App
4. 3
Store interface back in 2012 when the author conducted the observation. One noticeable
difference is now user can only find 20 apps displayed on first scrolling page, 40 apps shown
on two scrolling gestures and 100 apps on third in the current version of iOS App store. Such
change may cause an impact on sales of apps that normally ranked between top 40 to 50 list
because these apps now require three scrolling gestures to discover––considered the
additional search efforts, saliency effect and lack of observational learning effect. However, it
could be inferred that such change should not affect much on apps listed between top 20 to 25,
as these apps can still be found within two scrolling pages.
2.3 Factors related to App Store’s public ranking
From an insightful research on Google Play Store, offering a trial free version of an app
increases its ranking and is positively associated with its paid version’s revenues (Liu et al.,
2014). (Lee & Raghu, 2014) discovered the effects of App Developers’ diverse creation
across different app categories are examined to have positive impacts on increasing Apps’
longevity of staying on top charts. Like the empirical evidence mentioned from Play Store,
the authors also found out that offering Free Apps helps on App Store. Furthermore, factors
on ranking are initial App rank on top charts, investment in less popular categories, frequent
updates of App features and price, and higher user feedbacks; these are all positively
associated with the number of Apps published getting onto the top charts. It is worth
mentioning that (Carare, 2012) also discovered that initial app popularity breeds further
popularity.
This research seeks to investigate other influential factors to app ranking by including the
estimated effect of less popular apps––which are not normally observed by general users
unless they input exact or highly similar names to locate them on iOS mobile device. Our
research objective is taking the 25 thresholds as a major response variable, a key indicator to
measure app’s overall performance, to explore how these app-specific characteristics and
other covariates relate to the probabilities of crossing the top 25 thresholds.
3. Research Methodology
3.1 App Store data description, data collection, and sampling method
The iOS platform is specifically designed to operate on Apple’s touch devices, such as
iPod, iPhone and iPad. Apple’s role in App Store is intermediary, most of its app developers
are individual programmers given the low licensing fee (100 USD) to enroll the Apple
Developer Program for app distribution and those third party developers supplied majority of
apps on App Store.
According to a recent survey, App Store currently has around 2,099,838 active apps
available for download in January 2016 (Pocketgamerbiz, 2016). During the time we
collected data and counted pages on iTunes app preview webpage in September 2015, the
active apps were 1,920,850. There were total 23 categories until in December 2015, Apple
5. 4
took part of the life style apps and created a new category named “Shopping.”
On the top chart where users mostly browse apps, there are three major classes of apps:
top paid, top free and top grossing. In the top free category, the apps have a price of 0$ and in
the top paid category, the apps have a price greater than 0$––starting from 0.99$. The major
difference between top grossing and the other two is it lists apps with highest revenues.
Although Apple never discloses about their algorithm of ranking order or downloads of
the apps besides its quarterly aggregate download figures (Apple Inc., 2015). However, it is
well known within the community that Apple changes the algorithm indefinitely
(Gummicubecom, 2015). In November 2015, Apple was even suspected to manipulate its
own ranking algorithm so they could promote their own apps (Sarah Perez, 2015).
Unknown to information of specific app downloads or revenues, our focus will be on top
free and top paid apps. Data used in this research were collected on iTunes preview webpage
of Apple Store in a manner of random stratified method. To include these less popular apps to
our base data for analyzing, we first managed to mark every alphabetical page a numeric id
sequentially from different categories respectively, and then from each category we randomly
selected pages out of the mapped 11,041 pages proportionally of the category to total mapped
page numbers on 17th
, August. Once we marked the page id, we randomly sampled one of the
apps from the marked page according to a number that random function of excel generated.
Table 1 All available categories while we conduct our research
App data was collected for a period of 116 days between 17th
, August and 11st
, December.
Due to the technical difficulties and time restriction, we were not able to measure all the
covariates full time and decided to average several variables of properties that possibly
change overtime such as rating counts, app active time, app current version age and etc. Those
data were taken, fixed on two dates, 17th
, November and 11st
, December and then we
averaged each two numbers gathered for these variables as explanatory variables. While other
variables without time property were collected earlier such as app name, available languages,
Chinese version, IAP option, available platform and developer’s total number of app creation
for iPhone and iPad. As for the major outcome variable––whether app crossing top 25
thresholds––were consistently checked and monitored during the research period. More about
variables will be presented in section 3.3.
6. 5
3.2 Logistic regression analysis
In this paper we used logistic regression model to analyze different app categories, and
other factors on how these related to better chance of crossing the top 25 thresholds, which is
how we define successful apps out of the selected samples. Multiple linear regression method
was considered, but we chose logistic regression for its flexibility to handle binary variables.
Apple Inc. currently has different ranking lists on App Store for total 155 countries. We
classified apps which ever crossed the 25 thresholds in any countries as outcome 1 during our
research period of 116 days. These apps were defined as better-performed apps than other
apps, which have never crossed thresholds in 155 country charts.
The outcome of crossing the thresholds is the dichotomous response, either 1, crossing or
0, not crossing––expressed as Pr(Y = 1|x) = π(x). In our empirical model, a collection of j
independent explanatory variables are denoted by the vector x’ = (x1 + x2 + x3 +…+ xj) and 𝛽i
is the coefficient for independent variable xj. The logit transformation on the probabilities is
given by the equation (1), where the term π(x)/1- π(x) is called the odds. Here it means the
probability of crossing top 25, divided by the probability of not crossing top 25, which the
number of odds can be between minus and plus infinity––makes the linear function possible
with predictors below.
ji xxx
x
x
xg ββββ
π
π
++++=
−
≡ ...)
)(1
)(
ln()( 22110 (1)
)...(
)...(
)(
)(
22110
22110
11
)( ji
ji
xxx
xxx
xg
xg
e
e
e
e
x ββββ
ββββ
π ++++
++++
+
=
+
= (2)
In logistic regression model, maximum likelihood estimation was used to estimate the
variances and covariances of the coefficients (Rao, Foltys, & Toutenburg, 1973). The
estimators are obtained from the matrix of second partial derivatives of the likelihood
equation. Because the maximum likelihood properties define that the regression coefficients
are approximately normally distributed in large samples, it is possible to test the statistical
significance of our app-specific variables by z test. This paper will not cover the rest of
detailed calculation for maximum likelihood implementation, interested readers may find
more explanation in reference book, generalized linear models (McCullagh & Nelder, 1989).
3.3 Design variables and explanatory variables
3.3.1 Design variables
In order to generalize our findings and especially for interaction terms, we classified
similar target audience of app categories into a simplified list of groups and use several design
variables (or dummy variables) for these independent variables to examine the relative odds
7. 6
ratio of category differences.
Table 2 The generalized groups and their corresponding percentages on the App Store
In table 2, we define various tool apps of practical usages as pragmatic. Entertainment and
games are defined as gaming due to their amusement purpose. Shopping group consists apps
related to online goods-browsing, fashion and other fulfillment to sensational desires.
Socializing defines apps related to photo-editing and social media networking. Books,
education and references are defined as learning because of basic functions for mostly reading,
displaying and educational purposes. News defines those packaged information about current
or recent events. Music, fitness and sports are defined as relaxing apps due to the recreational
purposes and the distinguishing trait, which users usually do not concentrate on the screen
that differentiates this category from the pragmatic group.
In interpretation section, we will cover more about odds ratio terms, predicted probabilities
and marginal effects of dummy variables and focus variables considered.
Table 3 Summary statistics of app-specific characteristics under generalized categories
8. 7
3.3.2 Explanatory variables
Details about the chosen predictors are briefly discussed as follows:
1. OS_age: A continuous variable representing an app’s least compatible iOS version. We
coded each iOS sequentially and the number ticked every time Apple officially announce an
update from the first version to the latest iOS release. For example, the first iPhone OS 1.0
was coded as 1 and the more recent iOS 9.2 was coded as 81. App OS compatibility relates to
devices’ computing speed or new hardware features that users might not be able to download
an app without having the latest model of iPhone. For instance, an iPhone 4 of iOS version
5.0 may not run apps of required least compatibility of iOS 7.0; yet, iPhone 5S of iOS version
9.2 may run all the apps of previous least compatible versions. In this paper, our research
methodology on this matter is restricted to observations of least compatibility.
From a developer’s perspective, making apps compatible to only latest iOS could reduce
their market exposure. Furthermore, a more recent version might occupy more storage space
and makes devices of previous generation slower. It might also be a trade-off parameter for
developers to decide a suitable iOS version to approach maximizing-level of target audience
at the cost of some new OS features. Previous Apple mobile devices like iPhone 4 won’t be
compatible with apps of latest iOS version as some functions require new components that
were not even invented in earlier times.
2. App_size: The downloading size of an app. Apple has recently announced to increase
the size limit of an app submitted through iTunes Connect from 2 GB to 4 GB in February
2015 (Apple Inc., 2016). App size is an interesting aspect and its impact has rarely been
mentioned in previous literature. According to Apple’s iOS developer library, required
installing size of an app could be slightly variant depending on the device the downloader
possesses. In this analysis we controlled and took the size value extracted on iTunes preview
page. As larger size grants higher resolution, additional features and content. A larger size app
might occupy much of an user’s storage space and encourages the user to uninstall the app
once the particular task is fulfilled, which makes this app-specific parameter a trade-off to
developers.
Figure 1 Frequency charts of appsize and app name length
3. Words: A continuous variable representing an app’s name length. We define the
050100150
Frequency
0 500 1000 1500 2000
appsize
0100200300400500
Frequency
0 10 20 30 40
words
9. 8
amounts of spaces (punctuation) in an app name as the name length. The app search engine on
App Store is found to be in favor of languages consisted spaces and Chinese, Japanese and
Korean are those exceptions.
As the basic writing unit is hieroglyph in Chinese, this means that a Chinese sentence
(also occurred to some of the Japanese and Korean apps) is still counted like a single word in
Apple’s App Store search engine. One cannot input a separated-hieroglyph app name and
expects to see a partial matched result for Chinese apps. In our data, we therefore still define a
Chinese sentence (without a space) a single word as well as Japanese and some Korean apps.
4. App_active_time: A continuous variable representing an app’s total elapsed days since
its initial release date.
5. Current_age: A continuous variable representing the existing months of an app’s
current version. The unit measurement is month.
6. Update_ver: A continuous variable representing an app’s total update versions.
7. In-app-purchase (IAP): A dummy variable that represents extra content and
subscriptions that user can buy in apps. Free apps though require no initial payment to
download the app; part of its usability might be restricted and only through in-app-purchase
can user unlock full or other functions.
8. App_price: A continuous variable representing an app initial payment in USD currency.
Table 3 presents summary statistics of variables divided by pay method. We define paid apps,
as apps were tagged price longer than tagged free on App Store. As for paid apps, the full
function is usually unlocked when the price tag is paid before download and paid apps have
much less IAPs than free apps in our observations. Among the total 1,998 selected app
samples, there are 542 paid apps and 1,456 free apps and only 8 paid apps have IAPs out of
110 total IAPs selected––around 7.27%.
9. Iphone_dev & Ipad_dev: Continuous variables which the numbers are the total amount
of apps the app developer published on iPhone or iPad. The amount of apps might infer an
app developer’s accumulated experiences.
10. Languages: A continuous variable representing an app’s available languages. At the
earlier stage of data collection, we noticed that some scrapped data about app description of
language were not updated or wrong. It might be because most app developers don’t
distribute or advertise their creation through iTunes preview page.
11. Chinese: A dummy variable indicating whether an app has a native Chinese version or
a Chinese localized version. Either simplified or traditional Chinese are categorized as
Chinese version.
12. Platform_dist: A trichotomous variable representing the platform the app was
specifically designed for.
10. 9
13. Rating & Rating_count: These two variables are the review rating and cumulative
numbers of reviews. In table 5, the summary statistics of samples sorted by free and paid
categories, the numbers of rating and rating counts were censored because majority of apps do
not receive any rating and rating counts. Once a user gives a review, rating assessment was
required to submit his review. That many rating counts represent equally many times of
rating.
Table 4 Descriptive statistics of variables included in the logistic regression model
4. Empirical results
4.1 Discussion on summary statistics
We classified explanatory variables into two parts in our analysis, which are those
app-specific variables such as OS age, app size, IAP option, and etc. The other part consisted
the feedback variables from market––rating and rating counts.
Speaking on average, Paid apps are 26.73 MB larger than free apps in app size, made
436 days earlier and compatible with older OS (around 7 versions, 270 days older). Paid apps
are also updated less frequently and have longer app name length as our sampled data shows.
The subtle difference in size between paid apps and free apps might indicate that paid apps in
general have more content and features that require larger storage space.
The older OS in paid apps could be the outcome of freemium strategy trend in current
11. 10
MAMs––more and more developers tend to expand their client base via offering free price
before monetizing their merchandise. And the older OS could also mean that: first, developers
of paid apps still think about the potential market share of outdated devices. Second, paid
apps usually require longer time to develop and cannot adjust to the latest OS consequently.
Table 5 Summary statistics of the 1,998 randomly selected apps.
Free apps have 4% more of Chinese version available, 1,549 more user rating counts and
slightly better rating than paid apps. This may imply the paid app users expect more when
they pay the initial payment compare with free apps. The more percentage available in
Chinese version in free apps might imply that apps have higher price elasticity of demand for
native Chinese mobile users than App Stores of other countries. Only after people try them
out are they willing to pay via IAP method. Pan-Asian market is also becoming more and
more prominent to App Store considering the revenue it generates and the YoY growth (App
Annie Inc., 2015).
Few apps were updated frequently between free and paid modes and these developers
switched the app from paid to free intentionally to boost its ranking order temporarily and
then switched it back to realize their popularity to revenues. In our data, we fixed this
difference by defined free and paid apps on 11st
, December. Such behavior corresponds to
(Liu et al., 2014)’s findings on another MAM––Google Play Store––and also applies to the
App Store ranking algorithm estimates (Garg & Telang, 2012). However, the relationship of
update frequency and the sales revenues in regards to an app’s popularity will not be covered
here.
4.2 Basic model of logistic regression
We ran logistic regression with 3 different models. The category differences are coded as
12. 11
6 dummies with learning category as the base one. The reason is mainly because the learning
apps are those of the most basic function––reading and also the oldest category considered its
OS age and active time.
In model 1 we began with only 6 dummies of category differences. If the chi-square is
significant, it means at least one beta is not zero in the model. The result of model 1 in table 6
suggests with a value of 6.28 and 6 degrees of freedom, and the chi-square is not significant
with only category dummies.
In model 2 we explore the category differences in crossing the threshold that explained
by including app-specific characteristics. The chi-square shows highly significant result. The
result also implies that app size may have a non-linear effect on log odds of crossing the
threshold. The coefficients 𝛽i, and how to interpret its unit change to odds ratio term would
be briefly introduced. From equation (2), the exp(𝛽i) is the estimated odds ratio of a unit
change on xj.
Table 6 Coefficients or logistic regression models of crossing the thresholds
13. 12
This change in xj represents that the odds of crossing the top 25 threshold are exp(1.112)
= 3.07 times higher for relaxing apps as the odds for learning apps. Same odds ratio
interpretation applies to pragmatic 2.14 times, gaming 1.83 times, and shopping 2.5 times
versus learning apps when everything else held constant. A commonly misinterpreted
perspective is to say relaxing apps have 3.07 times higher probability than learning apps. As
in equation (3) follows the odds ratio for relaxing versus learning,
Pr (1− Pr)
Pl (1− Pl)
=
Pr
Pl
⎛
⎝
⎜
⎞
⎠
⎟
1− Pl
1− Pr
⎛
⎝
⎜
⎞
⎠
⎟ (3)
and the misinterpretation is apparently not true because it only explains Pr Pl( ), which is
called relative risk of crossing the threshold (Hosmer Jr, Lemeshow, & Sturdivant, 2013).
Other coefficients reveal that several app-specific variables have impacts on crossing the
threshold: app size, app size square, words count, active time, current version duration, update
times, IAP, Chinese version, and apps on universal platform all show certain level of
significance.
Then we included user feedback-related predictors––rating and rating counts––to model
3 in table 6. Besides rating and rating counts, we observed similar significant impacts from
model 2. However, some variables are no longer significant such as Chinese and app size
square.
Based on empirical evidence of related literature, we expect app-specific predictors such
as update times, app active time, current version age, rating, and rating counts to be
significant (Lee & Raghu, 2014). As update times, current version age can be explained by
update frequency, rating and rating counts by the higher user feedback effects, and IAP by
free-offering effects––One similarity between trial-version-offering of paid apps and free apps
with IAP option is that mobile users can both try before they make any purchase.
Except data shows creating universal apps better than separate iPhone or iPad apps, what
intrigues us is the effects of app size, Chinese version, word counts (app name length) and the
favorable categories. Getting back on our research questions: greater app size does increase
the odds crossing the threshold and it could have negative impact if the app size is too large.
Chinese version might have some impact on increasing the odds, but it became not significant
after we included the feedback predictors––rating and rating counts; in the interaction part we
will explore the interaction term between Chinese and different categories. OS least
compatibility is not significant according to our results. About the other possible app-specific
factors, interestingly, the app name length shows significantly to have impacts on crossing the
threshold. It could be that app of longer name increases their probability of being found via
keyword search, or partial match search and longer name, which is usually descriptive,
prevent the occurrence of being swarmed among the similar crowd.
14. 13
Table 7 Odds ratio table of variables of interests
The table 7 expressing the percentage change to odds for each unit change in X the when
other predictors are controlled. For instance, the words count in model 3 meaning that app
name of 5 words increases the odds of getting onto the top 25 threshold by 100%*(eβ
−1)
equivalent to 5*12.55%=62.75%.
4.3 Estimation of the marginal effect in logistic regression
Unlike linear regression models, logistic regression is non-linear; the unit change of xi
does not represent the impact on probability but means that each unit increase multiplies the
odds by exp(βi ). If we took a partial derivative of equation (2) with respect to xi while 𝛽i is
coefficient of xi,
∂π(x)
∂xi
= βi *π(x) 1−π(x)[ ] (4)
we would observe the probability varies with the partial slope. It means the impact of xi can
not be constant and the marginal effects change along the curve; the value of the partial slope
calculated only applies to certain level of π(x)(DeMaris & MacDonald, 1993). Therefore, in
order to estimate the marginal effect of one predictor, we must indicate values for all other
independent variables specifically. Once we have controlled all the other variables except xi,
which is what we are going to observe the unit change, we can then examine the odds ratio
change caused by xi and obtain a new probability accordingly. The implication is that the
marginal effect estimated on categorical predictor is easier to comprehend mathematically
than continuous predictors.
Intuitively, the average marginal effects for significant category-differences are
computed as they were learning apps, while controlled other variables and then estimate the
probability of crossing the threshold. Then the software does the same but treats the app as it
were pragmatic apps, respectively. The difference in the two probabilities is the marginal
effect (Williams, 2012).
15. 14
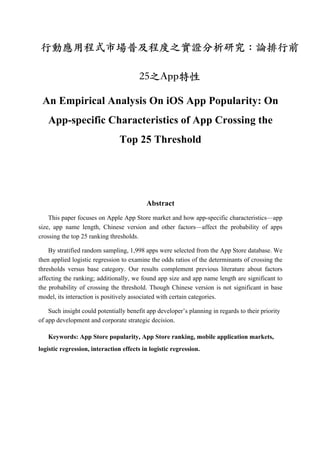
Figure 2 The average marginal effects of generalized categories for different app sizes
and app name length
When we estimated marginal effects for different app name length and app size by
design variables based on model 3, we observed the effects of category differ by name length
and size as shown on figure 8 and 9. The effect of app name length increases as it gets more
positive while app size shows a non-linear impact after the app size gets larger than 1 GB
which proves our earlier speculation that though larger size grants more content, it also
occupies more storage space and decreases the probability of crossing the threshold with
respect to learning apps.
The marginal effects of Chinese version are not studied here because Chinese variable is
not significant in base model 3.
4.4 Interpretation of the interaction term
To investigate the interaction between x1 and x2 for their effects on log odds, we have to
assume that x1 and x2 only interact with each other and not with other variables in the model.
g(x) = ln
π(x)
1−π(x)
⎡
⎣
⎢
⎤
⎦
⎥= β0 + β1 + β3x2( )x1 + β2 x2 + βi xj∑ (5)
∴
∂g(x)
∂x1
= β1 + β3x2
Having checked all the possible combinations of variables in interaction, we conclude the
significant interaction terms in model 5 with the component terms of model 3 in table 9. If we
took a derivative on equation (5) with respect to x1, partial impact of x1 on log odds would be
β1 + β3x2 , meaning the change of x1 depends on change of x2. This implies that the
multiplicative impact of x1 on the log odds is exp β1 + β3x2( ) while controlling other
variables in the model.
In model 5, the interaction between shopping apps and Chinese version, the coefficient for
0.05.1.15.2
EffectsonPr(Intop25)
0 100 200 300 400 500 600 700 800 900 100011001200130014001500
appsize
Pragmatic apps Gaming apps
Shopping apps Relaxing apps
Average Marginal Effects
.02.04.06.08.1.12
EffectsonPr(Intop25)
1 2 3 4 5 6 7 8 9 10
words
Pragmatic apps Gaming apps
Shopping apps Relaxing apps
Average Marginal Effects
16. 15
shopping apps is 0.575, whereas the coefficient for shopping#chinese is 1.758. The impact of
the multiplicative on odds of crossing the top 25 threshold is therefore
exp(0.575+1.758*Chinese). To interpret the interaction, we may say that among shopping
apps, when there is Chinese version available for this category, the odds of crossing top 25 is
exp(2.332) = 10.31 versus learning apps. It is much higher compared with shopping apps of
no Chinese version available: exp(0.575) = 1.78 versus learning apps.
Table 8 Interaction terms with main effects of model 3
If we translated the odds to probability, shopping apps of Chinese version increase
27.17% of probability crossing the threshold than shopping apps without Chinese version.
The figure 6 tells the change in probability by interaction between Chinese version and
shopping apps versus base category. The upper curve shows the impact of Chinese version
getting positive before app size of 500 MB. The other category Chinese version interacts is
relaxing and having Chinese version increases 33.45% probability of crossing the threshold
among relaxing apps versus learning apps.
The second app-specific predictor interacts with relaxing apps is app size; the data reveals
17. 16
that relaxing apps with greater app size performed better than other relaxing apps. The figure
7 shows the average marginal effects of app size with relaxing apps of Chinese version and
without Chinese version. The impact of Chinese version and app size get significantly
positive before app size of 200 and 300 MB respectively.
Our interpretation is that the subtle enriched content in relaxing category would increase
the odds of crossing versus learning category as well as Chinese version.
Figure 3 The average marginal effects of shopping and relaxing apps with and without
Chinese version
The interaction of Chinese version implies hedonic categories included in our generalized
groups for Asian audience of App Store market might be an emerging trend. The summary of
the interaction terms and their differences in probability comparatively are sorted in table 10.
Table 9 Summary of interaction terms––Chinese and app size with design variables
Note. 1: Assume the app size is 33.17 at total average. Among relaxing apps, 33.17 MB size can
increase 13.53% of crossing the threshold versus learning apps.
5. Conclusions, research restriction, and implication for future
researchers
The empirical approach included those considered zombie apps help us see a much clear
picture toward the business ecosystem of Apple’s App Store. To summarize empirical results
to our research questions:
1. Does an app of greater size mean higher chance of getting on the top 25 list?
Yes and no. App size is positively associated with enhanced odds of crossing the top 25
threshold. Although Apple Inc. has increased size limit of an app to 4 GB in mid 2015, our
data indicates app of size larger than 1 GB has negative impact on the odds of crossing
-.20.2.4.6
EffectsonPr(Intop25)
0 200 400 600 800 1000
appsize
chinese_yn=0 chinese_yn=1
Average Marginal Effects of shopping apps with 95% CIs
-.50.51
EffectsonPr(Intop25)
0 200 400 600 800 1000
appsize
chinese_yn=0 chinese_yn=1
Average Marginal Effects of relaxing apps with 95% CIs
18. 17
threshold.
2. As China market led to all countries in absolute growth in 2015 Q3, does app of
Chinese language localization feature outperform other competition?
Yes and no. Chinese version does not show significance in our base model, but it interacts
with shopping and relaxing categories and enhances their odds of crossing the threshold. We
have reasons to believe that the search engine on App Store are not optimized for Asian
languages such as Chinese and Japanese language of no spaces in between thus prevented
users finding them through partial match method. Once the App Store improves its search
function, the impact of Chinese localization might be significant afterwards.
3. Does OS compatibility of an app affect its chance getting on top list?
We don’t know for sure yet. Although new iOS always updates with new features and
functions, we do not find it statistically affect chance getting on the top 25 thresholds in any
of our testing models as our data only provides least compatibility. We can only claim that the
least OS compatibility does not affect the chance crossing the thresholds in our research.
4. What are the other possible app-specific factors, which might have impacts on
crossing the threshold?
Besides corresponding to previous works that update frequency and higher user feedback
have significant impact on app performance, additionally we have discovered that app name
length is positively associated with odds of crossing the threshold. The examination on
generalized categories in this paper indicates certain categories––pragmatic, gaming,
shopping and relaxing––the categorical advantage exists on App Store that the likelihood for
these apps to cross the thresholds are higher at different levels than learning apps.
In the interaction terms, we explored some categories have interaction with some of the
app-specific predictors––rating counts and app size––and to develop shopping and relaxing
apps in Chinese could potentially be considered than other less competitive options.
We believe our empirical approach not only contributes to academic literature on digital
economy but also useful to managers and entrepreneurs of MAMs. Developers may adjust
their strategies according to their understanding toward these app-specific factors. They
should find a balance between app sizes and content, neglect the latest features from new iOS
and try to be more descriptive in their app name. We also encourage Apple Inc. to improve
their search algorithm for several Asian languages especially Chinese as Apple apparently
does not optimize their store search functions for these Asian mobile users.
5.1 Research restriction and the implication to future researchers
I believe that we have tried to touch the most salient app-specific features by the logistic
regression. Due to the time restriction and technical difficulties of data collection, our analysis
19. 18
could have been more completed with data set that observed across longer period of time
instead of merely 3 months. Given sufficient random samples, the generalized table could be
more concise and accurate.
The effects of big publishers cannot be studied in our analytic approach since only few of
our samples crossed the top 25 thresholds and in fact, none of our selected apps belong to
those famous developers. Further more, the Chinese version might have endogeneity problem
as some apps developed Chinese version only after they attained popularity and success.
Though we did not find an appropriate instrumental variable to explain the unobserved
heterogeneity within our research period.
We consider various methods to improve our research if provided with a larger number of
dataset. If our sampling data were sufficiently large, the generalization on app categories
would have been eschewed. To model different ranking thresholds a polytomous dependent
variable could be a possible fit if researchers wish to extend our approach towards different
thresholds. Should future interested researchers overcome difficulties getting longitudinal data,
the analysis on predicting market trend would surely help us to prevent making blunder
decisions like paying hundred million dollars for an app acquisition.
References:
Apple Inc. (2015). Q3 2015 Unaudited Summary Data. Retrieved 8th
January, 2016 from
https://www.apple.com/pr/pdf/q3fy15datasum_2.pdf
App Annie Inc., B. (2015). App Annie Blog. Retrieved 19th
December, 2016, from
http://blog.appannie.com/app-annie-index-market-q3-2015/
Apple Inc. (2016). Applecom. Retrieved 15th January, 2015, from
https://developer.apple.com/news/?id=02122015a
Brynjolfsson, E., Hu, Y. J., & Smith, M. D. (2006). From niches to riches: Anatomy of the
long tail. Sloan Management Review, 47(4), 67-71.
Cai, H., Chen, Y., & Fang, H. (2007). Observational learning: Evidence from a
randomized natural field experiment: National Bureau of Economic Research.
Carare, O. (2012). THE IMPACT OF BESTSELLER RANK ON DEMAND:
EVIDENCE FROM THE APP MARKET*. International Economic Review, 53(3),
717-742 %@ 1468-2354.
Chris, A. (2006). The long tail: Why the future of business is selling less of more: New
York: Hyperion.
20. 19
DeMaris, A., & MacDonald, W. (1993). Premarital cohabitation and marital instability: A
test of the unconventionality hypothesis. Journal of Marriage and the Family,
399-407 %@ 0022-2445.
Garg, R., & Telang, R. (2012). Inferring app demand from publicly available data. MIS
Quarterly, Forthcoming.
Hoon, L., Vasa, R., Schneider, J.-G., & Grundy, J. (2013). An analysis of the mobile app
review landscape: trends and implications. Faculty of Information and
Communication Technologies, Swinburne University of Technology, Tech. Rep.
Hosmer Jr, D. W., Lemeshow, S., & Sturdivant, R. X. (2013). Applied logistic regression
(Vol. 398 %@ 0470582472): John Wiley & Sons.
Lee, G., & Raghu, T. S. (2014). Determinants of Mobile Apps' Success: Evidence from the
App Store Market. Journal of Management Information Systems, 31(2), 133-170
%@ 0742-1222.
Liu, C. Z., Au, Y. A., & Choi, H. S. (2014). Effects of Freemium Strategy in the Mobile
App Market: An Empirical Study of Google Play. Journal of Management
Information Systems, 31(3), 326-354 %@ 0742-1222.
McCullagh, P., & Nelder, J. A. (1989). Generalized linear models (Vol. 37 %@
0412317605): CRC press.
Rao, C. R., Foltys, H., & Toutenburg, H. (1973). Lineare statistische Methoden und ihre
Anwendungen (Linear statistical inference and its applications, dt.-Übers.: Helge
Toutenburg.) In dt. Sprache hrsg. v. Heinz Foltys.
Sorensen, A. T. (2007). BESTSELLER LISTS AND PRODUCT VARIETY*. The journal
of industrial economics, 55(4), 715-738 %@ 1467-6451.
Williams, R. (2012). Using the margins command to estimate and interpret adjusted
predictions and marginal effects. Stata Journal, 12(2), 308 %@ 1536-1867X.