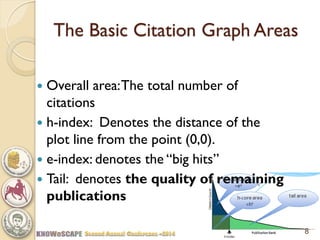
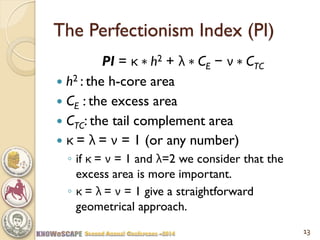
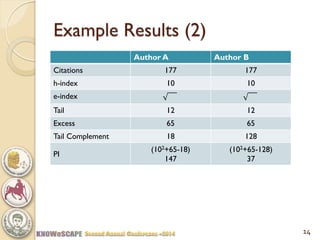
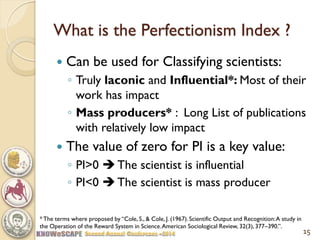
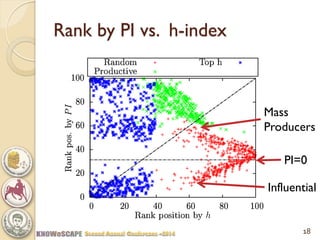
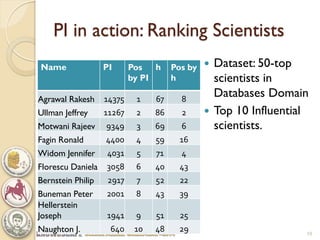
Perfectionism Index: Identification of Influential Scientists vs. Mass Producers 
1
2 
What is “Science”? 
“A branch of study in which facts are observed and classified, and, usually, quantitative laws are formulated and verified: involves the application of mathematical reasoning and data analysis to natural phenomena” 
Dictionary of Scientific and Technical Terms 
Science is developed every second, everywhere ! 
Are all these science products of great importance?
What if we could measure “Science” itself 
Careers in science are not only scientific; they also depend on: 
◦luck 
◦social connections 
◦the ability to impress influential people and referees 
◦the foresight to join the right lab at the right time 
◦the foresight to associate oneself with prestigious people and prestigious projects 
Such systems waste scientific talent and produce resentment 
3
What if we could measure “Science” itself 
Promotion strictly according to scientific merit would revolutionize scientific career 
Scientific production: the basis for any measurement of scientific merit 
◦Scientific production consists of: 
published articles (in premium quality venues†) 
and their impact (article citations) 
4 
† A Sidiropoulos, Y Manolopoulos. “Generalized comparison of graph-based ranking algorithms for publications and authors”, Journal of Systems and Software 79 (12), 1679-1700, 2006
5 
Measuring “Science”… 
Can we quantitatively measure the output of science? 
YES! we can… 
•Numerical indices (based on citation analysis) for quantification of published research output are being increasingly used by: 
•employers for hiring personnel 
•promotion panels: promotions, tenure 
•funding agencies: “Funding does not regenerate funding. But reputation does.”
Measuring Science… 
Citation Count 
Publication Rank 
Citation Graph 
h-index 
h-core area =h2 
(i,j)  the ith ranked pub received j citations 
For an individual the basic scientometric view is the citation graph 
J. E. Hirsch. An index to quantify an individual’s scientific research output. Proceedings of the National Academy of Sciences, 102(46):16569–16572, 2005. 
6
Citation Count 
Publication Rank 
Citation Graph 
h-index 
h-core area =h2 
excess area† =e2 
tail area 
7 
† Zhang, C. T. (2009). The e-index, complementing the h- index for excess citations. PLoS One, 4(5), e5429.
The Basic Citation Graph Areas 
Overall area: The total number of citations 
h-index: Denotes the distance of the plot line from the point (0,0). 
e-index: denotes the “big hits” 
Tail: denotes the quality of remaining publications 
8
The Tail of the Citation Graph 
Tail: 
◦short and wide tail denotes that 
there are no many publications in the tail 
These pubs got a relatively significant number of citations 
◦long and slim tail means that 
The researcher is productive 
The “products” did not have enough acceptance by the research community 
 massive productivity with not enough acceptance 
Conclusion: the tail carries important information 
9
Example 
0 
5 
10 
15 
20 
25 
30 
35 
1 
3 
5 
7 
9 
11 
13 
15 
17 
19 
21 
23 
Times Cites 
Publication rank 
Author A 
Author B 
y=x 
Author A vs. Author B 
CA=CB 
h-indexA=h-indexB 
e-indexA=e-indexB 
TailA=TailB 
Tail-LengthA ≠Tail- LengthB 
10
Example 
0 
5 
10 
15 
20 
25 
30 
35 
1 
4 
7 
10 
13 
16 
19 
22 
Times Cites 
Publication rank 
Author B 
0 
5 
10 
15 
20 
25 
30 
35 
1 
4 
7 
10 
13 
16 
19 
22 
Times Cites 
Publication rank 
Author B 
Tail Complement 
11
Example Results 
Author A 
Author B 
Citations 
177 
177 
h-index 
10 
10 
e-index 
Tail 
12 
12 
Excess 
65 
65 
Tail Complement 
18 
128 
12
The Perfectionism Index (PI) 
PI = κ ∗ h2 + λ ∗ CE − ν ∗ CTC 
h2 : the h-core area 
CE : the excess area 
CTC: the tail complement area 
κ = λ = ν = 1 (or any number) 
◦if κ = ν = 1 and λ=2 we consider that the excess area is more important. 
◦κ = λ = ν = 1 give a straightforward geometrical approach. 
13
Example Results (2) 
Author A 
Author B 
Citations 
177 
177 
h-index 
10 
10 
e-index 
Tail 
12 
12 
Excess 
65 
65 
Tail Complement 
18 
128 
PI 
(102+65-18) 147 
(102+65-128) 37 
14
What is the Perfectionism Index ? 
Can be used for Classifying scientists: 
◦Truly laconic and Influential*: Most of their work has impact 
◦Mass producers* : Long List of publications with relatively low impact 
The value of zero for PI is a key value: 
◦PI>0  The scientist is influential 
◦PI<0  The scientist is mass producer 
15 
* The terms where proposed by “Cole, S., & Cole, J. (1967). Scientific Output and Recognition: A study in the Operation of the Reward System in Science. American Sociological Review, 32(3), 377–390.”.
Experiments 
Dataset based on MS Academic Search API 
3 datasets: 
◦Random: 500 authors from CS 
with P≥10 and C≥1 
◦Productive: 500 top authors from CS based on number of publications 
found P≥354 
◦Top h: 500 top author from CS based on h-index 
found P≥92 
16
Rank by Total Citations vs. h-index 
(i,j)  ranked ith position by h-index and jth by C (normalized percent) 
17 
* Michael Nielsen, Why the h-index is little use, http://michaelnielsen.org/blog/why-the-h-index-is-virtually-no-use/ , 2008
Rank by PI vs. h-index 
PI=0 
18 
Influential 
Mass Producers
PI in action: Ranking Scientists 
Name 
PI 
Pos by PI 
h 
Pos by h 
Agrawal Rakesh 
14375 
1 
67 
8 
Ullman Jeffrey 
11267 
2 
86 
2 
Motwani Rajeev 
9349 
3 
69 
6 
Fagin Ronald 
4400 
4 
59 
16 
Widom Jennifer 
4031 
5 
71 
4 
Florescu Daniela 
3058 
6 
40 
43 
Bernstein Philip 
2917 
7 
52 
22 
Buneman Peter 
2001 
8 
43 
39 
Hellerstein Joseph 
1941 
9 
51 
25 
Naughton J. 
640 
10 
48 
29 
19 
Dataset: 50-top scientists in Databases Domain 
Top 10 Influential scientists.
Conclusion 
We introduced PI to provide quantifiable definitions of earlier qualitative classification schemes for the output of scientists 
PI is uncorrelated with any other known metric. 
the value of zero for PI is a key value: 
◦PI>0  The scientist is influential 
◦PI<0  The scientist is mass producer 
More Results can be found at: 
◦http://arxiv.org/abs/1409.6099 
20
Ongoing and Future work 
Perfectionism Index and Skyline Ranking for Journals 
21 
† A. Sidiropoulos, D. Katsaros, and D. Manolopoulos. “Generalized Hirsch h-index for disclosing latent facts in citation networks”. Scientometrics, 72(2):253–280, 2007. 
Temporal issues: Contemporary† Perfectionism Index 
The skyline operator for combining multiple rankings
Thank you for your attention 
Questions ? 
Contact & Info: 
◦Antonis Sidiropoulos: https://sites.google.com/site/asidirop/ 
◦Dimitris Katsaros: http://inf-server.inf.uth.gr/~dkatsar/ 
◦Yannis Manolopoulos: http://delab.csd.auth.gr/~manolopo/ 
22

Identification of Influential Scientists versus Mass Producers by the Perfectionism Index

  • 1.
    Perfectionism Index: Identificationof Influential Scientists vs. Mass Producers 1
  • 2.
    2 What is“Science”? “A branch of study in which facts are observed and classified, and, usually, quantitative laws are formulated and verified: involves the application of mathematical reasoning and data analysis to natural phenomena” Dictionary of Scientific and Technical Terms Science is developed every second, everywhere ! Are all these science products of great importance?
  • 3.
    What if wecould measure “Science” itself Careers in science are not only scientific; they also depend on: ◦luck ◦social connections ◦the ability to impress influential people and referees ◦the foresight to join the right lab at the right time ◦the foresight to associate oneself with prestigious people and prestigious projects Such systems waste scientific talent and produce resentment 3
  • 4.
    What if wecould measure “Science” itself Promotion strictly according to scientific merit would revolutionize scientific career Scientific production: the basis for any measurement of scientific merit ◦Scientific production consists of: published articles (in premium quality venues†) and their impact (article citations) 4 † A Sidiropoulos, Y Manolopoulos. “Generalized comparison of graph-based ranking algorithms for publications and authors”, Journal of Systems and Software 79 (12), 1679-1700, 2006
  • 5.
    5 Measuring “Science”… Can we quantitatively measure the output of science? YES! we can… •Numerical indices (based on citation analysis) for quantification of published research output are being increasingly used by: •employers for hiring personnel •promotion panels: promotions, tenure •funding agencies: “Funding does not regenerate funding. But reputation does.”
  • 6.
    Measuring Science… CitationCount Publication Rank Citation Graph h-index h-core area =h2 (i,j)  the ith ranked pub received j citations For an individual the basic scientometric view is the citation graph J. E. Hirsch. An index to quantify an individual’s scientific research output. Proceedings of the National Academy of Sciences, 102(46):16569–16572, 2005. 6
  • 7.
    Citation Count PublicationRank Citation Graph h-index h-core area =h2 excess area† =e2 tail area 7 † Zhang, C. T. (2009). The e-index, complementing the h- index for excess citations. PLoS One, 4(5), e5429.
  • 8.
    The Basic CitationGraph Areas Overall area: The total number of citations h-index: Denotes the distance of the plot line from the point (0,0). e-index: denotes the “big hits” Tail: denotes the quality of remaining publications 8
  • 9.
    The Tail ofthe Citation Graph Tail: ◦short and wide tail denotes that there are no many publications in the tail These pubs got a relatively significant number of citations ◦long and slim tail means that The researcher is productive The “products” did not have enough acceptance by the research community  massive productivity with not enough acceptance Conclusion: the tail carries important information 9
  • 10.
    Example 0 5 10 15 20 25 30 35 1 3 5 7 9 11 13 15 17 19 21 23 Times Cites Publication rank Author A Author B y=x Author A vs. Author B CA=CB h-indexA=h-indexB e-indexA=e-indexB TailA=TailB Tail-LengthA ≠Tail- LengthB 10
  • 11.
    Example 0 5 10 15 20 25 30 35 1 4 7 10 13 16 19 22 Times Cites Publication rank Author B 0 5 10 15 20 25 30 35 1 4 7 10 13 16 19 22 Times Cites Publication rank Author B Tail Complement 11
  • 12.
    Example Results AuthorA Author B Citations 177 177 h-index 10 10 e-index Tail 12 12 Excess 65 65 Tail Complement 18 128 12
  • 13.
    The Perfectionism Index(PI) PI = κ ∗ h2 + λ ∗ CE − ν ∗ CTC h2 : the h-core area CE : the excess area CTC: the tail complement area κ = λ = ν = 1 (or any number) ◦if κ = ν = 1 and λ=2 we consider that the excess area is more important. ◦κ = λ = ν = 1 give a straightforward geometrical approach. 13
  • 14.
    Example Results (2) Author A Author B Citations 177 177 h-index 10 10 e-index Tail 12 12 Excess 65 65 Tail Complement 18 128 PI (102+65-18) 147 (102+65-128) 37 14
  • 15.
    What is thePerfectionism Index ? Can be used for Classifying scientists: ◦Truly laconic and Influential*: Most of their work has impact ◦Mass producers* : Long List of publications with relatively low impact The value of zero for PI is a key value: ◦PI>0  The scientist is influential ◦PI<0  The scientist is mass producer 15 * The terms where proposed by “Cole, S., & Cole, J. (1967). Scientific Output and Recognition: A study in the Operation of the Reward System in Science. American Sociological Review, 32(3), 377–390.”.
  • 16.
    Experiments Dataset basedon MS Academic Search API 3 datasets: ◦Random: 500 authors from CS with P≥10 and C≥1 ◦Productive: 500 top authors from CS based on number of publications found P≥354 ◦Top h: 500 top author from CS based on h-index found P≥92 16
  • 17.
    Rank by TotalCitations vs. h-index (i,j)  ranked ith position by h-index and jth by C (normalized percent) 17 * Michael Nielsen, Why the h-index is little use, http://michaelnielsen.org/blog/why-the-h-index-is-virtually-no-use/ , 2008
  • 18.
    Rank by PIvs. h-index PI=0 18 Influential Mass Producers
  • 19.
    PI in action:Ranking Scientists Name PI Pos by PI h Pos by h Agrawal Rakesh 14375 1 67 8 Ullman Jeffrey 11267 2 86 2 Motwani Rajeev 9349 3 69 6 Fagin Ronald 4400 4 59 16 Widom Jennifer 4031 5 71 4 Florescu Daniela 3058 6 40 43 Bernstein Philip 2917 7 52 22 Buneman Peter 2001 8 43 39 Hellerstein Joseph 1941 9 51 25 Naughton J. 640 10 48 29 19 Dataset: 50-top scientists in Databases Domain Top 10 Influential scientists.
  • 20.
    Conclusion We introducedPI to provide quantifiable definitions of earlier qualitative classification schemes for the output of scientists PI is uncorrelated with any other known metric. the value of zero for PI is a key value: ◦PI>0  The scientist is influential ◦PI<0  The scientist is mass producer More Results can be found at: ◦http://arxiv.org/abs/1409.6099 20
  • 21.
    Ongoing and Futurework Perfectionism Index and Skyline Ranking for Journals 21 † A. Sidiropoulos, D. Katsaros, and D. Manolopoulos. “Generalized Hirsch h-index for disclosing latent facts in citation networks”. Scientometrics, 72(2):253–280, 2007. Temporal issues: Contemporary† Perfectionism Index The skyline operator for combining multiple rankings
  • 22.
    Thank you foryour attention Questions ? Contact & Info: ◦Antonis Sidiropoulos: https://sites.google.com/site/asidirop/ ◦Dimitris Katsaros: http://inf-server.inf.uth.gr/~dkatsar/ ◦Yannis Manolopoulos: http://delab.csd.auth.gr/~manolopo/ 22