1. Chapter 3 - Project Planning, Scheduling and Controlling
1
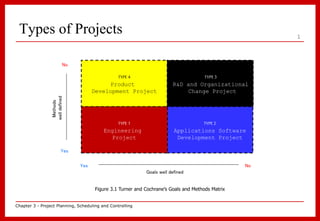
Types of Projects
Figure 3.1 Turner and Cochrane’s Goals and Methods Matrix
TYPE1
Engineering
Project
TYPE3
R&D and Organizational
Change Project
TYPE2
Applications Software
Development Project
TYPE4
Product
Development Project
No
Yes
No
Yes
Goals well defined
Methods
well
defined
2. Chapter 3 - Project Planning, Scheduling and Controlling
2
Project Planning and Controlling
Objectives
- To arrange the activities appropriately
- To make a realistic time scheduling
- To make a resources estimation and planning
- To implement time and cost controlling
- To ease the contract administration
3. Chapter 3 - Project Planning, Scheduling and Controlling
3
Scheduling Techniques
Figure 3.2 Techniques of Project Planning, Scheduling and Controlling
Planning, Scheduling
And controlling Techniques
Bar
Charts
Matrix
Schedules
Linear Balance
Method
Critical Path
Method (CPM)
Progress Curve
or S-Curves
4. Chapter 3 - Project Planning, Scheduling and Controlling
4
Bar Charts
Figure 3.3 Techniques of Project Planning, Scheduling and Controlling
- Simple graphical
- Easy for general comprehension
- Wide spread used in industry
- Mostly used in small project
- Fairly broad planning and
scheduling tools, so they
require less revision and
updating than more
sophisticated systems
- Very cumbersome as the number
of line activities, or bars
increases
- Logical interconnections and
constraints of the various
activities is not expressed
- Difficult to use it for
forecasting the effects that
changes in a particular
activity will have on the
overall schedule
Advantages Disadvantages
5. Chapter 3 - Project Planning, Scheduling and Controlling
5
Bar Charts
Table 3.1 Bar Chart for Concrete Gravity-Arch Dam
No. Description Month
1 2 3 4 5 6 7 8 9 10
1 Mobilization
2 Foundation Excavation
3 Diversion Stage
4 Foundation Grouting
5 Dam Concrete
6 Install Outlet Gates
7 Install Trash Racks
8 Prestress
9 Radial Gates
10 Spillway Bridge
11 Curtain Grout
12 Dismantle Plant, Clean Up
Original Schedule
Actual progress
6. Chapter 3 - Project Planning, Scheduling and Controlling
6
Bar Charts
Example 3.1
A project consist of six activities that should be done in a
period of time. Try to create a bar chart to ease the project
planning and scheduling.
Activity A : 1 week, starting from 1 Oct 2014
Activity B : 2 week, starting from 5 Oct 2014
Activity C : 3 week, starting from 15 Oct 2014
Activity D : 2 week, starting from 25 Oct 2014
Activity E : 2 week, starting from 29 Oct 2014
Activity F : 1 week, starting from 5 Nov 2014
7. Chapter 3 - Project Planning, Scheduling and Controlling
7
Bar Charts
Table 3.2 Bar Chart for Example 4.1
1/10 8/10 15/10 22/10 29/10 5/11
No Activity Duration Week
1 2 3 4 5 6
1 A 1
2 B 2
3 C 3
4 D 2
5 E 2
6 F 1
1/10 8/10 15/10 22/10 29/10 5/11 12/11
`
8. Chapter 3 - Project Planning, Scheduling and Controlling
8
Modified Bar Charts
Example 3.2
Data of a project consist of four activities with their
duration and also amount of amount needed for this project.
Create a modified bar chart according to the data above.
No Activity Duration Starting Human Resources Successor
(week) Date (people)
1 G 1 01 October 2014 5 H, I
2 H 2 08 October 2014 8 J
3 I 3 10 October 2014 15 K
4 J 2 22 October 2014 4 K
5 K 2 05 November 2014 3 -
9. Chapter 3 - Project Planning, Scheduling and Controlling
9
Modified Bar Charts
Table 3.3 Modified Bar Chart for Example 4.2
No Activity Duration Human Resources Week
(week) (people) 1 2 3 4 5 6
1 G 1 5
2 H 2 8
3 I 3 15
4 J 2 4
5 K 1 3
Duration (week)
0
Resources
(People)
5
10
1/10 8/10 15/10 22/10 29/10 5/11 12/11
4
5
4
5 5
2 2
1
3
4
10. Chapter 3 - Project Planning, Scheduling and Controlling
10
Progress Curves
Table 3.4 Combination between S-Curves and Bar Charts
No. Description Month
1 2 3 4 5 6 7 8 9 10
1 Mobilization
2 Foundation Excavation
3 Diversion Stage
4 Foundation Grouting
5 Dam Concrete
6 Install Outlet Gates
7 Install Trash Racks
8 Prestress
9 Radial Gates
10 Spillway Bridge
11 Curtain Grout
12 Dismantle Plant, Clean Up
Original Schedule
Actual progress
Cumulative
progress
(%)
100
0
11. Chapter 3 - Project Planning, Scheduling and Controlling
11
Progress Curves
Figure 3.4 Step by Step to Make Progress or S-Curve
- Calculate cost for each activity
- Calculate total cost for all activity
- Calculate the progress ratio between cost for each
activity and total cost
- Divide those progress ratio equally for each activity
according to its duration
- Add the progress ratio which already divided for each
unit of time
- Calculate the cumulative progress ratio
- Draw S-Curve as a relationship between cumulative
progress ratio and duration of a project
Step by step to make s-curve
12. Chapter 3 - Project Planning, Scheduling and Controlling
12
Progress Curves
Example 3.3
As a bar chart is created in Example 3.1, try to draw a
progress or S-Curve of the project with additional data as
follow :
No Activity Duration Cost
(week) ($ )
1 A 1 1600
2 B 2 2000
3 C 3 6000
4 D 2 4900
5 E 2 3600
6 F 1 2000
Total 20000
13. Chapter 3 - Project Planning, Scheduling and Controlling
13
Progress Curves
Table 3.5 Progress or S-Curve for Example 4.3
No Activity Duration Progress week
Ratio 1 2 3 4 5 6
(week) (%)
1 A 1 8
2 B 2 10
3 C 3 30
4 D 2 24
5 E 2 18
6 F 1 10
Work progress ratio (%) 10.1 5 12.9 16.9 31 24.1
Cumulative wok progress ratio (%) 10.1 15.1 28 44.9 75.9 100
8
1/10 8/10 15/10 22/10 29/10 5/11
2.1
10 10 10
12
5
9
10
9
2.9
6.9
8
5.1
100
50
0
Cumulative
progress
(%)
14. Chapter 3 - Project Planning, Scheduling and Controlling
14
Linear Balance Method
Figure 3.5 Linear Balance Method for Pipeline
- Also called as Vertical Production Method (VPM)
- Apply best to linear and repetitive operations, such as
tunnels, pipelines, highways etc.
Cumulative
progress
(%)
100
0
Time
testing
Facts about linear balance method
15. Chapter 3 - Project Planning, Scheduling and Controlling
15
Matrix Schedules
Figure 3.6 Facts about Matrix Schedules
- Fairly common used on high-rise buildings with successive
floors repeating essentially the same plan.
- The vertical correlation of floors to rows is immediately
obvious to anyone and requires no explanation (see Table
2.6)
- The chronological, left-to-right flow of each floor’s
operations is east to see (see Table 2.6)
- The logical interrelationships among operations are also
more obvious than in a bar chart
- With some forethought, the vertical columns can be made
to correspond to the specialty subcontractors
Facts about matrix schedules
16. Chapter 3 - Project Planning, Scheduling and Controlling
16
Matrix Schedules
Figure 3.7 Matrix Schedule for High-Rise Building
Sequence of operations on each floor
B1
B2
30
Intermediate Operations
Erect
frame
Place
floor
decking
Install
suspended
ceiling
Paint
and
carpet
Building
floor
numbers
Typical Element
Actual start
Actual finish
Actual duration
scheduled start
scheduled finish
scheduled duration
1
2
29
17. Chapter 3 - Project Planning, Scheduling and Controlling
17
Critical Path Method
Figure 3.8 Advantages and Disadvantages of Critical Path Method
- Networks can much more
concisely represent large
numbers of activities
- The logical interrelationships
and dependencies among
activities is really shown
- Much more useful for
forecasting and control
- It identify the most critical
elements in the project
schedule
- Easy to adjust if any delay is
happen in the project
- A little bit difficult to
understand the network system
Advantages Disadvantages
- Arrow Diagram Method (ADM)
- Precedence Diagram Method
(PDM)
Types of CPM
18. Chapter 3 - Project Planning, Scheduling and Controlling
18
ADM vs. PDM
Table 3.6 Differences between ADM and PDM Method
Item ADM PDM
Activity
ES: Early Start LS: Late Start
EF: Early Finish LF: Late Finish
D : Duration TF: Total Float
Event
A
ES EF
LS LF
A
D
TF
ES EF
LS LF
A
D
TF
ES EF
LS LF
B
D
TF
1
ES
EF
1
LS
LF
2
A
19. Chapter 3 - Project Planning, Scheduling and Controlling
19
ADM vs. PDM
Table 3.6 Differences between ADM and PDM Method (cont.)
Item ADM PDM
Dummy
Activity
or
Definition
Activity which has not
duration. It is only
used to show any
relationship between
activities.
Function
• If there is a situation
where one event is used
to show relationship
more than one activity.
• To show a complicated
relationship clearly
Dummy activity is not used
in Precedence Diagram
Method (PDM)
D
20. Chapter 3 - Project Planning, Scheduling and Controlling
20
ADM vs. PDM
Table 3.6 Differences between ADM and PDM Method (cont.)
Item ADM
Dummy
Activity
or
False True
D
A
B
A
B
C
D
A
B
A
B
C
D
21. Chapter 3 - Project Planning, Scheduling and Controlling
21
ADM vs. PDM
Table 3.6 Differences between ADM and PDM Method (cont.)
Item ADM
Dummy
Activity
or
False True
D
1. D is preceded by A only
2. E is preceded by A and B
3. F is preceded by B and C
A
B
C
D
F
E
A
B
C
D
F
E
22. Chapter 3 - Project Planning, Scheduling and Controlling
22
ADM vs. PDM
Table 3.6 Differences between ADM and PDM Method (cont.)
Item ADM PDM
Relationship
F - S F – S
F – F
S – S
S - F
Critical path
- Critical Path
: A path consist of few activities which will
determine the overall project duration.
- Possible to have more than one critical path
- Activities which lay on critical path cannot suffer
any delay
1. Es = Ef, or
2. Ls = Lf, or
3. Total Float (TF) = 0
23. Chapter 3 - Project Planning, Scheduling and Controlling
23
ADM vs. PDM
Table 3.6 Differences between ADM and PDM Method (cont.)
Item ADM PDM
Total float
- Total float
: The maximum amount of time that the activity can be
delayed without extending the completion time of the
overall project.
Estimating duration
- FORWARD PASS
: To establish the earliest expected start and
finish times for each activity in the network.
- BACKWARD PASS
: To establish the latest allowable start and
finish times for each activity in the network.
1. TFx = LSx – ESx, or
2. TFx = LFx – EFx
24. Chapter 3 - Project Planning, Scheduling and Controlling
24
Arrow Diagram Method
Figure 3.9 Estimating Project Duration using Arrow Diagram Method (ADM)
A
1
a
b 2
c
d
X
B
2
e
f
Y
Forward pass
Backward pass
Note
a : Early Start (ES)A
b : Late Start (LS)A
c : Early Finish (EF)A = (ES)B
d : Late Finish (LF)A = (EF)B
e : Early Finish (EF)B
d : Late Finish (LF)B
X : Duration of activity A
Y : Duration of activity B
Forward pass Backward pass
a = 0 f = e
c = a + X d = f – Y
e = c + Y b = d - X
25. Chapter 3 - Project Planning, Scheduling and Controlling
25
Example 3.4
Arrow Diagram Method
Estimate the total project duration.
Calculate the total float for each activity in the project
Draw the bar chart according to your calculation
Activity Successor Duration
(week)
A B, C 2
B D 3
C E 2
D F 4
E G 5
F H 2
G H 3
H - 1
26. Chapter 3 - Project Planning, Scheduling and Controlling
26
Solution 3.4
Total Project Duration = 12 weeks
Arrow Diagram Method
A
1
0
0
2
2
2
2
2
5
5
2
4
5
2
9
9
2
7
8
2
11
11
2 12
12
B
C
D
E
F
G
H
3
2
4
3
2
3
1
27. Chapter 3 - Project Planning, Scheduling and Controlling
27
Solution 3.4 (cont.)
Critical Path : A – B – D – F – H
Arrow Diagram Method
Event Activity Duration ES LS EF LF Total Float
(1) (2) (3) (4) (5) (6) (7) (8) = 7-3-4
1 - 2 A 2 0 0 2 2 0 *
2 - 3 B 3 2 2 5 5 0 *
2 - 4 C 2 2 2 4 5 1
3 - 5 D 4 5 5 9 9 0 *
4 - 6 E 3 4 5 7 8 1
5 - 7 F 2 9 9 11 11 0 *
6 - 7 G 3 7 8 11 11 1
7 - 8 H 1 11 11 12 12 0 *
28. Chapter 3 - Project Planning, Scheduling and Controlling
28
Solution 3.4 (cont.)
Arrow Diagram Method
No Activity
Week
1 2 3 4 5 6 7 8 9 10 11 12
1 A
2 B
3 C
4 D
5 E
6 F
7 G
8 H
29. Chapter 3 - Project Planning, Scheduling and Controlling
29
Arrow Diagram Method
Example 3.5
Activity Predecessor Duration
(week)
A - 2
B - 1
C - 3
D A 1
E B 3
F C 2
G D 4
H D, E 1
I D, E, F 2
J G 1
K H 2
L I 3
• Estimate the total
project duration.
• Calculate the total
float for each activity
in the project
• Draw the bar chart
according to your
calculation
30. Chapter 3 - Project Planning, Scheduling and Controlling
30
Solution 3.5 (cont.)
Total Project Duration = 10 weeks
Arrow Diagram Method
A
B
C
D
E
F
G
L
K
3
2
2
3
4
1
2
0
0
2
4
1
2
3
3
3
5
7
9
5
8
5
5
10
10
3
1
4
5
7
7
I
2
H
1
3
3
J
0
0
31. Chapter 3 - Project Planning, Scheduling and Controlling
31
Solution 3.5 (cont.)
Total Project Duration = 12weeks
Arrow Diagram Method
No Activity Total Float Week
1 2 3 4 5 6 7 8 9 10
1 A 2
2 B 1
3 C 0
4 D 2
5 E 1
6 F 0
7 G 2
8 H 3
9 I 0
10 J 2
11 K 3
12 L 0
32. Chapter 3 - Project Planning, Scheduling and Controlling
32
Time calculation for f-s and s-s relationship
Precedence Diagram Method
Figure 4.10 Time Calculation for F-S and S-S Relationship
item A-B (F-S) A-C (S-S)
Forward Pass (choose the largest number, if >1)
ESA a 0
EFA c = a + X
ESB e = c + LA-B
EFB g = e + Y
ESC i = a + LA-C
EFC k = i + Z
Backward Pass (choose the lower number, if >1)
LFB h = g
LSB f = h - Y
LFA d = f - LA-B
LSA b = d - X = j - LA-C
LFC l = k
LSC j = l - Z
Table 3.7 Formula for Calculating Time F-S and S-S
C
i
j
k
l
Z
LA-B
S - S
F - S
B
e
f
g
h
Y
LA-C
A
b
c
d
X
a
33. Chapter 3 - Project Planning, Scheduling and Controlling
33
Time calculation for S-F and F-F relationship
Precedence Diagram Method
Figure 4.11 Time Calculation for S-F and F-F Relationship
LA-B
S- F
F - F
B
e
f
g
h
Y
LA-C
C
i
j
k
l
Z
A
b
c
d
X
a
item A-C (S-F) A-B (F-F)
Forward Pass (choose the largest number, if >1)
ESA a 0
EFA c = a + X
ESB e 0
EFB g = e + Y
EFC k = a + LA-C
= g + LA-B
ESC I = k – Z = k – Z
Backward Pass (choose the lower number, if >1)
LFC l = k
LSC j = l - Z
LSA b = l - LA-C
LFA d = b + d
LFB h = l - LA-B
LSB f = h - Y
Table 3.8 Formula for Calculating Time S-F and F-F
34. Chapter 3 - Project Planning, Scheduling and Controlling
34
Precedence Diagram Method
Example 3.6
No Activity Duration Successor Relationship Lag (L)
(week) (week)
1 A 2 B,D A-B (F-S) 0
A-D (S-S) 1
2 B 2 C B-C (F-S) 1
3 C 1 - - -
4 D 1 E D-E (F-S) 0
5 E 1 C E-C (F-S) 2
1. Estimate the total project duration.
2. Calculate the total float for each activity in the project
3. Draw the bar chart according to your calculation
35. Chapter 3 - Project Planning, Scheduling and Controlling
35
Precedence Diagram Method
Solution 3.6
Total Project Duration = 6 weeks
A
0
0
2
2
2
B
2
2
4
4
2
D
1
3
2
4
1
L = 0
L = 1
E
2
4
3
5
1
C
5
5
6
6
1
L = 1
L = 0
L = 0
0 0 0
2 2
Note
Total Float (TF):
Critical Path :
Tf
36. Chapter 3 - Project Planning, Scheduling and Controlling
36
Precedence Diagram Method
Solution 3.6 (Cont.)
No Activity Week
1 2 3 4 5 6
1 A
2 B
3 C
4 D
5 E
L=1
L=1
37. Chapter 3 - Project Planning, Scheduling and Controlling
37
Project Controlling Procedure
- What performance measures should be
selected?
- What data should be used to estimate
the current value of each performance
measure?
- How should raw data be collected, from
which sources, and in what frequency?
- How should the data be analyzed to
detect current and future deviations?
- How should the results of the analysis
be reported, in what format, to whom,
and how often?
Project
plan
Project
implementation
Project
control
Project
updating
Measurement
Of work performance
Figure 3.12 Project Controlling Procedure
38. Chapter 3 - Project Planning, Scheduling and Controlling
38
Project Controlling
Figure 3.13 Implementation of Project Controlling in Construction Project
Implementation of
Project Controlling
Project Site
Main office
Construction
Design
Subcontract
Procurement
39. Chapter 3 - Project Planning, Scheduling and Controlling
39
Elements of Project Controlling
Figure 3.14 Elements of Project Controlling
Action Plan
Budget
Elements of
Project Controlling
Tools
Milestone
Forecasting
40. Chapter 3 - Project Planning, Scheduling and Controlling
40
Controlling vs. Project Phases
Figure 3.15 Relationship between Result of Controlling and Project Phases
1 2 3
Result of
Controlling
Cost of Controlling
Project phases
41. Chapter 3 - Project Planning, Scheduling and Controlling
41
Project Controlling Approach
Figure 3.16 Relationship between Result of Controlling and Project Phases
Project controlling
approach
C/S-CSC
Variants
Analysis
Earned
Value
Value
Engineering
42. Chapter 3 - Project Planning, Scheduling and Controlling
42
Variants Analysis
Figure 3.17 Example of Cost Variants Analysis
Month
Cumulative
progress
(Rp)
0
200
400
600
800
1000
Jan Feb Mar Apr Jun Jul Aug Sep Oct
May
Cost Budget
Date of Reporting
850
Cost Variant
= 850-600 = 250
Disadvantages
It cannot describe
both cost and
schedule variants at
the same time
43. Chapter 3 - Project Planning, Scheduling and Controlling
43
Earned Value Approach
Figure 3.18 Terms used in Earned Value Approach
- BCWS (BUDGETED COST OF WORK SCHEDULED)
The value (in monetary units) of the work scheduled to
be accomplished in a given period of time.
- BCWP (BUDGETED COST OF WORK PERFORMED)
The monetary value of the work actually accomplished
within the control period.
- ACWP (ACTUAL COST OF WORK PERFORMED)
The cost actually incurred and recorded in accomplishing
the work performed within the control period.
Terms used in Earned value approach
44. Chapter 3 - Project Planning, Scheduling and Controlling
44
Earned Value Approach
Figure 3.19 Parameter to Measure Project Progress and Performance using Earned Value Approach
PROGRESS and PERFORMANCE’S PARAMETERS
SCHEDULED DEVIATIONS (SV)
= BCWP – BCWS
COST DEVIATIONS
(CV)
= BCWP – ACWP
SCHEDULED PERFORMANCE INDEX (SPI)
= BCWP
BCWS
COST PERFORMANCE INDEX
(CPI)
= BCWP
ACWP
45. Chapter 3 - Project Planning, Scheduling and Controlling
45
Earned Value Approach
SV CV SPI CPI Description
+ + >1 >1 The project is ahead of schedule
A lower actual cost than budget
0 + 0 >1 The project is on time
A lower actual cost than budget
+ 0 >1 0 The project is ahead of schedule
The project is on budget
0 0 0 0 The project is on time
The project is on budget
- - <1 <1
The project is late
Cost overrun than budget
0 - 0 <1 The project is on time
Cost overrun than budget
- 0 <1 0 The project is late
The project is on budget
+ - >1 <1 The project is ahead of schedule
Cost overrun than budget
Table 3.9 Parameter to Measure Project Progress and Performance using Earned Value Approach
46. Chapter 3 - Project Planning, Scheduling and Controlling
46
Earned Value Approach
Example 3.7
Estimation has been made for concreting work as one of
activity that should be done in a project. The amount of
overall concreting work in the project is about 10.8 m3 (40
columns @ 0.3m x0.3m x3m) with total budget of $1,620. For
the first stage of this work, it is hoped that 20 columns
will be constructed. Determine the three variables BCWS,
BCWP, and ACWP if we use Earned Value Approach to analyze the
project controlling
47. Chapter 3 - Project Planning, Scheduling and Controlling
47
Earned Value Approach
SOLUTION 3.7
BCWS = $ 1,620 ($ 40.5 for each column)
BCWP = 20 columns is planned to be constructed
= 20 columns x $ 40.5
= $ 810, or
= (0.3 x 0.3 x 3) x 20
x $ 1,620
(0.3 x 0.3 x 3) x 40
= $ 810
ACWP = It is not specified in this example.
It mean that actual cost (ACWP) can be less
or more than budget (BCWP)
48. Chapter 3 - Project Planning, Scheduling and Controlling
48
Earned Value Approach
Example 3.8
Determine the three variables BCWS, BCWP, and ACWP from a
project report as stated below:
No Activity Budget Scheduled progress (%)
($) per activity
1 Preliminary Work 4,000 100
2 Civil Works & Building 3,000 100
3 Equipment Installation 4,000 40
4 Piping Work 6,000 10
5 Electric 2,000 -
6 Finishing Work 1,000 -
Total 20,000
49. Chapter 3 - Project Planning, Scheduling and Controlling
49
Earned Value Approach
Solution 3.8
BCWS = $ 20,000
BCWP = $ 20,000 x 46% = $ 9,200
No Activity Budget Ratio Scheduled progress (%)
($) (%) per activity
per
project
1 Preliminary Work 4,000 494 100 20
2 Civil Works & Building 3,000 370 100 15
3 Equipment Installation 4,000 494 40 8
4 Piping Work 6,000 741 10 3
5 Electric 2,000 247 - -
6 Finishing Work 1,000 123 - -
Total 20,000 100 46
50. Chapter 3 - Project Planning, Scheduling and Controlling
50
Earned Value Approach
No Activity Budgeted Week
Ratio (%) 1 2 3 4 5 6
1 A 8
2 B 10
3 C 30
4 D 24
5 E 18
6 F 10
Scheduled Progress (%) 10.5 10 12.5 26.5 26 14.5
Cumulative Scheduled Progress (%) 10.5 20.5 33 59.5 85.5 100
Actual progress (%) 5 9 14 19 30 23
Cumulative Actual Progress (%) 5 14 28 47 77 100
Schedule Variants -5.5 -6.5 -5 -12.5 -8.5 0
Figure 3.20 Project is Behind Schedule
Original Schedule
Actual progress
Cumulative
progress
(%)
100
0
51. Chapter 3 - Project Planning, Scheduling and Controlling
51
Earned Value Approach
Figure 3.21 Project is Ahead of Schedule
No Activity Budgeted Week
Ratio (%) 1 2 3 4 5 6
1 A 8
2 B 10
3 C 30
4 D 24
5 E 18
6 F 10
Scheduled Progress (%) 5 9 14 19 30 23
Cumulative Scheduled Progress (%) 5 14 28 47 77 100
Actual progress (%) 10.5 10 12.5 26.5 26 14.5
Cumulative Actual Progress (%) 10.5 20.5 33 59.5 85.5 100
Schedule Variants 5.5 6.5 5 12.5 8.5 0
Original Schedule
Actual progress
Cumulative
progress
(%)
100
0
52. Chapter 3 - Project Planning, Scheduling and Controlling
52
Factors causing delay in construction project
Procurement of resources which is not on schedule
Inappropriate work capacity
Low productivity
Ineffective project management
There are some redesign and extra work to the project
Bad communication among parties involved in project
Inefficient decision making
Force majeure, etc.
Time Controlling
Need an effective supervision
53. Chapter 3 - Project Planning, Scheduling and Controlling
53
Cost Controlling
Example 3.9
Contractor makes a progress report to claim their payment to
owner based on actual progress they made. As stated in the
contract, the agreement is as follow:
Down payment = 15 %
First claim - 25 % actual progress = 20 %
Second claim - 50 % actual progress = 20 %
Third claim - 75 % actual progress = 20 %
Fourth claim - 100 % actual progress = 20 %
Fifth claim, after maintenance period end = 5 %
54. Chapter 3 - Project Planning, Scheduling and Controlling
54
Cost Controlling
Example 3.9 (cont.)
The progress is reporting every month in table below. The
payment will only be paid to the contractor in the first of a
new month after the claim made. Determine the contractor’s
cash flow based on all data given.
Item Month
1 2 3 4 5 6 7 8
Scheduled Progress (%) 5.5 10.5 11 24 18 12 10 9
Cumulative Scheduled
Progress (%) 5.5 16 27 51 69 81 91 100
56. Chapter 3 - Project Planning, Scheduling and Controlling
56
Quality Management
Definition
All activities of the overall management function that
determine the quality policy, objectives and
responsibilities, and implement them by means such as quality
planning, quality control, quality assurance and quality
improvement.
BS EN ISO 8402
Four stages of quality management (BS EN ISO 8402)
Inspection
Activity such as measuring, examining, testing or gauging
one or more characteristic of an entity and comparing
these results with specified requirements in order to
establish whether conformity is achieved for each
characteristic
57. Chapter 3 - Project Planning, Scheduling and Controlling
57
Quality Management
Quality Control (QC)
Operational techniques and activities that are used to
fulfill requirements for quality
Statistical techniques is used to show the trends where
certain problems are occurring, based on data
collection
Quality Assurance (QA)
All the planned activities implemented within the
quality system, and demonstrated as needed, to provide
adequate confidence that an entity will fulfill
requirements for quality
58. Chapter 3 - Project Planning, Scheduling and Controlling
58
Quality Management
Total Quality Management (TQM)
Management approach of an organization, centered on
quality, based on the participation of all members and
aiming at long-term success through customer
satisfaction, and benefits to all members of the
organization and to society
According to Stephen Robbins, five essentials for TQM :
Intense focus on the customer
Concern for continual improvement
Improvement in the quality of everything
Accurate measurement
Empowerment of employees
59. Chapter 3 - Project Planning, Scheduling and Controlling
59
Quality Management
Figure 3.22 Advantages and Disadvantages of Using Quality Assurance (QA)
Using
Quality Assurance (QA)
Advantages
Disadvantages
- Meeting customer requirements
- Communicating customer requirements
- Staying on tender lists and getting new business
- Doing it right first time
- Bureaucracy
- Cost
60. Chapter 3 - Project Planning, Scheduling and Controlling
60
Quality Management
Figure 3.23 Essential of Total Quality Management (Dale, Boaden and Lascelles)
TQM
QA
QC
Inspection
Continuous improvement
Empowering people
Caring for people
Involvement (teams)
Compliance to specification
Allocating blame
61. Chapter 3 - Project Planning, Scheduling and Controlling
61
Quality Management
Figure3.24 The Four Stages of Quality Management (cont.)
Inspection
- Salvage
- Sorting, grading, reblending
- Corrective actions
- Identify sources of non-conformance
Quality Control
- Develop quality manual
- Process performance data
- Self-inspection
- Product testing
- Basic quality planning
- Use of basic statistic
- Paperwork controls
Quality Assurance
- Quality system development
- Advanced quality planning
- Comprehensive quality manuals
- Use of quality costs
- Involvement of non-production operations
- Failure mode and effects analysis
- Statistical process control
Total Quality Management
- Policy deployment
- Involve suppliers and customers
- Involve all operations
- Process management
- Performance measurement
- Teamwork
- Employee involvement
1 2
3
4
62. Chapter 3 - Project Planning, Scheduling and Controlling
62
Quality Management
Figure 3.25 The Deming Chain Reaction
Improve
quality
Cost decreases because of:
- Less rework
- Fewer mistakes
- Fewer delays
- Snags
- Better use of machine time & materials
Capture the market with better quality and lower
price
Provide jobs and more
jobs
Productivity
improves
Stay in
business
63. Chapter 3 - Project Planning, Scheduling and Controlling
63
Quality Management
Figure 3.26 The Deming Flow Diagram
Suppliers and
Subcontractors
Production
Receipt and test of materials
Consumers
Tests of processes machines, methods, costs
Assembly
Inspection
Customer
Research
Design and
Redesign
64. Chapter 3 - Project Planning, Scheduling and Controlling
64
Quality Management
Figure 3.27 The Deming Plan, Do, Check, Action (PDCA) Cycle
Do
Policy
Development
Check
- Auditing
- Diagnosing
- Reporting
Action
Possible
change of plan
based on the
diagnosis
Plan
Policy
Development
65. Chapter 3 - Project Planning, Scheduling and Controlling
65
Quality Management
Figure 3.28 The PDCA Cycle and A System for Ensuring Customer Satisfaction
Input
Consumers
Voice of
customer
Output
- Equipment
- People
- Materials
- Methods
- Environment
- Products
- Services
Voice of
producer
Check Do
Action Plan
Process or
system
Suppliers and
Subcontractors
66. Chapter 3 - Project Planning, Scheduling and Controlling
66
Standards of Excellence
Figure 3.29 Standards of Excellence
State
awards
President’s award Baldrige award
Deming prize
(Japan)
ISO
9000
Standards of Excellence
67. Chapter 3 - Project Planning, Scheduling and Controlling
67
ISO 9000
Table 3.10 The ISO 9000 Series of Standards for Quality Management
ISO Reference Subject
9000-1 Guidelines for selection and use of ISO 9000
9000-2 Guidelines for application of ISO 9000
9000-3 Guidelines for application of ISO 9001 to the development, supply &
maintenance of software
9000-4 Dependability management
9001 Model for quality assurance in design, development, production,
installation and servicing
9002 Model for quality assurance in production, installation and servicing
9003 Model for quality assurance in final inspection and testing
9004-1 Guidelines for quality system elements
9004 GUIDELINES
9004-2 Services
9004-3 Processed materials
9004-4 Quality improvements
9004-5 Quality plans
9004-6 Project management
9004-7 Configuration management
68. Chapter 3 - Project Planning, Scheduling and Controlling
68
ISO 9000
The clauses of ISO 9000
The construction industry normally follows ISO 9001 and
ISO 9002
ISO 9001
For organization carries out design work
For example : architectural practices, design and build
contractors or subcontractors
Has 20 parts (clauses)
ISO 9002
For organization do not carries out design work
Has 19 parts (clauses)
69. Chapter 3 - Project Planning, Scheduling and Controlling
69
ISO 9000
Table 3.11 ISO 9000 Documents and Their Clauses
Clause Requirement 9001 9002 9003
4.1 Management Responsibility * * *
4.2 Quality system * * *
4.3 Contract review * *
4.4 Design control * *
4.5 Document and data control * * *
4.6 Purchasing * *
4.7 Control of customer-supplied product * *
4.8 Product identification and traceability * * *
4.9 Process control * *
4.10 Inspection and testing * * *
4.11 Control of inspection, measuring and test equipment * * *
70. Chapter 3 - Project Planning, Scheduling and Controlling
70
ISO 9000
Table 3.11 ISO 9000 Documents and Their Clauses
Clause Requirement 9001 9002 9003
4.12 Inspection and test status * * *
4.13 Control of non-conforming product * * *
4.14 Corrective and preventive action * *
4.15 Handling, storage, packaging, preservation and delivery * * *
4.16 Control of quality records * * *
4.17 Internal quality audits * *
4.18 Training * * *
4.19 Servicing * *
4.20 Statistical techniques * * *
71. Chapter 3 - Project Planning, Scheduling and Controlling
71
ISO 9000
Figure3.30 Minimal Cost of Quality Curve
100% defective 100% good
Defect rate
Optimal
Conformance
level
Costs
per
Good
Unit
of
Product
Minimal cost of quality
Internal + External
Failure Costs
Total quality costs
Costs of Appraisal +
Prevention
73. Chapter 3 - Project Planning, Scheduling and Controlling
73
Primavera Project Planner 3.1
Figure 3.33 Screen Layout of Project SNP1 in Primavera Project Planner 3.1
Activity Bar
Activity ID
Activity Description
Activity codes
74. Chapter 3 - Project Planning, Scheduling and Controlling
74
Primavera Project Planner 3.1
Figure 3.34 Relationship between Activities
75. Chapter 3 - Project Planning, Scheduling and Controlling
75
Primavera Project Planner 3.1
Figure 3.35 Bar Chart
76. Chapter 3 - Project Planning, Scheduling and Controlling
76
Primavera Project Planner 3.1
Figure 3.36 Data for Each Activity in The Project
77. Chapter 3 - Project Planning, Scheduling and Controlling
77
Primavera Project Planner 3.1
Figure 3.37 Table of Resources Needed in The Project
78. Chapter 3 - Project Planning, Scheduling and Controlling
78
Primavera Project Planner 3.1
Figure 3.38 Layout for Project Reporting
79. Chapter 3 - Project Planning, Scheduling and Controlling
79
Primavera Project Planner 3.1
Figure 3.39 PERT or PDM View
80. Chapter 3 - Project Planning, Scheduling and Controlling
80
Primavera Project Planner 3.1
Figure 3.40 Graph of Resources which Needed in This Project