Poster presentation I gave with one other student at the 2016 UO Undergraduate Research Symposium in collaboration with the Material Science Institute.
Use of mutants in understanding seedling development.pptx
Electron interferometry
1. Electron Interferometry
Gino Carrillo, Joey Carlson, Fehmi Yasin, Benjamin J. McMorran
Department of Physics, Material Science Institute, University of Oregon, Eugene OR
Background
Method
Interferometry is the superimposing of waves to create an interference pattern
from which information can be extracted. Since it’s first purpose, to detect a
supposed aether which physicists thought to be the medium through which light
travels, it has evolved to a tool with a multitude of applications such as the recent
detection of gravity waves. Interferometers traditionally use light waves, but in
theory can use any wave-like phenomena including the particle-wave duality
aspect of particles like electrons. Here we attempt to incorporate a variation of the
Mach-Zehnder Interferometer (see figure 1) into the TEM to allow for better
characterization of thin materials.
Theory
Data
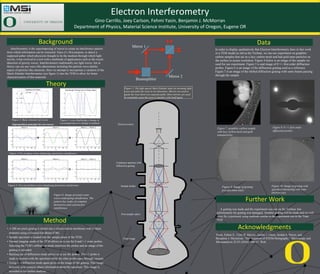
In order to display qualitatively that Electron Interferometry does in fact work
in a TEM model as old as the Technai, we ran our experiment on graphitic
carbon samples that sat on a lacy carbon mesh and had gold nano particles on
the surface to assure resolution. Figure 4 below is an image of the sample we
used for our experiment. Figure 5 is and image of 0 +/- first order diffraction
probes. Figure 6 is an image of the diffraction grating used as a reference.
Figure 7 is an image of the shifted diffraction grating with some beams passing
through the sample.
Further Work
Figure 4:Two in phase waves displaying constructive interference
Figure 5: Two out of phase waves displaying destructive interference
A grating was made and the experiment was run on the Technai, but
unfortunately the grating was damaged. Another grating will be made and we will
rerun the experiment using methods similar to the experiment run in the Titan
TEM.
Acknowledgments• A 200 nm pitch grating is milled into a silicon nitride membrane with a 50μm
diameter using a Focused Ion-Beam (FIB).
• Sample specimen is loaded into the sample plane of the TEM.
• Normal imaging mode of the TEM allows us to see the 0 and+/-1 order probes.
Selecting the TEM’s diffraction mode interferes the probes and an image of the
grating is recorded.
• Backing out of diffraction mode allows us to see the probes. The +1 probe is
made to interact with the specimen while the other probes pass through vacuum.
• Going into diffraction mode again gives us the image of the grating. This image
however, now contains phase information about the specimen. This image is
recorded to for further analysis.
Figure 8: 0 +/- first order
diffraction probes
Figure 10: Image of grating with
specimen interacting with some
electron rays
Figure 9: Image of grating
pre-specimen entry
Yasin, Fehmi S., Tyler R. Harvey, Jordan J. Chess, Jordan S. Pierce, and
Benjamin J. Mcmorran. "Development of STEM-Holography." Microscopy and
Microanalysis 22.S3 (2016): 506-07. Web.
Figure 1: The light optical Mach Zehnder takes an incoming light
wave and splits the wave in two directions. Mirrors are used to
guide the wave down two separate paths. More mirrors are used
to eventually cause the wave to interfere with itself again.
Condenser aperture with
diffraction grating
Sample holder
Final image
Post-sample optics
Figure 7: graphitic carbon sample
with lacy carbon mesh and gold
nanoparticles
Electron sourceSuperposition principle for two waves:
Figure 2: Basic structure of a wave Figure 3: wave displaying a change in
wavelength due to a change in medium
Figure 6: Image of actual water
waves undergoing interference. The
pattern has nodes of complete
destructive and constructive
interference.
Anatomy of a Wave Wavelength Change Due to Phase Object