
Recommended
Recommended
More Related Content
More from John Newquist
More from John Newquist (20)
Recently uploaded
Recently uploaded (20)
Occupational Fatalities in 2017 BLS
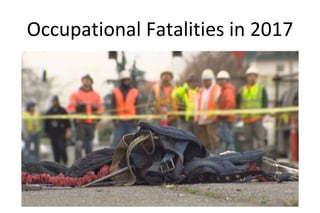
- 1. Occupational Fatalities in 2017
- 2. According to a national census of fatal occupational injuries conducted by the Bureau of Labor Statistics: • There were a total of 5,147 fatal work injuries recorded in the United States in 2017. • This number is down slightly from from the 5,190 fatal injuries reported in 2016. • The fatal injury rate decreased to 3.5 per 100,000 full-time equivalent (FTE) workers, from 3.6 in 2016. Workplace Fatalities in 2017
- 4. Type of Incident • Transportation incidents remained the most frequent fatal event in 2017: ➥ 2,077 fatalities (40 percent) • Fatal falls were at their highest level in the 26-year history of the Census of Fatal Occupational Injuries (CFOI): ➥ 887 deaths (17 percent) • Violence and other injuries by persons or animals decreased by 7 percent. • Homicides and suicides decreased by 8 percent and 5 percent, respectively.
- 5. Type of Incident • Unintentional overdoses due to nonmedical use of drugs or alcohol while at work increased 25 percent: ➥ 272 in 2017, up from 217 in 2016 ➥ This was the fifth consecutive year in which workplace overdose deaths increased by at least 25 percent. • Fatalities involving confined spaces rose 15 percent: ➥ 166 in 2017, up from 144 in 2016
- 6. • Contact with objects and equipment incidents were down 9 percent: ➥ 695 in 2017, from 761 in 2016 • Caught in running equipment or machinery deaths were down 26 percent: ➥ 76 in 2017, from 103 in 2016 • Crane-related workplace fatalities fell to their lowest level ever recorded: ➥ 33 deaths in 2017 Type of Incident
- 9. • Fishers, related fishing workers, and logging workers had the highest published rates of fatal injury in 2017. • The transportation and construction industries accounted for 47 percent of occupational fatalities in 2017. • Grounds maintenance workers incurred 244 fatalities in 2017, a small decrease from 2016 (247), but still the second-highest total since 2003. ➥ A total of 36 deaths were due to falls from trees, and another 35 were due to being struck by a falling tree or branch. Occupation
- 10. • There were 258 fatalities among farmers, ranchers, and other agricultural managers in 2017. ➥ 162 of these farmers - approximately 63 percent - were age 65 and over, with 48 being age 80 or over. ➥ Of the 258 deaths, 103 involved a farm tractor. • Police and sheriff’s patrol officers incurred 95 fatal occupational injuries in 2017, down from 108 fatalities in 2016. Occupation
- 13. • Fifteen percent of the fatally-injured workers in 2017 were age 65 or over – the highest recorded rate for that age group. • In 1992, the first year CFOI published national data, that figure was 8 percent. • These workers also had a higher fatality rate than other age groups in 2017. Other Key Findings
- 15. • Workplace fatalities in the private mining, quarrying, and oil and gas extraction industry increased 26 percent: ➥112 in 2017 from a series low of 89 in 2016 • Over 70 percent of these fatalities were incurred by workers in the oil and gas extraction industries. Other Key Findings
- 16. • 27 states had fewer fatal workplace injuries in 2017 than 2016. • 21 states and the District of Columbia had more. • California and Maine had the same number as 2016. • A total of 192 metropolitan statistical areas (MSAs) had 5 or more fatal work injuries in 2017. Other Key Findings
Editor's Notes
- Rev. April, 1997
- Rev. April, 1997
- Overall number of fatal work injuries, 2003-2017 (broken down by self-employed vs wage/salary workers) https://www.bls.gov/iif/oshwc/cfoi/cfch0016.pdf
- Rev. April, 1997
- Rev. April, 1997
- Rev. April, 1997
- https://www.bls.gov/iif/oshwc/cfoi/cfch0016.pdf
- https://www.bls.gov/iif/oshwc/cfoi/cfch0016.pdf
- Rev. April, 1997
- Rev. April, 1997
- https://www.bls.gov/iif/oshwc/cfoi/cfch0016.pdf
- https://www.bls.gov/iif/oshwc/cfoi/cfch0016.pdf
- Rev. April, 1997
- https://www.bls.gov/iif/oshwc/cfoi/cfch0016.pdf
- Rev. April, 1997
- Rev. April, 1997
- https://www.bls.gov/iif/oshwc/cfoi/cfch0016.pdf