Method development and validation for the simultaneous estimation of sitaglip...
Comparison of Formulation Analysis by UPLC FINAL
1. Comparison of Formulation Analysis by UPLC/MS and UPLC/UV
Jessica Sitko1, Kim Navetta2, Russell Drago2, Anthony Perretta2, Jennifer Colangelo2
Colgate University, Hamilton, NY1, Drug Safety Research and Development, Pfizer, Groton, CT2
Timely and accurate formulation analysis is critical for all drug safety studies to ensure that the test animals
receive the intended dose. In the past year, the number of GLP samples sets for formulation analysis in the
analytical lab has doubled and there has been a 3-fold increase in formulations being out of specifications.
The increase in out-of-specification formulations more than triples the number of samples received for
analysis, therefore, there is a great need to increase efficiencies. Currently, formulation samples are analyzed
using ultra high pressure liquid chromatography (UPLC) coupled with ultraviolet (UV) detection. Mass
spectrometers (MS) could be used as alternative detectors and are widely used in biomarker, metabolism and
clinical pathology labs. In general, MS assays are faster to develop, more specific, more sensitive and have
fewer problems with interferences. Chromatography can be simplified in MS assays, resulting in little or no
need to make complex mobile phases. The purpose of this project is to bring on-line a simple MS assay
using the newly purchased single quadrupole mass spectrometer and measure the formulations submitted to
the analytical lab over the summer. The results will be compared to those obtained with the UV method to
determine if the MS assay produces comparable results.
1. This experiment used a Waters Acquity Classic UPLC with PDA
detector (UPLC/UV) and a Waters Acquity I-Class UPLC with a
QDa detector (UPLC/MS) (Figure 1).
2. Different mobile phases were compared to determine which
produced chromatographic peaks that met system suitability and
linearity requirements with each compound on the UPLC/UV
and UPLC/MS (Table 1).
3. Working standards were made from stock solutions and analyzed
by UPLC/UV, then analyzed by UPLC/MS.
4. Peak integration was performed using Empower 2 Build 2154 to
determine system suitability.
5. System suitability, accuracy and precision, and linearity results
were compared between the two systems.
6. Individual standard curves for each compound assessed were
constructed by plotting the peak area versus concentration of five
standards ranging from 0.001 mg/mL to 0.02 mg/mL. Slope and
y-intercept were calculated using a linear fit with no weighting.
The concentration of drug in vehicle was calculated relative to
the regression line.
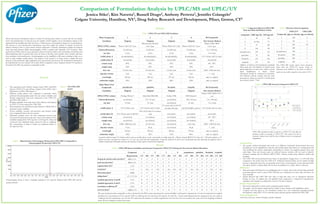
Figure 1. The UPLC/MS
system
Chromatogram shown is from a cisapride standard at 0.01 mg/mL obtained with UPLC/MS and the
generic method.
Figure 2. Representative Chromatogram Produced by UPLC/MS is Comparable to
Chromatograms Produced by UPLC/UV Conclusions
• The generic method developed and tested on 8 different compounds demonstrated that assay
development can be simplified by using the same mobile phase and column as a starting point and
only modifying the column temperature and gradient to achieve the required capacity factor and
peak shape. Time and resource gains are achieved because scientists will not need to identify,
purchase, maintain and test different HPLC/UPLC columns, mobile phase additives, buffers and
modifiers.
• The UPLC/MS system produced lower limits of quantitation ranging from 5 to 200 fold when
compared to the results from the UPLC/UV. Enhanced detection limits can be critical for high
potency compounds since they are generally used at lower concentrations. Lower detection limits
also allow scientist to further dilute the low dose formulations if a vehicle effect is observed.
Obstacles
• Data processing with Empower was challenging due to a newly discovered software bug and batch
processing did not work on most UPLC/MS data sets. Calculations for these data sets had to be
done manually.
• Signals detected with UPLC/MS were often so high that carry over to subsequent injections
became an issue. To address this, all standards from compound 1, compound 8, propafenone,
quinidine, and cisapride were diluted by a factor of 10 and re-injected.
Future Experiments
• Run more compounds on both systems using the generic method.
• Investigate why the signal is suppressed by vehicle in some instances and amplified in others.
• Compare total time spent on one formulation analysis for a new compound, including methods
development, using UPLC/UV to total time spent using the generic method and UPLC/MS.
Acknowledgments
Carol Fritz, Lina Luo, Annie LoGuidice, and Jiri Aubrecht
Results
MethodsProject Rationale
Methods
MS assay produced results comparable to those obtained by the PDA system, determined by system suitability1 and linearity2 requirements. 0.2 mg of compound was weighed
and diluted to concentrations of 0.01 mg/mL (STD A), 0.005 mg/mL (E1 and E2), 0.015 mg/mL (F1 and F2). A check mark indicated that the requirement was met, while an
x indicates that the requirement was not met. We expect that the instances in which requirements were not met were not caused by the assay, but from weighing or dilution
errors. We are working to resolve these issues.
Table 2. UPLC/MS System Suitability and Linearity Compared to UPLC/UV Utilizing the New Generic Method Described
Compound
Requirements UV MS UV MS UV MS UV MS UV MS UV MS UV MS UV MS
drug peak retention time precision1
RSD ≤ 5%
peak area precision1
RSD ≤ 2%
capacity factor (k')1
≥ 2.0
resolution1
≥ 1.5 NA NA NA NA NA NA NA NA NA
theoretical plates1
≥2000
tailing factor1
0.7 ≤ T ≤ 2.0
standard agreement: A and B ± 2%
standard agreement: A and C ± 2%
correlation ceofficient, R2
≥0.99
recovery factor2
%RSD ≤ 5%
1 flecainide cisapride2 3 8 propafenone quinidine
Addition of vehicle to the formulation standards
affects peak area. The addition of vehicle caused
signal suppression in some cases, while it caused
signal amplification in others. Future
experiments should be conducted to determine
how different vehicles interact with the mass
spectrometer. (Peak area with 20 % vehicle/peak
area without vehicle * 100)
Table 3. % Agreement Between UPLC/MS
Peak Area With and Without Vehicle
compound 0.001 mg/mL 0.01 mg/mL
1 98 100
2 no data 73
3 97 100
8 146 136
propafenone 102 112
quinidine 93 141
flecainide 101 102
cisapride 174 110
The UPLC/MS system shows lower detection
limits than the UPLC/UV system. Limits of
detection were defined as the point at which a
peak was seen with a signal-to-noise ratio of 10:1.
Table 4. Detection Limit Comparison
Compound
UPLC/UV
(pg on column)
UPLC/MS
(pg on column)
1 100 2
2 50 1
3 100 20
8 100 1
propafenone 100 1
flecainide 200 1
quinidine 200 5
cisapride 100 1
A generic method using 0.1% formic acid in water as mobile phase A and acetonitrile as mobile phase B, a Waters Acquity BEH C18 1.7µm (2.1 x 100 mm) column, a 3-4
minute run time, and injection volume of 1 or 2 µL was used with all 8 compounds. Using this method for all or most compounds and only adjusting the gradient and/or
column temperature will greatly decrease the amount of time spent in methods development
Table 1. UPLC/UV and UPLC/MS Conditions
Pfizer Compounds 1 2 3 8 All Compounds
Conditions Original Original Original Original New Generic Method
HPLC/UPLC column Waters CSH C18 1.7µm
Phenomenex Kinetex
C18 1.3µm Waters BEH C18 1.7µm Waters CSH C18 1.7µm
Waters UPLC BEH
C18 1.7µm
Column dimensions 2.1x100 mm 2.1x50 mm 2.1x100 mm 2.1x100 mm 2.1 x 100 mm
run time 4 min 4 min 4 min 3 min 3 to 4 min
mobile phase A 50 mM KH2PO4 50 mM KH2PO4 50 mM KH2PO4 50 mM KH2PO4 0.1% formic acid in water
mobile phase B Acetonitrile Acetonitrile Acetonitrile Acetonitrile Acetonitrile
column temp 40°C 45°C 45°C 50°C 40° - 50°C
sample temp 22°C 22°C 22°C 22°C 22° C
flow rate 0.4 mL/min 0.5 mL/min 0.4 mL/min 0.4 mL/min 0.400 - 0.500 mL/min
injection volume 2 µL 1 µL 2 µL 2 µL 1 - 2 µL
wavelength 254 nm 246 nm 277 nm 345 nm same as original
molelcular weight 390.1 342.5 286.1 538.9 same as original
Safety Pharm Tool
Compounds propafenone quinidine flecainide cisapride All Compounds
Conditions Original Orignial Original Original New Generic Method
HPLC/UPLC column Prodigy Phenyl 3 Shim-Pack XR-ODS Zorbax TMS ODS Hypersil
Waters UPLC BEH C18 1.7
µm
Column dimensions not defined 2.0 x 75 mm not defined 150 x 4.6 mm 2.1 x 100 mm
run time 10 min 10 min not defined 16 min 3 to 4 min
mobile phase A 0.1% formic acid 0.1% formic acid in water
1% acetic acid in 0.01 M
pentanesulfonate 0.05 M Na2HPO4, pH 8.4 0.1% formic acid in water
mobile phase B 0.1% formic acid in MeOH
95% ACN with 0.1% formic
acid acetonitrile acetonitrile acetonitrile
column temp not defined not defined not defined not defined 40° - 50°C
sample temp not defined not defined not defined not defined 22° C
flow rate 0.200 - 0.400 mL/min 0.5 mL/min not defined 1 mL/min 0.400 - 0.500 mL/min
injection volume 10 µL 20 µL not defined 20 µL 1 - 2 µL
wavelength 254 nm 330 nm 308 nm 272 nm same as original
molelcular weight 342.2 325.1 415.6 466.1 same as original
UPLC/MS produced results as precise as UPLC/UV, but did not
produce results as accurate as UPLC/UV. The reason for this is
currently unclear, but could be due to dilution errors or compound
degradation.
Figure 3. UPLC/MS Accuracy Compared to UPLC/UV