1. ANNEX 5 Planning Worksheet
SCHOOL IMPROVEMENT PLANNING
PLANNING WORKSHEET
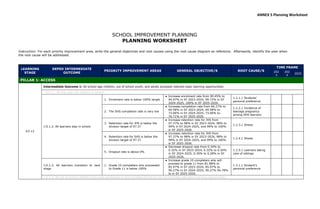
Instruction: For each priority improvement area, write the general objectives and root causes using the root cause diagram as reference. Afterwards, identify the year when
the root cause will be addressed.
LEARNING
STAGE
DEPED INTERMEDIATE
OUTCOME
PRIORITY IMPROVEMENT AREAS GENERAL OBJECTIVE/S ROOT CAUSE/S
TIME FRAME
202
3
202
4
2025
PILLAR 1: ACCESS
K3-12
Intermediate Outcome 1: All school-age children, out of school youth, and adults accessed relevant basic learning opportunities
I.O.1.1. All five-year-old children in school
I.O.1.2. All learners stay in school
1. Enrolment rate is below 100% target
● Increase enrolment rate from 90.45% to
94.97% in SY 2023-2024, 99.72% in SY
2024-2025, 100% in SY 2025-2026.
1.2.1.1 Students’
personal preference
2. The SHS completion rate is very low
● Increase completion rate from 66.27% to
69.58% in SY 2023-2024, 69.58% to
73.06% in SY 2024-2025, 73.06% to
76.71% in SY 2025-2026.
1.2.2.1 Incidence of
teenage pregnancy
among SHS learners
3. Retention rate for JHS is below the
division target of 97.37
● Increase retention rate for JHS from
97.37% to 98% in SY 2023-2024, 98% to
99% in SY 2024-2025, and 99% to 100%
in SY 2025-2026.
1.2.3.1 Illness
4. Retention rate for SHS is below the
division target of 97.37
● Increase retention rate for JHS from
97.37% to 98% in SY 2023-2024, 98% to
99% in SY 2024-2025, and 99% to 100%
in SY 2025-2026.
1.2.4.1 Illness
5. Dropout rate is above 0%
● Decrease dropout rate from 0.34% to
0.32% in SY 2023-2024, 0.32% to 0.30%
in SY 2024-2025, 0.30% to 0.28% in SY
2025-2026.
1.2.5.1 Learners taking
care of siblings
I.O.1.3. All learners transition to next
stage
1. Grade 10 completers who proceeded
to Grade 11 is below 100%
● Increase grade 10 completers who will
proceed to grade 11 from 81.88% to
85.97% in SY 2023-2024, 85.97% to
90.27% in SY 2024-2025, 90.27% 94.78%
to in SY 2025-2026.
1.3.1.1 Student’s
personal preference
I.O.1.4. All out-of-school children and youth participate in and complete formal or non-formal basic education learning opportunities
2. ANNEX 5 Planning Worksheet
LEARNING
STAGE
DEPED INTERMEDIATE
OUTCOME
PRIORITY IMPROVEMENT AREAS GENERAL OBJECTIVE/S ROOT CAUSE/S
TIME FRAME
202
3
202
4
2025
PILLAR 2: EQUITY
K3-12
Intermediate Outcome 2: Disadvantaged school-age children and youth and adults benefited from appropriate equity initiatives
I.O.2.1. All school-age children and youth
and adults in situations of disadvantage
are participating in basic opportunities
and receiving appropriate quality
education
1. Percentage of Secondary Learners in
Situations of Disadvantage Continue
to Participate in Basic Education is
low
● To increase the percentage of Secondary
Learners in Situations of Disadvantage
Continue to Participate in Basic Education
from 40.47 to 42.76 for S.Y 2023-2024; to
44.90, 47.14 for SY 2024-2025 and 49.50
for SY 2025-2026.
2.1.1.1 Lack of interest to
education
2. Percentage of Secondary Learners in
Situations of Disadvantage Who
Achieved at Least a Fixed Level of
Proficiency/Mastery in Reading
Literacy is low
● To increase the percentage of Secondary
Learners in Situations of Disadvantage Who
Achieved at Least a Fixed Level of
Proficiency/Mastery in Reading Literacy is
low 22.28 to 23.38 for SY 2023-2024;
24.55 for SY 2024-2025 and 25. 78 for SY
2025-2026.
2.1.2.1 Feeling of
inferiority
2.1.2.2 Lack of education
among parents
2.1.2.3 Lack of
opportunity to express
cultural identity
3. Percentage of Secondary Learners in
Situations of Disadvantage Who
Achieved at least a Fixed level of
Proficiency/Mastery in 21st Century
Skills is low
● To increase the percentage of Secondary
Learners in Situations of Disadvantage Who
Achieved at least a Fixed level of
Proficiency/Mastery in 21st Century Skills
from 28.34 to 29.76 for SY 2023-2024;
31.25 for SY 2024-2025; and 32. 81 for SY
2025-2026.
2.1.3.1 Lack of
contextualized learning
materials
PILLAR 3: QUALITY
K3-12
Intermediate Outcome 3: Learners complete K-12 basic education having attained all learning standards that equip them with the necessary skills and attributes to pursue their chosen
paths in education
I.O. 3.1 Learners attain Stage 1 learning standards of literacy and numeracy skills
I.O. 3.2. Learners attain Stage 2 (Grade 6) learning standards of literacy & numeracy skills and apply 21st century skills to various situations
I.O. 3.3. Learners attain Stage 3 (Grades
7-10) learning standards of literacy and
numeracy skills and apply 21st century
skills to various situations
1. Percentage of Grade 10 Learners
Attaining Nearly Proficient Level or
Better in Stage 3 Literacy and
Numeracy Standards is low
● To increase the percentage of Grade 10
Learners Attaining Nearly Proficient Level
or Better in Stage 3 Literacy and
Numeracy Standards from 31.25 to 32.81
for SY 2023 to 2024, from 32.81 to 34.45
for SY 2024 to 2025, and from 34.45 to
36.18 for SY 2025-2026.
3.3.1.1 Lack of reading,
comprehension and
numeracy skills
3.3.1.2 Lack of focus on
the teaching-learning
process due to excessive
teaching and ancillary
loads for teachers
3.3.1.3 Lack of
motivation among
3. ANNEX 5 Planning Worksheet
LEARNING
STAGE
DEPED INTERMEDIATE
OUTCOME
PRIORITY IMPROVEMENT AREAS GENERAL OBJECTIVE/S ROOT CAUSE/S
TIME FRAME
202
3
202
4
2025
parents to send their
learners to school
I.O. 3.4 Learners attain Stage 4 (Grades
11-12) learning standards
1. Percentage of Learners
Proceeded to College is low
● To increase the percentage of Learners
Proceeded to College from 39.09 to
41.04 for SY 2023-2024, from 41.04 to
43.10 for SY 2024-2025, and from 43.10
to 45.25 for SY 2025-2026
3.4.1.1 Lack of financial
and moral support from
parents
3.4.1.2 Early marriage
and pregnancy
2. Percentage of Learners
Proceeded to Employment is low
● To increase the percentage of learners
proceeding to employment from 5.45 to
5.72 for SY 2023-2024, from 5.72 to
6.01 for SY 2024-2025, and from 6.01 to
6.31 for SY 2025-2026.
3.4.2.1 Lack of learning
facilities and equipment
3. Percentage of Learners
Proceeded to Entrepreneurship
is low
● (Not applicable due to the nature of
strands being offered)
(Not applicable)
4. Percentage of Learners
Proceeded to Middle Level Skills
Training is low
● To increase the percentage of learners
from 0 to 0.05 for SY 2023-2024, from
0.05 to 0.052 for SY 2024-2025, and
from 0.052 to 0.055 for SY 2025-2026
3.4.4.1 Limited slots from
vouchers programs
5. Percentage of Grade 12
Learners Attaining Nearly
Proficient Level or Better in
Stage 3 Literacy and Numeracy
Standards is low
● To increase the percentage of Grade 12
Learners Attaining Nearly Proficient Level
or Better in Stage 3 Literacy and
Numeracy Standards from 31.25 to 32.81
for SY 2023 to 2024, from 32.81 to 34.45
for SY 2024 to 2025, and from 34.45 to
36.18 for SY 2025-2026.
3.4.5.1 Lack of reading,
comprehension and
numeracy skills
3.4.5.2 Lack of focus on
the teaching-learning
process due to excessive
teaching and ancillary
loads for teachers
3.4.5.3 Some parents are
illiterate and cannot
assist their learners
PILLAR 4: RESILIENCY AND WELL-BEING
K3-12
Intermediate Outcome 4: Learners are resilient and know their rights and have the life skills to protect themselves and claim their education related rights from DepEd and other duty-
bearers to promote learner's well-being
4. ANNEX 5 Planning Worksheet
LEARNING
STAGE
DEPED INTERMEDIATE
OUTCOME
PRIORITY IMPROVEMENT AREAS GENERAL OBJECTIVE/S ROOT CAUSE/S
TIME FRAME
202
3
202
4
2025
I.O. 4.1. Learners are served by a
department that adheres framework at
all levels
1. Percentage of Secondary Learners
who are Happy and Satisfied with
their Basic Education Experience is
low
● To increase percentage of Secondary
Learners who are Happy and Satisfied
with their Basic Education Experience
from 86.67 to 91% in SY 2023-2024,
95.55 in SY 2024-2025 and 100% in SY
2025-2026
c/o Ma’am Buhay
● To increase compliance of the
requirements for Child protection policy
checklist from 60% to 63% in SY 2023-
2024, 63% to 66% in SY 2024-2025, and
66% to 69% in SY 2025-2026
4.1.1.1 Lack of code of
conduct for school
administrator and non-
teaching personnel
4.1.1.2 Lack of CPC
quarterly meeting
2. Percentage of Affected and Displaced
Secondary Learners Retained must
be sustained
● To sustain the percentage of Affected
and Displaced Secondary Learners
Retained
4.1.2.1 Lack of parental
support
I.O. 4.2. Learners are safe and
protected and can protect themselves
from risks and impacts from natural and
human-induced hazards
1. Percentage of Learners Equipped
with Capacities on what to do Before,
During, and After a Disaster/
Emergency is below 100%
● To increase the percentage of Learners
Equipped with Capacities on what to do
Before, During, and After a Disaster/
Emergency to 100% in the next three
SYs.
4.2.1.1 Lack of
emergency equipment
4.2.1.2 Lack of training
to personnel and learners
2. Percentage of Learners in Safe
Schools is low
● To increase the percentage of Learners in
Safe Schools to 100% in the next three
SYs.
4.2.2.1 Damage school
buildings and facilities
4.2.2.2 Presence of
physical hazards
I.O..4.3 Learners have the basic
physical, mental, and emotional
fortitude to cope with various challenges
in life
1. Percentage of Learners with
Improved Health Physical Fitness is
below 100%
● To increase the percentage of Learners
with Improved Health Physical Fitness to
100% in the next three SYs.
4.3.1.1 Lack of physical
activities
● ENABLING MECHANISM: MANAGEMENT AND GOVERNANCE
Enabling Mechanism # 1: Ensure all
education leaders and managers
practice participative, ethical, and
inclusive management process
1. SBM level 3 rating is below 3.0 ● Increase SBM Level rating from 2.84 to
2.98
5.1.1.1 Insufficient
participation from
internal and external
stakeholders
Enabling Mechanism # 2: Ensure
human resources in all governance
1. OPCRF rating of the school head is
below 5.0 ● Increase OPCRF rating from 4.85 to 4.90
5.2.1.1 Lack of school-
based action research
5. ANNEX 5 Planning Worksheet
LEARNING
STAGE
DEPED INTERMEDIATE
OUTCOME
PRIORITY IMPROVEMENT AREAS GENERAL OBJECTIVE/S ROOT CAUSE/S
TIME FRAME
202
3
202
4
2025
levels are sufficient, resilient,
competent, and continuously improving
5.2.1.2 Delays in the
submission of liquidation
reports
2. IPCRF rating of teachers is below 5.0 ● Increase IPCRF rating of teachers to 4.90
5.2.2.1 Lack of training
among teachers
Enabling Mechanism # 3: Ideal
learning environment and adequate
learning resources for learners ensured
1. Classroom to learner’s ratio is not
ideal for Grade 9 at 1:58
● Reduce classroom to learners ratio from
1:58 to 1:45
5.3.1.1 Lack of classroom
2. Textbooks to learners ratio is not
ideal ● 5.3.2.1 Lack of textbooks
3. Seats to learners ratio is not ideal at
1:1.23
● Reduce seats to learners ratio from
1:1.23 to 1:1.15
5.3.3.1 Lack of armchairs
4. Science and Math Equipment to
learners ratio is not ideal
● Reduce Science to Math Equipment ratio
from
5.3.4.1 Insufficient
Science and Math
equipment
5. ICT Package to learners ratio is not
ideal 1:44
● Reduce ICT package ratio to learners
from 1:44 to 1:40
5.3.5.1 Insufficient ICT
equipment and devices
6. Library is not functional ● Make the library functional 5.3.6.1 Damaged wall
7. Connection to electricity must be
sustained ● Sustain electrical connection
5.3.7.1 Lack of building
permit and electrical plan
8. Water connection must be sustained ● Sustain water connection
5.3.8.1 Damaged water
lines and faucets
9. Connection to internet must be
sustained ● Sustain internet connectivity
5.3.9.1 Lack of access
points
Enabling Mechanism # 4: Improve
and modernize internal systems and
processes for a responsive and efficient
financial resource management
1. CCSS rating is below 5.0 ● Increase CCSS rating from 4.52 to 4.55
5.4.1.1 Lack of
orientation to service
providers
Enabling Mechanism # 5: Strengthen
active collaboration with key
stakeholders
1. SGC is not fully functional ● Make SGC fully functional
5.5.1.1 Lack of
orientation
Enabling Mechanism # 6: Enhance
and strengthen the public - private
complementarity
1. SHS Voucher Program must be
sustained ● Sustain SHS voucher program
5.New set of learners
every school year