An Academic Survey Concerning High School And University Students Attitudes And Approaches To Problem Solving In Chemistry
•
0 likes•5 views

Custom Writing Service http://StudyHub.vip/An-Academic-Survey-Concerning-High-Scho 👈

Recommended
Recommended
More Related Content
Similar to An Academic Survey Concerning High School And University Students Attitudes And Approaches To Problem Solving In Chemistry
Similar to An Academic Survey Concerning High School And University Students Attitudes And Approaches To Problem Solving In Chemistry (20)
More from Jeff Nelson
More from Jeff Nelson (20)
Recently uploaded
Recently uploaded (20)
An Academic Survey Concerning High School And University Students Attitudes And Approaches To Problem Solving In Chemistry
- 1. International Journal of Environmental & Science Education, 2016, 11(5), 819-837 © Author(s) Originally published by Look Academic Publishers in IJESE (ISSN: 1306-3065) An Academic Survey Concerning High School and University Students’ Attitudes and Approaches to Problem Solving in Chemistry Muharrem Duran Bozok University, Faculty of Education, TURKEY Received 19 January 2016 Revised 28 February 2016 Accepted 26 March 2016 The aim of this study is to reveal differences between attitudes and approaches of students from different types of high school and the first grade of university towards problem solving in chemistry. For this purpose, the scale originally developed by Mason and Singh (2010) to measure students’ attitude and approaches towards problem solving in physics (AAPS), was adapted for chemistry. The Attitudes and Approaches to Chemistry Problem Solving (AACPS) scale included Likert-type items and was conducted with 552 students from science (2), regular (2), and vocational (2) high schools, plus one university. No statistically significant difference were found among high schools, but there was between high school and university students, and between female and male students in terms of their attitudes and approaches towards problem solving in chemistry. University students demonstrated more expert-like attitudes towards problem solving, and science and regular high school students were similarly expert- like, while the vocational high school students were rather novice-like. The results obtained through the AAPS physics attitude scale conducted in the same sample group were compared with results of the chemistry scale. Variances between these attitudes and approaches towards problem solving in both chemistry and physics were analyzed and some suggestions made. Keywords: chemistry teaching, problem solving, attitude scale, expert-novice problem solvers. INTRODUCTION Recent developments in science and technology have predominantly emerged in the field of chemistry, which is one of the most significant disciplines of science. Undoubtedly, an effective science education is vital so as not to let students fall behind these rapid developments and in order to raise individuals who are open to advancements, have the ability to keep pace with new developments, undertake Correspondence: Muharrem Duran, Bozok University, Faculty of Education, Yozgat, TURKEY E-mail: muharremduran@gmail.com doi: 10.12973/ijese.2016.407a
- 2. M. Duran 820 © Author(s), International J. Sci. Env. Ed., 11(5), 819-837 research, and are able to enquire, produce something new, and have a good level of self-confidence. Therefore, the main objective of chemistry education is defined as to have knowledge and understanding about the basic concepts relevant to substances, the interactions between substances, and to raise awareness about historical development of these concepts and their effects on individual, social, economic and technologic worlds, as well as the relation with the natural environment (TTB, 2007). Chemistry is a difficult subject to learn (Markow & Lonning, 1998; Scudder, 1997), because students mostly encounter physical phenomena in their daily lives rather than chemical ones (Hand & Treagust, 1991). For instance, in physics, students may easily correlate moving objects by using the force concepts and in biology, understand the growth of plants taking nutrients from the soil and energy from the sun. As Taber (2001) also argues, chemistry, contrary to biology and physics, does not provide a comprehensible structure in the mind about new experiences that are encountered every day. This abstract side of chemistry results in parrot fashion learning rather than conceptual comprehension (Gabel, Samuel, & Hunn, 1987). Although there are many methods offered by researchers in order to learn chemistry well (e.g., laboratory activities, IT, multimedia etc.), for the permanence of this knowledge, namely to become an expert in chemistry, a cognitive structure of the basic knowledge, problem-solving skills and expert-like approaches and attitudes are required. There is already agreement among researchers regarding the fact that positive attitudes significantly affect students’ success in science classes (Ayyildiz, 2012). Students’ attitudes and approaches towards learning science are of as much importance as their academic success. Ramsden (1998) regards “science” as an umbrella concept and emphasizes that it contains biology, chemistry, physics, and other relevant fields. The same researcher also claims that studies on students’ attitudes should be examined separately for each of these fields; partly because the positive attitude of (especially female) students towards biology is a well-known fact. There are studies about students’ attitudes towards the sciences (physics, chemistry, biology) within the literature. Some of these studies with attitude tests suggest a high correlation between this positive attitude for chemistry and the success of students (Simpson & Wasik, 1978; Soyibo, 1985; Wilson, 1983). Moreover, some gender-related studies suggest that male students have more positive attitudes towards chemistry, while others claim the same result for females. The first study about the effects of gender on secondary school students’ attitudes towards chemistry was conducted by Hofstein, Ben-Zvi, and Samuel (1977), with the scale developed by Tamir, Arzi, and Zloto (1974), basically for the subject of physics, adjusted and used for chemistry. 300 students from 11th and 12th grades were applied the attitude scale which is composed of 76 items, which resulted in a determination that female students had more positive attitudes towards chemistry than males. Not many studies have been conducted in a class environment that are relevant to students’ attitudes towards chemistry. Such kinds of studies are mostly concerned with ‘science’ as an umbrella subject area. Hofstein et al. (1977) determined that positive attitudes of students towards studying chemistry decrease when they start the 12th grade. However, Menis (1989) states that 12th grade students have more positive attitudes than do 11th grade students. It is also a well-known fact that students’ attitudes and approaches towards learning significant affect what they really learn. Problem solving methods would improve cognitive levels of students and enable them to comprehend any subject in a better way. Comprehension of the subject and achieving success in chemistry are only possible through a full knowledge of the
- 3. Students’ attitudes and approaches to problem solving in chemistry © Author(s), International J. Sci. Env. Ed., 11(5), 819-837 821 relevant chemistry subjects and being expert in chemistry problems, even though some of them are hard to solve. If a student does not have a holistic perspective on chemistry subjects and approach them as independent and irrelevant subjects from one another, they cannot compile knowledge in a specific hierarchy, and so cannot solve the problems. Some students think that physics (and likewise chemistry) is a subject only suited to clever and intelligent people, that teachers are the only authority within the class and that students should only listen to instruction, take notes, and learn rote-fashion in order to pass exams. Should they do this, they will likely fail to grasp the core knowledge of the subject, and most probably not be able to analyze and synthesize the subject, not enquire to understand the realities behind the rules of chemistry through a cause-effect relationship, and will ultimately limit their knowledge to superficial information (Gray, Adams, Wieman, & Perkins, 2008; Redish, Saul, & Steinberg, 1998). Teachers can help students to develop their attitudes and approaches towards problem solving by implementing certain explicit teaching strategies in lesson plans. First of all, a modeling, which means that the instructor demonstrates and exemplifies the skills that students should learn, may be obtained by providing knowledge and skills through illustrations regarding chemistry problems. They may conduct coaching throughout the implementation and practice process, and then wean off this relation to help them gain self-confidence and stand on their own two feet (Collins, Brown, & Newman, 1989). Attitudes and approaches towards effective learning impact the way students learn, the time they spend in preparation, and the way they organize their current knowledge in the field within this process. If the teacher is unaware of students’ attitudes and approaches towards problem solving, time and effort could be wasted through employing the wrong strategies for the students’ development. Students mostly start solving problems with a superficial approach, applying their basic knowledge of mathematics and basic formulas, rather than making a conceptual analysis and a solid plan. The curriculum developed by Schoenfeld (1989) to help students acquire attitudes and approaches towards learning mathematics and solving math problems also serves as a good model for this context. Schoenfeld developed a successful strategy to change this approach by dividing students into small groups and tasking them to solve mathematical problems. While solving the problems, Schoenfeld walked amongst them and asked questions like “What are you doing?”, “Why did you choose this way?”, “Would this approach make you any closer to a solution?” etc. Those students who were already accustomed to using formulas performed a conceptual analysis and understood that they needed a good plan from the start. This method applied by Schoenfeld helped many students gain effective approaches towards problem solving in just a couple of weeks, and the students began spending time on qualitative analysis and decision making before considering the given equations (Collins et al., 1989; Schoenfeld, 1989). Novice & expert problem solvers Attitudes and approaches of expert and novice students towards problem solving differ from each other. Expert/novice analysis in attitudes towards learning and problem solving was employed by Chi, Feltovich, and Glaser (1981). The researchers stated that novice students mostly used different methods in solving physics problems; while experts classified problems according to the principles that manage the process, novice students classified according to the superficial structures of the problems. There is a general need for understanding both difficult questions that require more than just recall and simple structures that enable students to solve the problem. Within the study process, expert students, who are mostly undergraduates
- 4. M. Duran 822 © Author(s), International J. Sci. Env. Ed., 11(5), 819-837 and postgraduates, are compared with novice students taking the course for the first time (Smith & Good, 1984). Whilst results are achievable (Camacho & Good, 1989), it is, however, also possible to encounter researchers comparing performances of experts who examine routine exercises and novice students who study on new problems. Larkin and Rainard (1980) divided physics problems through classifications of novice and expert students. Novice students start the process by determining the aim of the problem through a means-ends analysis; finding the difference between the aim and the available information and an equation that may decrease the difference, and then applying the equation. Expert students, on the other hand, use knowledge-development or forward-chaining approaches by starting with the information given in the problem and conducting the processes until they achieve a result. As an alternative to the study on being expert or novice, another research was conducted on the comparison between “expert” and “novice” students. In a study conducted on the performances of high school students solving problems with chemical equations through the HyperCard method (Kumar, 1993), “expert” students were chosen from honor students and “novice” students from normal chemistry classes. Heyworth (1999) supposes another approach that divides students as experts and novices through a paper and pencil test. Students who had not made any calculation errors and had understood the concepts were determined as “experts”, while those who made errors and lower comprehension of concepts were classed as “novices”. Benner (1984) supposes in his study about clinical nurses that the difference of “to know what” and “to know how” can be determined with experience in favor of the latter, as experience is a prerequisite for expertise. According to Elio and Scharf (1990), in terms of physics problems, experts are not actually those who know more than novices; the only difference between them is the way they organize their knowledge in a field and whether or not they apply this knowledge in problem solving. As for this current study, the 10th grade students can be regarded as the “novices”, as they do not possess the adequate experience in chemistry problem solving and have not encountered difficult questions, except those tackled during their chemistry course in the 9th grade. By comparison, the 11th grade students and university undergraduates may be expected to be more expert-like due to their relatively higher level of experience in the field; however, it should also be stressed that, as some of the researchers mentioned have also stated, expert-like attitude is not achieved by simply taking more courses or from having more experience, but from the approach of the student towards the question and the skills gained in order to develop problem solving methods and strategies. Significance of study There are many studies within the literature about secondary school, high school and university students in terms of their attitudes towards chemistry. This current study will focus on high school and university students’ attitudes and approaches towards solving chemistry problems. The lack of such studies found in the literature and the comparison made between attitudes and approaches of high school and university students, brings this current study to prominence. Another characteristic of this current study is that it also examines the approaches and attitudes of the same students towards physics by implementing the AAPS scale, and compares the results with others obtained through the analysis on chemistry. Moreover, adapting a scale originally developed for physics to chemistry would be guiding for future
- 5. Students’ attitudes and approaches to problem solving in chemistry © Author(s), International J. Sci. Env. Ed., 11(5), 819-837 823 studies in science education, as it may be a model for future interdisciplinary studies. Research questions How do students’ attitudes and approaches differ toward solving chemistry problems? Throughout the study, we will seek answers to the following questions; Is there any difference between male and female students in terms of novice- like and expert-like attitudes and approaches towards solving chemistry problems? Is there any difference stemming from types of high-schools in terms of students’ novice-like and expert-like attitudes and approaches towards solving chemistry problems? Is there any difference between high school and university students in terms of novice-like and expert-like attitudes and approaches towards solving chemistry problems? Is there any difference between chemistry and physics courses in terms of students’ novice-like and expert-like attitudes and approaches towards solving problems? METHOD Participants This research was conducted in Ankara and Yozgat, two geographically different cities in Turkey. Two of the six participant schools are regular high schools, two are science high schools, and the other two are vocational high schools. As these sample schools represent the whole population of the study and present better accessibility for the researchers, these cities were chosen as the area of study. In addition, the chosen university is where the researcher is currently lecturing. Types of high schools within this study are regular, science and vocational, with student placement according to scores of a national exam. The most successful students have the chance to study at a science high schools. Science high schools are the most preferred, as studying at these schools means a pretty much guaranteed future for the students. The number of weekly compulsory science courses is higher at science high schools than for other high school types. Regular (Anatolian) high schools are the most widespread high school type in Turkey and the second most preferred high schools after science high schools. History, geography and literature courses are also given at these schools in addition to mathematics and science. In these schools, students are divided into categories and the number of science or social sciences courses is determined according to these divisions. As for vocational schools, science and mathematics courses are obligatory, but at a reduced level. In addition, there are also different courses such as ICT, electrical science and electronics, food technology, technical drawing, library science, logic, sociology, and science of religion. Chemistry courses are given in two course hours for 9th grades of all school types as a compulsory course. This number increases to five hours in 10th grade classes of science high schools, and up to seven course hours (three obligatory and four elective) in the 11th and 12th grades. Regular high schools give this course as two hours obligatory for 10th grades, and four hours elective for 11th and 12th grades. Vocational schools, on the other hand, give two hours of science courses to 10th grade classes and three hours to 11th and 12th grades, both as an elective course. There are 36 weeks in an academic year of high schools. The same chemistry curriculum is implemented across all high school types. The curriculum, course books and subsidiary sources that are used in schools are prepared or certified by the Ministry of National Education. One regular (Anatolian) high school and one
- 6. M. Duran 824 © Author(s), International J. Sci. Env. Ed., 11(5), 819-837 science high school within this current study are private schools, rather than state schools. Private schools implement the same chemistry curriculum prepared by the Ministry, but may act independently in terms of subsidiary sources and materials, and may use additional books and materials. The participant university students are currently in their first year of the science teaching department in the Faculty of Education, working towards a career as science teachers in secondary schools. Most of the undergraduate students have graduated from regular high schools, having taken mathematics, physics, chemistry and other obligatory courses, and passed the Transition to Higher Education Examination (YGS), answering questions predominantly about science, mathematics and literature. The AAPCS scale was implemented to all students at the end of the 2014-2015 academic year. The subjects of chemistry that university students learned during their study are the physical and chemical properties of matter, chemical reactions, aqueous solution reactions, gaseous state of matter, chemical kinetics, thermochemistry, quantum theory and atomic structure, chemical equilibrium and acids and bases. High school students, on the other hand, learned acids-bases-salt, mixtures, industry and biological energy, and chemistry in everyday life in the 10th grade; then chemical reactions and energy, chemical kinetics and equilibrium, equilibrium in aqueous solutions and electrochemistry in the 11th grade. Demographic details about the 522 participant students are given in Table 1. According to Table 1, it is seen that demographic data for some participant students are not included in this dataset. These students were excluded from the analyses (e.g., the 10 students, whose grade levels are not specified were excluded from the grade level analysis). Survey instrument The scale, originally developed for physics course, was adapted for chemistry. The adapted AAPS instrument was prepared by Mason and Singh (2010) based on the Maryland Physics Expectation Survey (Redish et al., 1998), as developed by Marx and Cummings (2007) and Cummings, Lockwood, and Marx (2004) with the purpose of identifying students’ epistemological beliefs towards learning physics for the first time. Its validity has already been verified, having been implemented for many beginner and advanced physics students in the United States. Chemistry and physics, which are two different branches of science, basically analyze the structure of matter and closely interact with each other and face many similar problems. The only difference is in their perspectives and approaches. These two branches of science are at close quarters in certain fields such as physical chemistry, quantum mechanics, nuclear physics/chemistry, material science, spectroscopy, solid state physics, crystallography and nanotechnology. Common subjects of obligatory physics and chemistry courses are; the physical and chemical properties of matter, solid, liquid and gaseous states of matter, atomic theories, thermodynamics, and quantum chemistry. The attitude and approach scale of physics was able to be adapted to chemistry due to the similarities between the course subjects. The scale prepared for the chemistry course included 31 items after omitting two items (numbers 32 and 33). The survey questions are organized in the form of statements that one could agree or disagree with on a scale of “1” (strongly agree) through to “5” (strongly disagree), with “3” signifying a neutral response. The items of AACPS are worded such that while for 22 of them, “strongly agree” and “agree” are favorable responses, for nine items “strongly disagree” and “disagree” are favorable responses (expert-like responses).
- 7. Students’ attitudes and approaches to problem solving in chemistry © Author(s), International J. Sci. Env. Ed., 11(5), 819-837 825 Table 1. Participant frequencies by gender, grade level, and school type Gender Grade School N % N % N % Men 357 65 10th 280 51 Regular 184 34 Women 191 35 11th 223 40 Science 155 28 Not specified 4 1 University 39 7 Vocational 153 28 Not specified 10 2 University 39 7 Not specified 21 3 As an example to the changes in the AAPS physics scale, the item “If I cannot solve a physics problem in 10 minutes, I give up on that problem” was changed to “If I cannot solve a chemistry problem in 10 minutes, I give up on that problem”. Both items were not difficult to answer for both chemistry and physics. In addition, we see that some other attitude scales in the literature were also adapted for the chemistry course such as Tamir et al. (1974). Examples about favorable (expert-like) and unfavorable (novice-like) answers were given and the expert-like answers were also stated in parentheses: If I cannot solve a chemistry problem in 10 minutes, I give up on that problem, (expert-like responses; “disagree somewhat”, “strongly disagree”). The answers; “agree somewhat” or “strongly agree” were regarded as “novice-like” answers. When I have difficulty in solving a chemistry homework problem, I like to think through the problem with a peer, (expert-like responses; “agree somewhat”, “strongly agree”). If the answer was “disagree somewhat” or “strongly disagree”, it was accepted as “novice-like”. The details about novice-like and expert-like questions can be seen in the study of Mason and Singh (2010). Validity and reliability In order to ensure validity of the instrument, the first version of AAPS scale which had been prepared and developed in English was translated into Turkish with the help of experts within the field of science, and then some students were asked to read the scale in order to check the language correctness. The translation was made by three experts in science teaching and an expert translator who has specialized in this field. Then, the translated texts were checked by two instructors who normally give lessons for university preparatory classes. After that, these translations were sent to the researchers who had developed the original scale and these researchers then asked two other researchers who are native Turkish living in United States, and they also agreed on correctness of the translations. Secondly, completing the translation of the AAPS scale, the questions were given to five high-school students from different schools who were asked to read and interpret the questions. It was important to take feedback from the schools which are within the scope of the study so as to determine whether or not there were concepts or words with which students were not yet familiar. Students were also asked to write notes on any questions they found difficulty with, or were simply unfamiliar to them. Two students from the 10th grade stated that they could not understand the 7th question as it was too long. The researcher made the necessary changes to the question in order to make it shorter and more comprehensible. On the other hand, two university students were asked to read out the questions one by one and think aloud, in order to determine whether or not they had difficulties in understanding. Both of the students completed the questions without any problems in either reading or understanding them. Therefore, the items were finalized, and
- 8. M. Duran 826 © Author(s), International J. Sci. Env. Ed., 11(5), 819-837 written in an understandable format ready to be implemented to the selected students of the participant high schools and university. Thirdly, the scale was conducted at the end of the 2014-2015 academic year. It was applied to high school students by chemistry teachers within the last 20 minutes of course hours. Five more minutes were given to students who could not complete the scale within the allotted time. As for the university students, they were able to complete the scale within 20 minutes as the researcher was their own instructor. It was expressed to the students that the scale had been prepared in order to enhance the quality of chemistry teaching, they were free to choose whether or not to answer anything, that they would not be penalized if they did so, but most importantly, their answers had to be honest. All of the students were eager to participate in the study and did not ask for any help throughout the process. It can be inferred therefore, that the adapted scale was easily understandable and did not include any mistakes in terms of translation. Finally, having collected the data, the Cronbach alpha (α) value was measured in order to identify reliability of the scale in terms of internal consistency. α values of different groups are shown in Table 2 (gender, school types, and grades). It is seen that the Cronbach alpha values are above the admissibility level (0.70<α<0.86). Data analysis Variances were analyzed item by item through descriptive and inferential statistics. Normalized datasets were used for the descriptive statistics. In order to standardize the data, favorable, unfavorable and neutral responses were assigned with “+1”, “-1” and “0” values respectively. As a result of this process, each participant was scored between -1 and +1 for each item. In the following section, we will primarily give standard statistics about differences between gender, grades, and school type and offer the most significant results. After a general analysis of differences between total scores of groups, the items will be examined through a chi- square test. Within the process of analyzing the data, it was considered appropriate to apply the Factorial ANOVA test in order to analyze the effects of gender, school type, and grade on students’ attitudes and approaches towards chemistry problems. However, one of the assumptions of the Factorial ANOVA was unable to be met. The “Levene's Test of Equality of Error Variances” showed that the error variance of the dependent variable (students’ scores) was not equal across groups. For this reason, a non- parametric test, chi-square test was implemented instead. The study will try to find out whether or not there are statistically significant variances between the responses of different groups (males vs. females, regular high schools vs. science high schools or universities) using the results to be obtained through the chi-square test and the AACPS scale. Likewise, the chi-square test will be used in order to reveal whether or not there are statistically significant differences between the questions given in the AACPS/AAPS scales about chemistry and physics courses. Table 2. Cronbach α values for different groups of students Category All Grade School Gender 10th 11th Regular Science Vocational University Male Female N 552 280 223 184 155 153 39 357 191 α 0.815 0.808 0.824 0.789 0.828 0.852 0.753 0.830 0.742
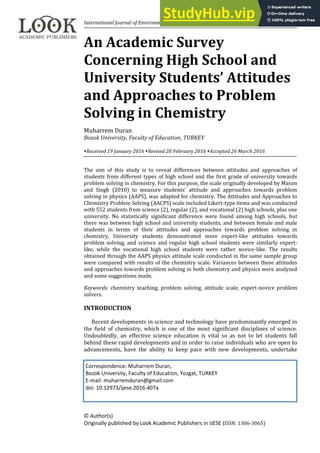
- 9. Students’ attitudes and approaches to problem solving in chemistry © Author(s), International J. Sci. Env. Ed., 11(5), 819-837 827 RESULTS The data obtained was classified according to grade and school type. As the gender and levels of classes were composed of sub-groups, the differences between the groups were analyzed through the t-test. Moreover, there were four different types of schools, and to analyze the difference between mean scores ANOVA was implemented, and Benforroni analysis was conducted as Posthoc analysis. Descriptive and inferential analysis on the basis of groups Figure 1 indicates favorable, unfavorable and neutral responses for each item of the whole scale in percentages. Figure 1. Percentages of favorable, unfavorable and neutral responses of different groups. Total percentage values of some groups are not equal to 100 because of blank or incomplete responses. Error bars were calculated by standard errors of each group. As suggested in Figure 1, the numbers of favorable responses for each group were found to be more than the unfavorable responses. When Figure 1 is examined in terms of gender differences, we can see that favorable responses of female students are more than male students, while unfavorable responses of females are less than males. When the whole AACPS scale is analyzed through the t-test, we see a significantly higher number of average scores in females compared to males (t=3.47, df=546, p=0.001). The t-test conducted on the basis of grade levels, on the other hand, shows that responses of 10th grade students are more expert-like than the 11th graders (t=3.83, df=505, p=0.00). The analysis of school types indicated that the percentages of university students’ expert-like responses are higher than other groups (52%). Percentages of science high school students’ expert-like responses were found as lower than university students (45%), while expert-like responses of vocational high school students were calculated as the lowest value (42%). The ANOVA test was applied in order to examine differences between groups in terms of favorable responses. The ANOVA tests conducted in all types of schools, including universities, indicated significant differences among the groups (F=6.54, df=3, p=0.00). Through the Bonferonni analysis conducted to find out the group differences, a significant statistical difference was found between university and high school students. However, no difference was found among different types of high schools. 42 47 43 45 42 52 45 42 31 30 32 30 32 25 30 34 25 21 23 23 25 23 23 24 0 10 20 30 40 50 60 Male Female Regular Science Vocational University 10th grade 11th garde Average percentage Favorable Unfavorable Neutral
- 10. M. Duran 828 © Author(s), International J. Sci. Env. Ed., 11(5), 819-837 Descriptive analysis for survey items In this section, total values will be analyzed, considering students’ responses for each survey item. Within the analysis, favorable, unfavorable and neutral responses given to each question were assigned with +1, -1 and 0, respectively. Therefore, if the number of a student’s responses assigned with “+1” is higher than ones assigned with “-1”, responses will be regarded as expert-like. Standard scores of groups for each item were obtained by dividing the total number of responses by the number of positive (+), negative (-), and neutral (0) responses. The standard scores given in Table 3 indicate the total average of students’ responses to each question, considering the gender differences. The first value from Table 3 is an example of this situation; if we add 80 positive, 204 negative and 72 neutral responses, we get (= - 124), and then we divide this number by the total number of responses of male students (356), we will get the result as -0.35. Likewise, the positive (+) results show that favorable responses are more than others in number. Table 3 shows average scores of students’ favorable and unfavorable responses for each item, considering the gender differences. According to these results; unfavorable responses of males were more than favorable responses in eight items (01,03,05,11,12,16,23,30), while this number was nine (01,03,05,11,12,17,23,30,31) for female students. On the other hand, both male and female students’ unfavorable responses were more than favorable in seven items. It is also seen that the average favorable responses of female students to 16th item was far more than for males. Female and male students gave more expert-like answers to the 29th item with average scores of 0.74 and 0.47 respectively. Towards the question about homework given as the 20th item, male students’ responses were interestingly neutral, while females’ were rather more favorable. The maximal novice-like attitude and approach of all students were for the 12th item, with average scores of -0.56 and - 0.42 in females’ and males’ groups respectively. Table 4 indicates the average standard scores of high school and university students’ favorable and unfavorable responses. We firstly understand that students’ unfavorable responses to the 5th, 11th, and 12th items in all school types, rather than favorable ones. It means that students of all types of schools gave novice-like answers to these items. While university students mostly adopted novice-like attitude and approaches towards the 11th item, which is among the items having got a negative average value for all types of schools, all students gave similar novice-like answers to the 5th item. Besides, all high-school students gave unfavorable answers to the 16th and 23rd items and responses of university students were more than others in number. To some of the items (7th, 10th, 21st, 27th), university students gave significantly more favorable answers than high-school students. University students gave a higher level of expert-like answers to these items. In addition, they also had a more novice-like approach towards some of the items (1st, 5th, 11th). Table 3. Normalized scores on each item for different gender groups Q.# 1 2 3 4 5 6 7 8 9 10 11 Male -0.35 0 -0.11 0.17 -0.34 0.07 0.47 0.21 0.44 0.47 -0.33 Female -0.51 0.12 -0.33 0.28 -0.45 0.05 0.6 0.37 0.58 0.51 -0.46 Q.# 12 13 14 15 16 17 18 19 20 21 22 Male -0.42 0.21 0.22 0.03 -0.15 0.07 0.06 0.15 0.07 0.39 0.2 Female -0.56 0.31 0.23 0.14 0.18 -0.12 0.06 0.36 0.41 0.63 0.43 Q.# 23 24 25 26 27 28 29 30 31 Male -0.23 0.25 0.41 0.4 0.26 0.41 0.47 -0.06 0 Female -0.29 0.5 0.56 0.51 0.41 0.6 0.74 -0.16 -0.04
- 11. Students’ attitudes and approaches to problem solving in chemistry © Author(s), International J. Sci. Env. Ed., 11(5), 819-837 829 Table 4. Normalized scores on each item for different school types # 1 2 3 4 5 6 7 8 9 10 11 Regular -0.59 0.01 -0.31 0.21 -0.41 0.08 0.47 0.26 0.49 0.5 -0.43 Science 0.01 0.03 0.11 0.21 -0.37 0.12 0.55 0.41 0.45 0.51 -0.41 Vocational -0.53 0.08 -0.51 0.06 -0.35 -0.01 0.45 0.1 0.45 0.39 -0.3 University -0.79 0.15 0.29 0.51 -0.41 0.16 0.82 0.31 0.68 0.69 -0.47 # 12 13 14 15 16 17 18 19 20 21 22 Regular -0.56 0.42 0.3 0.11 -0.07 0 0.1 0.25 0.18 0.43 0.28 Science -0.47 0.1 0.1 -0.13 -0.03 -0.04 -0.01 0.09 0.12 0.6 0.25 Vocational -0.38 0.23 0.22 0.14 -0.11 0.04 0.07 0.3 0.24 0.34 0.31 University -0.49 0.08 0.33 0.26 0.26 0.21 0.1 0.44 0.32 0.76 0.31 # 23 24 25 26 27 28 29 30 31 Regular -0.44 0.27 0.42 0.39 0.28 0.52 0.53 -0.13 -0.01 Science -0.15 0.33 0.48 0.44 0.35 0.52 0.6 0.07 -0.09 Vocational -0.22 0.35 0.49 0.46 0.26 0.3 0.49 -0.22 0.06 University 0.1 0.49 0.69 0.51 0.69 0.64 0.82 -0.05 0 It is understood that the most favorable responses of university students were given to the 7th and 21st items. The most unfavorable responses, on the other hand, were given to the 1st and 11th items. As for high school students, the most favorable score averages were from the 7th, 9th, 10th, 25th and 29th items, and the most unfavorable were from the 5th, 11th and 12th. The data obtained through the AACPS data collection tool was analyzed under three categories as 10th grade, 11th grade, and university-level in order to perform a class-based analysis. As high school and university students have already been compared in Table 4, Table 5 does not include university students, and just analyzes 10th and 11th grades of high schools. When the results given in Table 5 are examined, we see that standard score averages of high school students usually have similar characteristics, despite certain differences in some of the items. As can be inferred from Table 5, the responses of 11th grade students to the 2nd, 6th, 17th and 31st items are mostly unfavorable, while responses of 10th grade students are predominantly favorable. In addition, the favorable responses of the 11th grade students to the 8th item are slightly more than their neutral responses. According to Table 5, the standard item scores of students of both grades are negative, as they gave unfavorable answers to the 1st, 3rd, 5th, 11th, 12th, 23rd and 30th items more than favorable ones. The 10th and 11th grade students obtained maximum standard scores from their more expert-like responses to the 7th, 9th, and 26th items. Table 5. Normalized scores on each item for different grade levels # 1 2 3 4 5 6 7 8 9 10 11 10th grade -0.3 0.06 -0.18 0.24 -0.37 0.1 0.53 0.25 0.49 0.57 -0.4 11th grade -0.48 -0.02 -0.25 0.11 -0.4 -0.01 0.46 0.31 0.46 0.37 -0.35 # 12 13 14 15 16 17 18 19 20 21 22 10th grade -0.44 0.31 0.25 0.06 -0.13 0.03 0.09 0.19 0.23 0.57 0.35 11th grade -0.5 0.21 0.18 0.03 0.01 -0.07 0.01 0.22 0.11 0.32 0.18 # 23 24 25 26 27 28 29 30 31 10th grade -0.31 0.35 0.48 0.45 0.35 0.55 0.57 -0.04 0.04 11th grade -0.26 0.3 0.39 0.42 0.2 0.36 0.51 -0.17 -0.09
- 12. M. Duran 830 © Author(s), International J. Sci. Env. Ed., 11(5), 819-837 Analysis on the basis of inferential statistics A chi-square independence test was applied in order to find statistically significant differences between groups. The reason for applying the chi-square test is to reveal statistical differences between obtained and expected datasets in one or more than one category. It is also used to understand whether the variance between observed and expected values is random or real. Participants were grouped by gender, school type, and grade, in addition to the classification according to the percentages they had in favorable, unfavorable and neutral responses given to 31 questions of the AACPS scale. Table 6 shows items with statistically significant differences in terms of favorable and unfavorable response frequencies of female and male students, obtained through the chi-square test. No statistically significant difference was recorded between response averages of female and male students except for the 13 items (42%). Between gender groups, significant statistical differences were found in 13 of the 31 items given in the AACPS scale, as can be seen in Table 6. As the results were based on favorable and unfavorable responses, neutral responses were not included in Table 6. While male students are significantly more expert-like in the 8th, 19th, 21st, 22nd, 24th, 26th, 28th, and 29th items, females had rather expert-like attitudes to all items except for the 3rd, 12th and 17th. The most expert-like answers of male students were given to the 29th item and this figure is equal to 63% in percentage terms. They also demonstrated expert-like attitude and approaches towards the 26th and 28th items with 58%. On the other hand, female students gave more expert-like answers to the 29th item (81.1%) more than the males did. They mostly adopted expert-like attitudes and approaches towards the 21st and 28th items, with 72% and 70% respectively. Table 6. Percentages of male and female students’ attitudes and approaches to problem solving Item Male Female Chi square Favorable % Unfavorable % Favorable % Unfavorable % χ2 df N p 3 35.20 46.20 27.00 60.30 9.98 2 544 0.007 8 49.00 28.20 61.10 24.20 8.14 2 545 0.017 12 15.60 57.70 14.10 69.70 8.83 2 537 0.012 16 31.00 45.90 49.20 31.40 18.23 2 546 0 17 40.10 32.80 31.40 43.20 6.31 2 539 0.043 19 44.40 29.10 57.40 21.90 8.07 2 534 0.018 20 40.70 33.60 61.10 20.00 20.61 2 536 0 21 57.50 18.50 72.30 9.80 12.11 2 535 0.002 22 45.70 25.70 58.50 15.30 10.03 2 533 0.007 24 50.10 25.40 67.20 17.20 14.41 2 537 0.001 26 58.00 17.90 68.80 17.70 9.15 2 538 0.010 28 58.60 18.10 69.90 10.20 8.04 2 539 0.018 29 63.30 16.40 81.10 7.60 18.31 2 539 0
- 13. Students’ attitudes and approaches to problem solving in chemistry © Author(s), International J. Sci. Env. Ed., 11(5), 819-837 831 Table 7. Percentages of school type students’ attitudes and approaches to problem solving Item Regular Science Vocational Undergraduate Chi square Fav. % Unfav. % Fav. % Unfav. % Fav. % Unfav. % Fav. % Unfav. % χ2 df N p 1 13.20 72.50 38.70 37.40 15.00 68.00 2.60 82.10 64.82 6 528 0 3 26.40 57.70 45.50 34.40 17.00 68.00 57.90 28.90 53.12 6 527 0 5 24.00 65.40 25.80 62.90 20.00 54.70 23.10 64.10 17.1 6 519 0.01 13 60.10 18.00 37.00 26.60 49.00 26.10 38.50 30.80 21.33 6 529 0 15 41.80 31.00 31.60 44.50 40.50 26.80 51.30 25.60 15.42 6 531 0.02 19 50.80 26.00 44.30 34.90 50.00 19.70 56.40 12.80 14.25 6 517 0.03 21 59.70 16.60 71.80 12.10 55.00 20.50 78.40 2.70 15.94 6 518 0.01 23 18.80 62.40 34.70 50.00 26.50 48.30 46.20 35.90 22.71 6 521 0 28 65.70 13.30 66.20 14.60 51.00 20.50 74.40 10.30 12.77 6 522 0.05 30 29.80 43.10 43.00 35.80 25.00 46.70 30.80 35.90 13.38 6 523 0.04 Table 7 indicates the items with significantly different chi-square test statistics and frequencies of high-school and university students, considering the school type. We can see that 10 out of the 31 AACPS scale items were found to be significantly different according to school types. The percentage of unfavorable responses to the 5th item was statistically found to be more than favorable ones. On the other hand, expert-like responses to the 21st and 28th items were determined as more than novice-like responses in percentage. According to the analysis of the responses of students from different grades, items with significant differences are given in Table 8. The only significant difference between the 10th and 11th grades in this sense is in the 5th item. The percentage of unfavorable responses to the 1st item was found as high for both grades. Responses of both grades to the 2nd item are mostly neutral. Responses to other items (10th, 21st and 28th) were found to be rather expert-like. Comparison of the results obtained through physics and chemistry tests This section examines the data obtained through the physics version of the same AACPS scale applied to the same group. Table 9 shows the descriptive statistics related to the chemistry scale (AACPS) and the physics scale (AAPS). As can be seen in Table 9, the total number of students having responded to the Chemistry (AACPS) and Physics AAPS scales are 552 and 528 respectively. The numbers are different as the scales were applied on different days and some of the students did not attend one of these applications. It was determined that, students adopted more expert-like attitude and approaches towards physics problems, when compared to chemistry. The maximum scores that could be obtained from the attitude and approach scale were 155 for chemistry and 165 for physics (five points for each favorable response). The average scores of students were found as 86.61 in attitude points towards chemistry problems and 96.82 towards physics problems. It can be inferred from this data that the chemistry and physics attitude scores are approximate and both are at a medium level. The variance between chemistry and physics attitude scores were found through the t-test analysis (Table 10). Table 8. Percentages grade levels of students’ attitudes and approaches to problem solving Item Grade 10 Grade 11 Chi square favorable % unfavorable % favorable % unfavorable % χ2 df N p 1 25.4 55.0 16.0 64.4 7.04 2 505 .030 2 36.3 30.2 36.7 38.9 6.31 2 504 .043 10 67.4 10.9 53.2 16.2 10.52 2 498 .005 21 65.9 9.2 57.0 24.7 22.27 2 496 .000 28 67.6 12.4 54.7 18.8 8.95 2 498 .011
- 14. M. Duran 832 © Author(s), International J. Sci. Env. Ed., 11(5), 819-837 Table 9. Comparison of the same students’ attitude and approaches according to Physics AAPS and Chemistry AACPS results Groups N Mean Std. Deviation Std. Error Mean Chemistry 552 86.61 11.66791 .49662 Physics 528 96.82 12.94751 .56347 Table 10. Results of t-test analysis on physics and chemistry scores Levene’s Test for Equality of Variances t-test for Equality of Means F Sig. t df Sig. (2-tailed) Mean Difference Scores Equal variances assumed 1.087 0.297 -13.627 1078 0 -10.21 Equal variances not assumed -13.596 1054.92 0 -10.21 It is understood from Table 10 that score variances of groups are equal to each other (F=1.09 and p=.297). When we examine the responses of students, we can see that their attitudes towards physics problems are significantly more than for chemistry (t(1078)=13.63 and p=.000). The variances between chemistry and physics attitude scores were also analyzed trough chi-square test on item bases. Table 11 indicates the items with significant variances in attitude and approaches towards physics and chemistry problems. According to Table 11, statistically significant variances were found in 16 out of the 31 items given in the AAPS Physics and AACPS Chemistry scales. We can see certain differences and similarities between the responses to questions about problem solving in both chemistry and physics subjects when we examine the percentages of favorable and unfavorable answers. Favorable responses (69%) of students were seen in the same items of both the physics and chemistry scales (2nd, 4th, 6th, 8th, 9th, 10th, 13th, 15th, 17th, 18th, and 22nd), except for the 31st item. While favorable responses to the 31st item are approximate to unfavorable ones in chemistry, favorable responses were seen more in the physics scale. The most different expert-like response was given to the 10th item in both physics and chemistry scales (nearly 62%). Reponses of both groups to the 12th item was rather novice-like and the percentages were 72.3% for physics and 62% for chemistry, respectively. Table 11. Percentages of items with significant variances in physics and chemistry Item Chemistry Physics Chi square favorable % unfavorabl e % favorable % unfavorabl e % χ2 df N p 2 37.4 33.3 50.2 30.7 20.79 2 1040 .000 3 32.4 51.0 24.2 63.2 15.83 2 1042 .000 4 45.2 24.3 53.0 24.1 8.68 2 1011 .013 6 35.6 29.4 45.2 29.9 14.33 2 1017 .001 8 53.2 26.5 49.1 33.7 6.67 2 1030 .036 9 61.4 11.8 58.1 19.8 19.99 2 1012 .000 10 61.9 12.4 62.7 18.5 11.53 2 999 .003 11 18.2 56.8 19.0 64.1 10.20 2 1023 .006 12 14.8 62.2 13.0 72.3 13.60 2 1034 .001 13 48.8 23.4 54.8 25.1 8.09 2 1018 .018 15 39.5 33.0 55.2 26.6 26.20 2 1016 .000 17 37.1 36.3 54.2 29.0 31.18 2 1001 .000 18 41.4 35.5 51.7 29.6 10.70 2 1013 .005 22 50.4 22.2 59.3 20.7 9.45 2 995 .009 30 32 41.6 27.6 53.7 16.12 2 1008 .000 31 35.2 36.1 44.9 32.8 10.60 2 1000 .005
- 15. Students’ attitudes and approaches to problem solving in chemistry © Author(s), International J. Sci. Env. Ed., 11(5), 819-837 833 DISCUSSION The data obtained through the AACPS (chemistry) measurement tool was analyzed by classifying students according to gender, school type, grade, high school-university, and chemistry-physics divisions, in an order as presented in the survey questions. The physics version of the AACPS scale (AAPS) was simultaneously conducted in the sample group of this study by Balta, Mason, and Singh (2016), and the results of the chemistry version were compared with the results relevant to attitudes and approaches towards problem solving in physics. As the reliability coefficients of the first application used in a comprehensive group of physics students in the United States (α=0.82) (Mason, & Singh, 2010) and the chemistry (α=0.81) and physics versions applied in Turkey (α=0.85) are of high values, we understand that the scale was confirmed as relevant to its purposes and proved its external validity. Moreover, the high reliability values (DeVellis, 2003) obtained from physics and chemistry survey applications indicate that using this scale in another discipline may contribute to science teaching. Gender When the AACPS scale is examined according to the gender variable, the average scores of females seem rather higher than for the males. There is also an interesting fact about the responses of the genders in that favorable responses of both male and female students were high in nine out of the 13 items which include statistically significant differences, besides the scores of females which were relatively higher than males. One possible reasons for this situation is that female students are generally better at class attendance, note-taking and in-class attention more than males. Favorable and unfavorable responses of both female and male students to the 6th and 18th items that are approximate to each other, and which therefore mean the responses are ‘neutral’ were “In solving problems in chemistry, I can often tell when my work and/or answer is wrong, even without looking at the answer in the back of the book or talking to someone else about it” and “I usually draw pictures and/or diagrams even if there is no partial credit for drawing them”. In addition, favorable and unfavorable responses of the two groups to the items about the accuracy of processes and achieving the result by drawing pictures and graphs were also approximate to one another, or neutral. On the other hand, male students’ answers were interestingly neutral, while female students’ answers were favorable to the 20th item that states “After I solve each chemistry homework problem, I take the time to reflect and learn from the problem solution”. Favorable responses of females were far more than males in the 16th item which states “When answering conceptual chemistry questions, I mostly use my ‘gut’ feeling rather than using the chemistry principles, I usually think about when solving quantitative problems”. It is a significant fact that female students act in a logical way rather than using intuition to achieve the result in conceptual problems and give more expert-like answers. The most expert-like answers of females and males were to the 29th item, “If I realize that my answer to a chemistry problem is not reasonable, I trace back my solution to see where I went wrong”, with average scores of 0.74 and 0.47 respectively. Grade level As for the grade levels, the 10th grade students interestingly responded to the questions in a more favorable way than did the 11th grade students. It may be a result of the fact that there was a significant number of vocational high school
- 16. M. Duran 834 © Author(s), International J. Sci. Env. Ed., 11(5), 819-837 students among the 11th grade students and that they may have adopted a novice- like attitude and approach towards the questions simply because they may not have taken the elective 11th grade chemistry course. The majority of students from both grade levels responded to the 7th item, “To be able to use an equation to solve a problem (particularly in a problem that I haven’t seen before), I think matches the problem situation”, with a more expert-like attitude. Likewise, they showed more expert-like attitude and approach to the 9th item which stated “I use a similar approach to solving all problems involving balancing redox reactions even if the chemical situations given in the problems are very different”. School type Responses of university students to the AACPS scale were determined as more expert-like than high school students. The possible reasons for this may be that having already attained a place at university, the university students simply had more experience in chemistry; they will have learned the basic chemistry courses again at university and have been more familiar with problem-solving methods. Moreover, university students’ attitudes and approaches were more expert-like as they had already solved many of the problems, including difficult ones or were able to organize their knowledge about problem solving and already known how to apply that knowledge. On the other hand, university students were more novice-like towards the 1st, 5th and 11th items. Their response to the 1st item, “If I’m not sure about the right way to start a problem, I’m stuck unless I go see the teacher/TA or someone else for help”, was rather unfavorable. That is an interesting fact in terms of grade level variance. Students of regular and vocational high schools also showed novice-like attitudes to this item, while students of science high schools were relatively more expert-like. This can be explained by through the weaker academic backgrounds of students studying at the other two types of high schools. Many of the participant university students having studied at regular and vocational high schools contributed to this result. They had a novice-like attitude towards the 5th item which stated “‘Problem solving’ in chemistry basically means matching problems with the correct equations and then substituting values to get a number”. This result indicates that university students can use the equations they have already known in order to solve the problems together with the rules of chemistry. Their response to the 11th item, “Equations are not things that one needs to understand in an intuitive sense; I routinely use equations to calculate numerical answers even if they are non- intuitive”, reflects another reason for the novice-like attitudes. Further analysis would be expected to deal with the reasons for this attitude and approach, as the main objective of this study has not been to explain this kind of situation. It is also seen that the most favorable responses of university students were for the 7th item, “To be able to use an equation to solve a problem (particularly in a problem that I haven’t seen before), I think matches the problem situation” and the 27th item, “I enjoy solving chemistry problems even though it can be challenging at times”, where the university students demonstrated more expert-like attitude and approaches compared to others. It can also be said that challenging questions have an effect on the attitudes of university students. Science high-schools recorded the most expert-like attitude and approaches, followed by regular, and vocational high schools, respectively. This result is compatible with expectations as it is known that although the curriculum is same with other types of high schools, the course hours show differences in science high- schools. For instance, chemistry courses may be up to 7 hours in the 10th and 11th grades of science high schools, whereas it is three hours in regular high schools, and two or three hours in vocational high schools. As the students of science high
- 17. Students’ attitudes and approaches to problem solving in chemistry © Author(s), International J. Sci. Env. Ed., 11(5), 819-837 835 schools achieved higher scores in the transition exam and their focus is on studying physics and chemistry-based majors of universities such as medicine and engineering, they were able to solve more questions, even the most challenging. Relatively more novice-like attitude and approaches of vocational high school students may be correlated with their performances within the transition examination from primary to secondary education. As the thought of preparing for university entrance exams with high performance is of secondary importance for vocational high school students and they mainly focus on their choice of profession just after graduation, responses of these students were mostly novice-like towards solving chemistry problems. Chemistry and physics When the attitudes and approaches towards solving physics and chemistry problems are compared, the responses of physics students are found to be more favorable than for chemistry. The most expert-like answers were given to the 2nd, 15th, 17th and 18th items by physics students. In the 2nd item, students stated that they could not make approximations about the chemical world. This result coincides with findings stated in the literature. This may be because chemistry has more abstract concepts and students have difficulties in correlating their daily lives to chemistry concepts. Contrary to this fact, this correlation is more achievable in physics; for example, between the force concept and the moving objects (Hand & Treagust, 1991). Chemistry students were more novice-like than the physics students in their responses to the 15th and 17th items such as “When solving chemistry problems, I often find it useful to first draw a picture or a diagram of the situations described in the problems” and “I am equally likely to draw pictures and/or diagrams when answering a multiple-choice question or a corresponding free-response essay question”, in addition to the response “I usually draw pictures and/or diagrams even if there is no partial credit for drawing them”. This result may indicate that students can correlate a problem in physics with real life or transform abstract concepts into concrete examples by creating pictures and/or diagrams while they do not prefer this method in chemistry. Students’ course books and additional resources can be the best examples for this situation as the physics problems mostly contain figures and graphs in these resources, while chemistry problems are created through conceptual expressions. Duran and Balta (2014) state that students can solve science problems with figures and graphs more easily when compared to those without such content types. We see similar results for favorable and unfavorable responses of students given to each item with statistically significant differences, when we compare physics AAPS and chemistry AAPCS scale tests. However, responses to the 31st item show different results. While students who responded to the chemistry scale were found as more novice-like, just as those who answered the physics scale were rather more expert-like. Students adopted expert-like attitudes towards this item with the response, “While solving a physics problem with a numerical answer, I prefer to solve the problem symbolically first and only plug in the numbers at the very end”. The reason can be explained as follows: As physics teachers explain the subject and the problem-solving methods with symbols first and then later replace these symbols with mathematical expressions in physics equations, students get used to solving problems by creating symbols and replacing them with the required values within the formula. As the teachers give the formulas directly to students in chemistry rather than creating them, on the other hand, they try to achieve the result by replacing the symbols with numbers within the formulas they have memorized. Chemistry teachers should change their strategy of problem solving that requires students to only memorize the formula and replace the symbols with the
- 18. M. Duran 836 © Author(s), International J. Sci. Env. Ed., 11(5), 819-837 values. First of all, the formulas should be created, the symbols should be explained and at last of all, the problem should be solved by writing mathematical values. REFERENCES Ayyildiz, Y. (2012). Effect of Case Studies on Primary School Teaching Students’ attitudes Toward Chemistry Lesson. Hacettepe Üniversitesi Eğitim Fakültesi Dergisi, 43(43), 62- 70. Balta, N., Mason, A., & Singh, C. (2016). Surveying Turkish high school and university students’ attitudes and approaches to physics problem solving. Physical Review Special Topics - Physics Education, 12(010129). Barr, B. B. (1994). Research on problem solving: elementary school. In D. L. Gabel (Ed.), Handbook of research on science teaching and learning (pp. 237-247). New York: McMillan. Benner, P. (1984). From novice to expert: Excellence and power in clinical nursing practice. Menlo Park, CA, Addison-Wesley Publishing. Camacho, M., & Good R. (1989). Problem-solving and chemical equilibrium: successful versus unsuccessful performance. Journal of Research in Science Teaching, 26, 251-272. Chi, M. T. H., Feltovich, P. J., & Glaser, R. (1981). Categorization and representation of physics problems by experts and novices. Cognitive Science, 5, 121-152. Collins, A., Brown, J. S., & Newman, S. E. (1989). Cognitive apprenticeship: Teaching the crafts of reading, writing, and mathematics. Knowing, learning, and instruction: Essays in honor of Robert Glaser, 18, 32-42. Cummings, K., Lockwood, S., & Marx, J. D. (2004). Attitudes toward problem solving as predictors of student success. In proceedings from 2003 Physics Education Research Conference: 2003 Physics Education Conference, (Vol. 720, No. 1, pp. 133-136). AIP Publishing. DeVellis, R. F. (2003). Scale development: Theory and applications (2nd ed.). Newbury Park: Sage Publications. Dreyfus S. E., & Dreyfus H. L. (1980). A five stage model of the mental activities involved in directed skill acquisition. California University Berkeley Operations Research Center [Online]. Available from http://www.dtic.mil/cgibin/GetTRDoc?AD= ADA084551&Location=U2&doc=GetTRDoc.pdf Duran, M., & Balta, N. (2014). The Influence of Figured and Non-Figured Questions on Secondary Students’ success at Science Exams. Pakistan Journal of Statistics, 30(6), 1279-1288. Elio, R., & Scharf, P. B. (1990). Modeling Novice-to-Expert Shifts in Problem-Solving Strategy and Knowledge Organisation. Cognitive Science, 14(4), 579-639 Gabel, D. L., Samuel, K. V., & Hunn, D. (1987). Understanding the particulate nature of matter. Journal of Chemical Education, 64(8), 695-697. Gray, K. E., Adams, W. K., Wieman, C. E., & Perkins, K. K. (2008). Students know what physicists believe, but they don’t agree: A study using the CLASS survey. Physical Review Special Topics - Physics Education Research, 4(2), 020106. Hand B., & Treagust D. F., (1991), Student achievement and science curriculum development using a constructivist framework. School Science and Mathematics, 91(4), 172-176. Heyworth, R. M. (1999). Procedural and conceptual knowledge of expert and novice students for the solving of a basic problem in chemistry. International Journal of Science Education, 21,195-211 Hofstein, A., Ben-Zvi, R., & Samuel, D. (1976). The measurement of the interest in and attitudes to, laboratory work amongst Israeli high school chemistry students. Science Education, 60(3), 401-411. Kumar. D. D. (1993). Assessment of expert-novice chemistry problem-solving using hypercard: Early findings. Journal of Science Education Technology, 2, 481-485. Larkin, J. H., & Rainard, B. (1984). A research methodology for studying how people think. Journal of Research in Science Teaching, 21, 235-254. Lavoie, D. R. (1993). The development, theory, and application of a cognitive‐network model of prediction problem solving in biology. Journal of Research in Science Teaching, 30(7), 767-785.
- 19. Students’ attitudes and approaches to problem solving in chemistry © Author(s), International J. Sci. Env. Ed., 11(5), 819-837 837 Marx, J., & Cummings, K. (2007). What factors really influence shifts in students’ attitudes and expectations in an introductory physics course? In proceedings of 2006 Physics Education Research Conference (Vol. 883, No. 1, pp. 101-104). AIP Publishing. Mason, A., & Singh, C. (2010). Surveying graduate students’ attitudes and approaches to problem solving. Physical Review Special Topics - Physics Education Research, 6(2), 020124, 13-34. Ramsden, J. M. (1998). Mission impossible? Can anything be done about attitudes to science? International Journal of Science Education, 20, 125-137. Redish, E. F., Saul, J. M., & Steinberg, R. N. (1998). Student expectations in introductory physics. American Journal of Physics, 66(3), 212-224. Schoenfeld, A. (1985). Mathematical Problem Solving. New York: Academic Press. Schoenfeld, A. (1989). Teaching mathematical thinking and problem solving. In L. B. Resnick & B. L. Klopfer (Eds.), Toward the Thinking Curriculum: Current Cognitive Research (pp. 83-103). Washington, DC: ASCD. Schoenfeld, A. (1992). Learning To Think Mathematically: Problem Solving, Metacognition, And Sense-Making In Mathematics. In D. Grouws (Ed.), Handbook for Research on Mathematics Teaching and Learning ( Chap. 15, pp. 334-370). New York: McMillan. Scudder P. H. (1997). Database vs. expert system teaching paradigms: using organic reaction mechanisms to teach chemical intuition. Journal of Chemical Education, 74(7), 777. Simpson, R. D., & Wasik, J. L. (1978). Correlation of selected affective behaviors with cognitive performance in a biology course for elementary teachers. Journal of Research in Science Teaching, 15(1), 65-71. Smith, M. U., & Good, R. (1984). Problem-solving and classical genetics: successful versus unsuccessful performance. Journal of Research in Science Teaching, 21, 895-912. Soyibo, K. (1985). A comparison of selected Lagos students’ attitudes to and performance on a biology test.. In F. Obanya & O. Odubunmi (Eds.), Education in Lagos State. An Overview: Selected Papers from a Conference on Education Development in Lagos State (pp. 335-351). Lagos. Taber, K. S., (2001), Building structural concepts of chemistry: some considerations from educational research. Chemistry Education Research and Practice, 2, 123-158. Tamir, P., Arzi, A., & Zloto, D. (1974). Attitudes of Israeli high school students towards physics. Science Education, 58(1), 75-86. TTP. (2007). Ortaöğretim 9. Sınıf Kimya Dersi Öğretim Programı. Talim ve Terbiye Kurulu Başkanlığı. Ankara, T.C. Milli Eğitim Bakanlığı. Wilson, V. L. (1983). A Metal-Analysis of the Relationship Between Science and Achievement and Science Attitude: Kindergarten Through College. Journal of Research in Science Teaching, 20(9), 839-885.