Download as PDF, PPTX

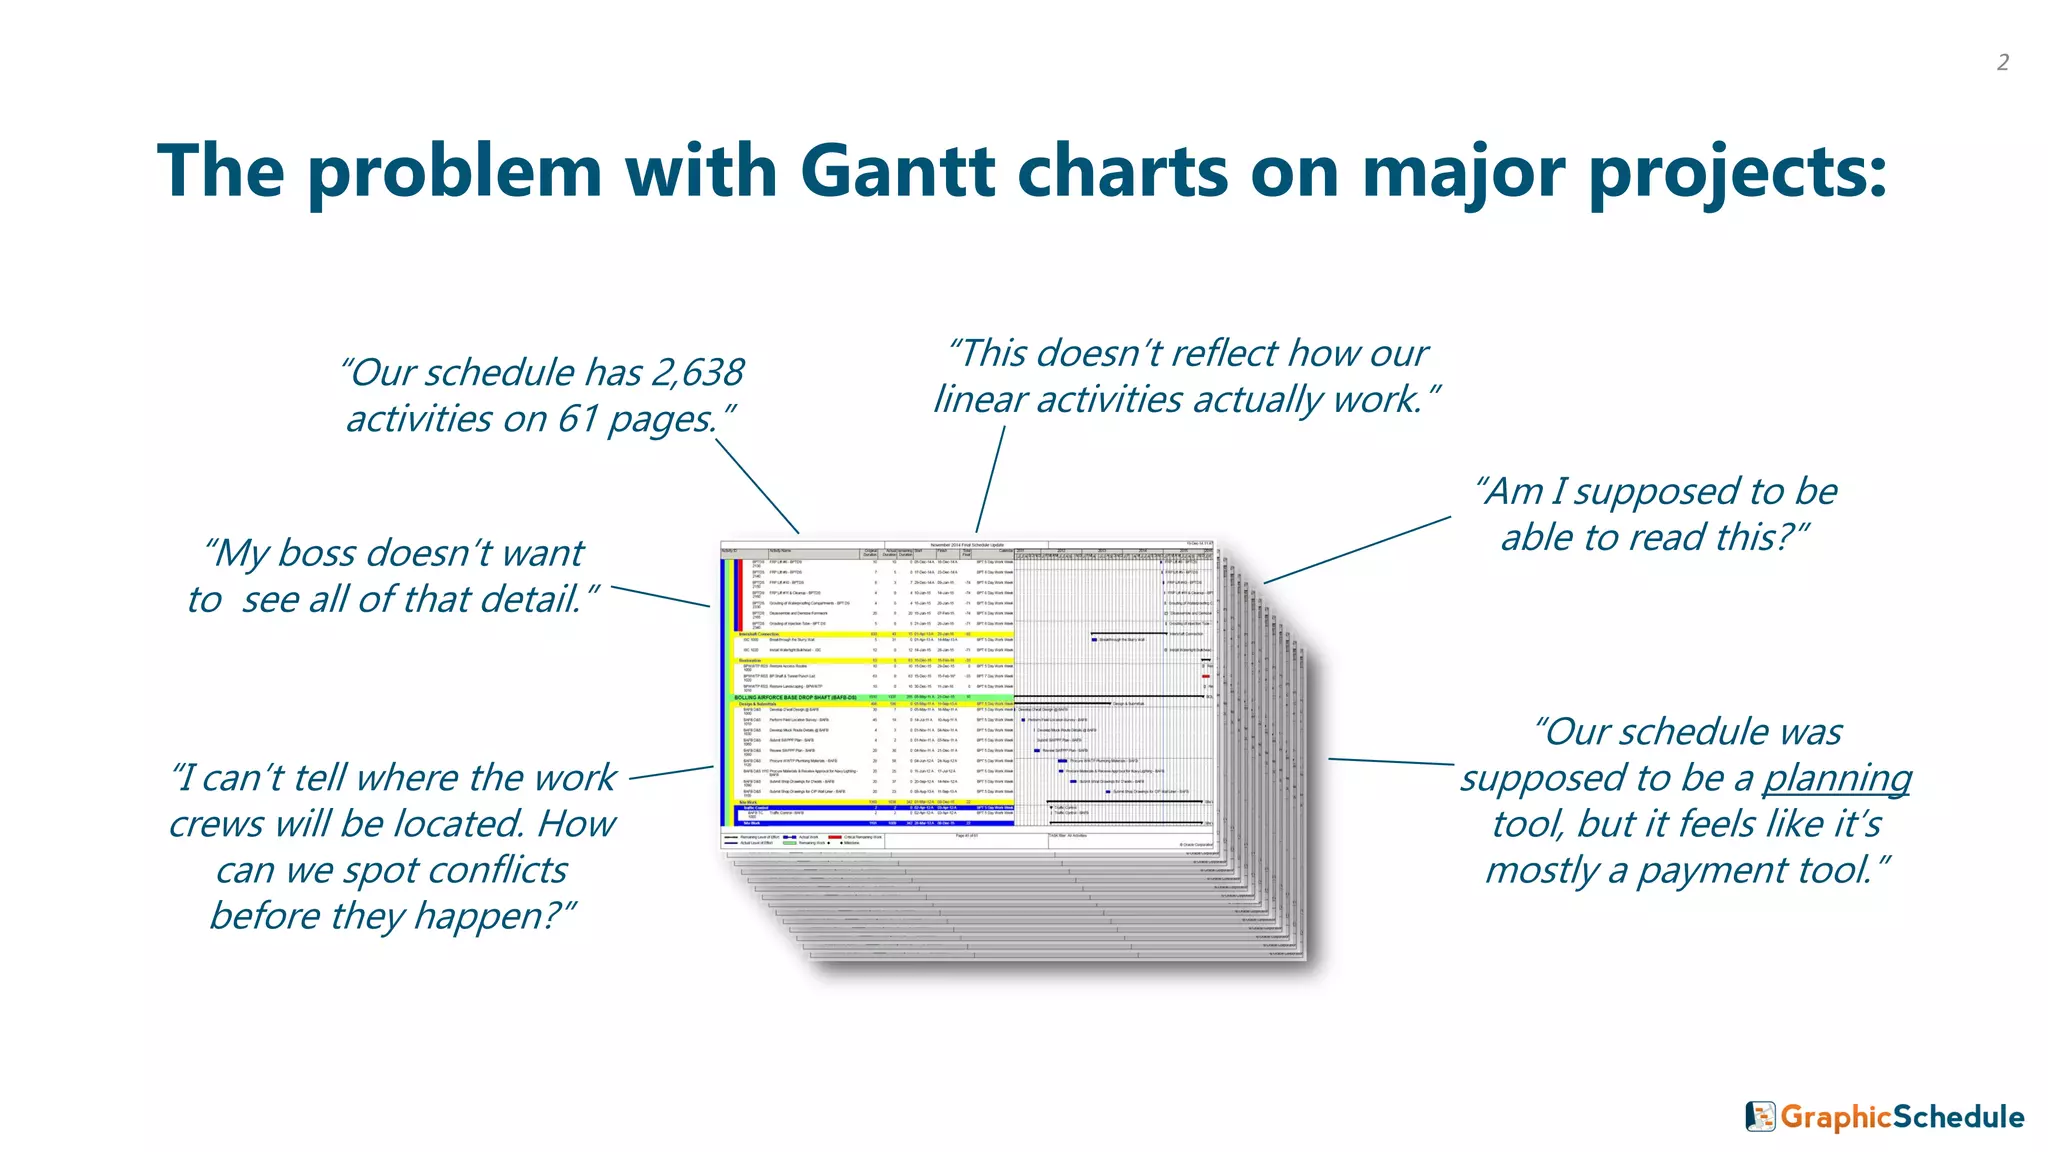


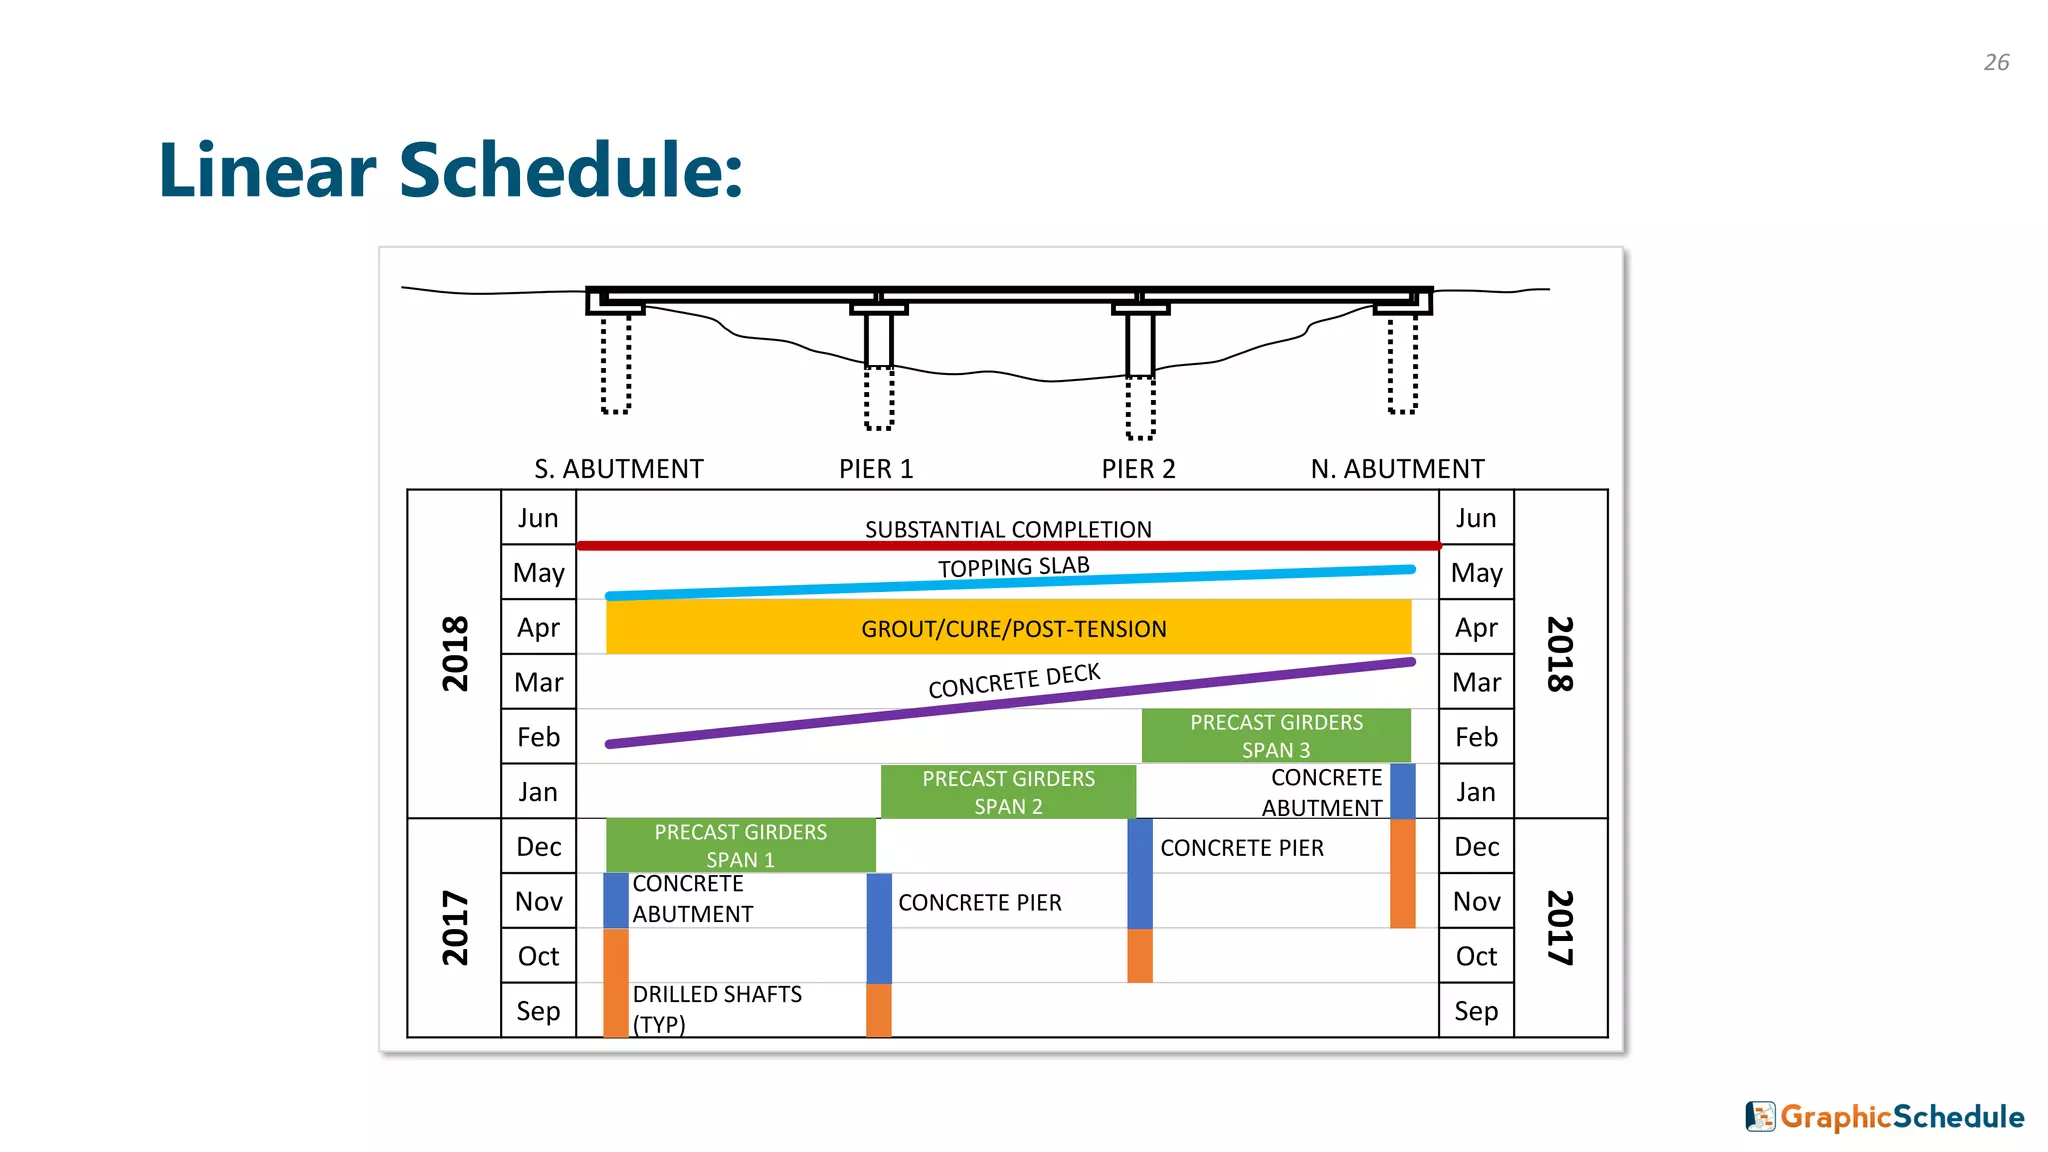
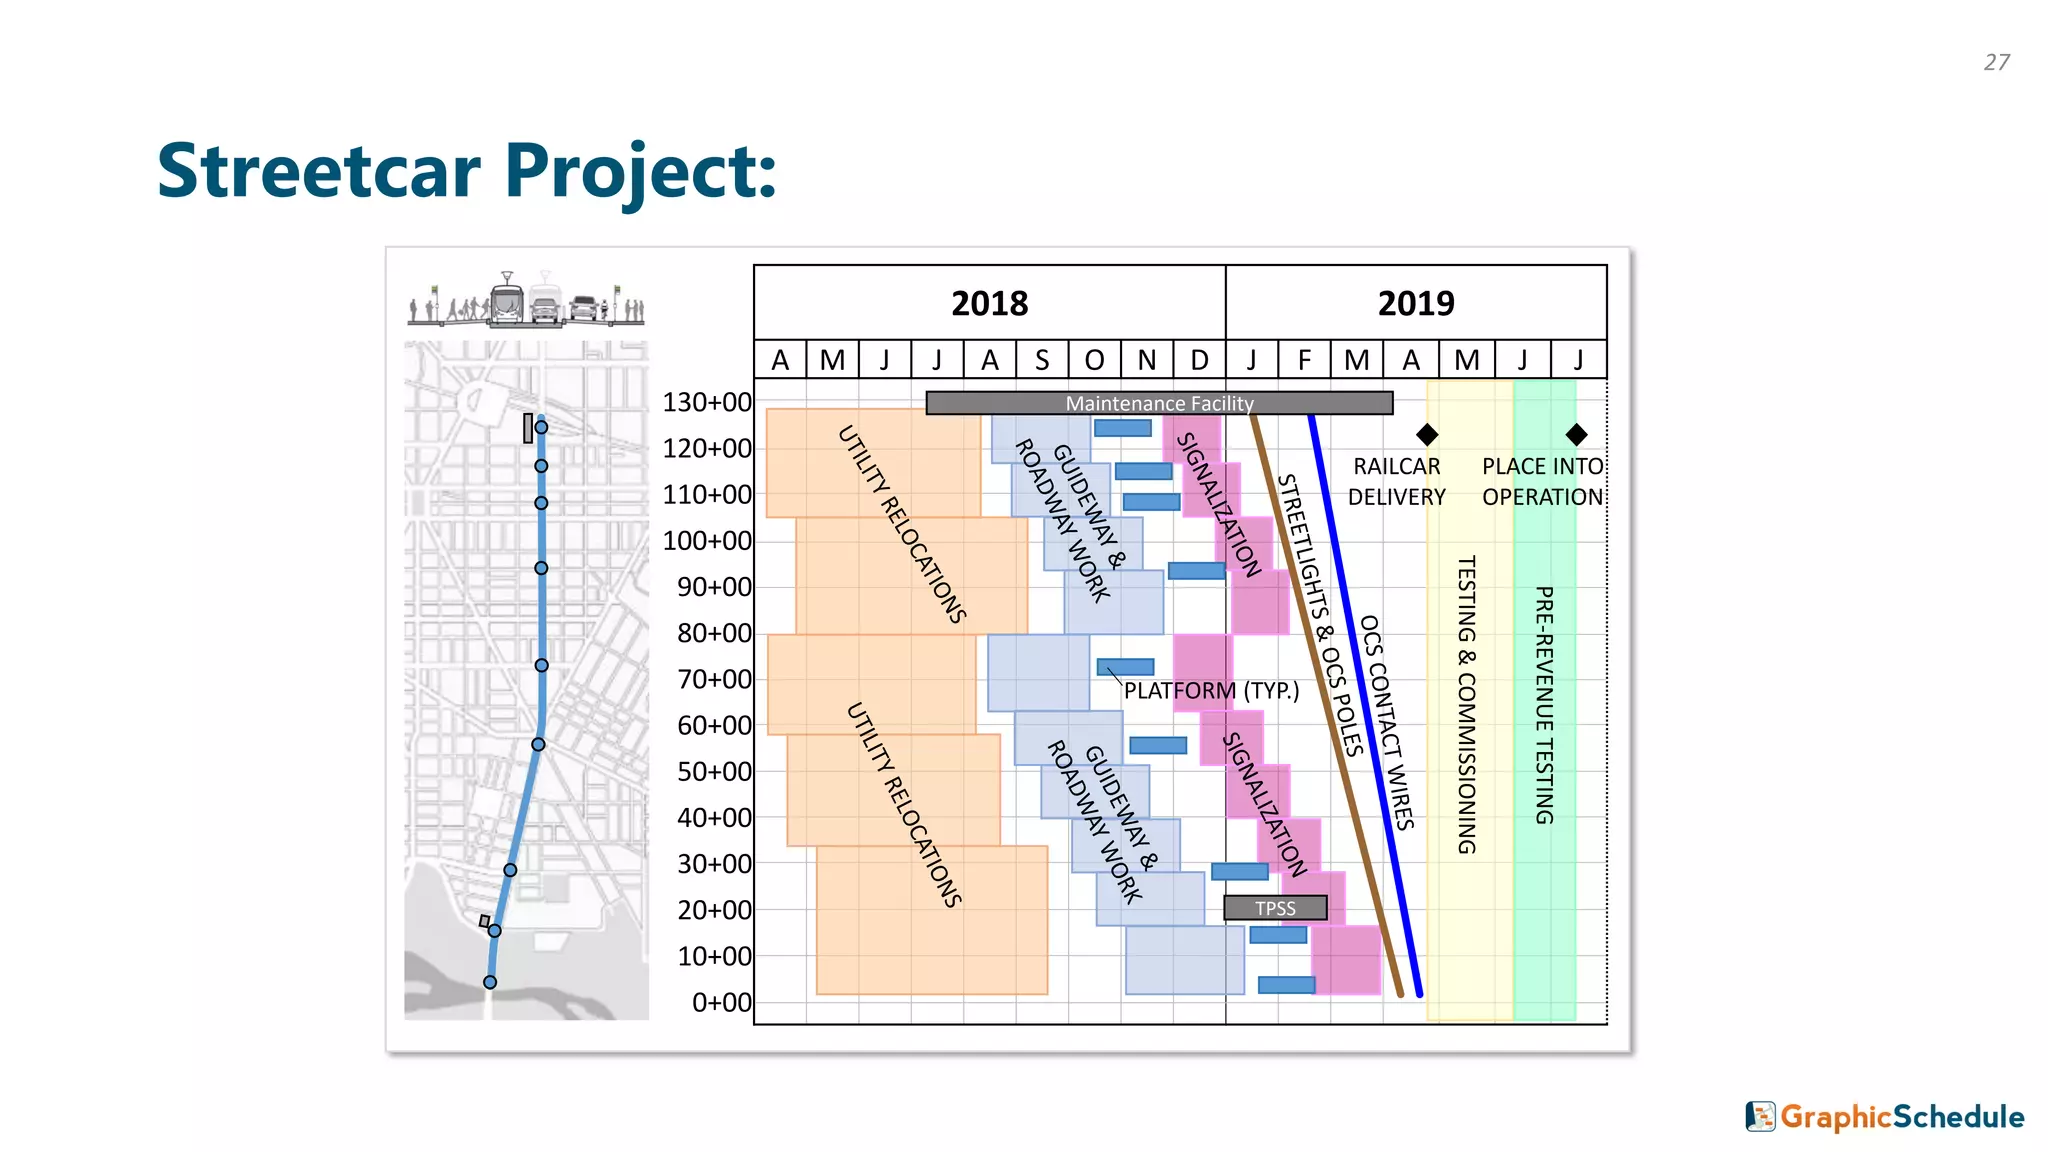


This document serves as a guide for construction managers on how to effectively use linear scheduling as a project management tool, highlighting the limitations of traditional Gantt charts. The authors emphasize the need for concise, visually appealing schedules on a single page to enhance understanding and communication among project teams. It includes examples and industry insights to illustrate the advantages of linear scheduling in managing complex construction projects.


