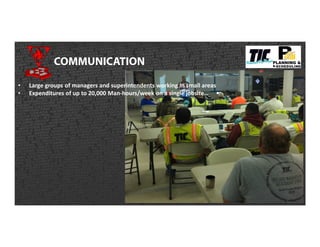
- Introduce Speakers and provide history and challenges of industrial construction and TIC.
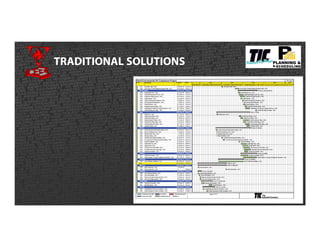
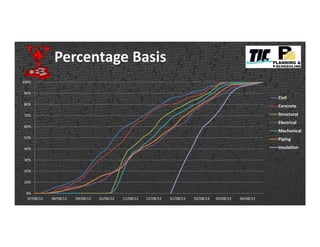
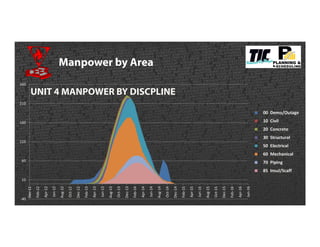
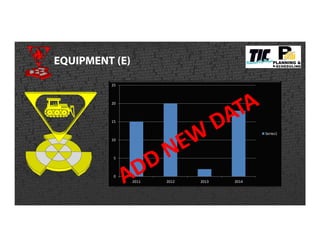
- Traditional planning used time-scaled resource analysis while 4D uses workspace efficiency and spatial resource analysis.
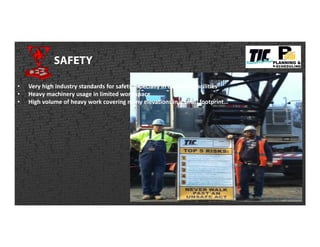
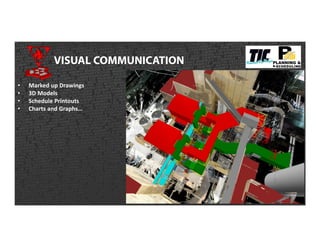
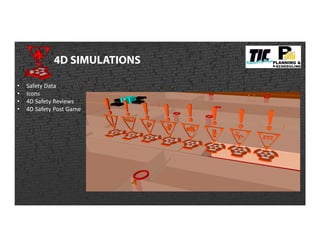
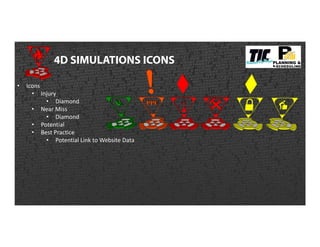
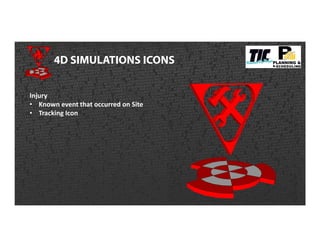
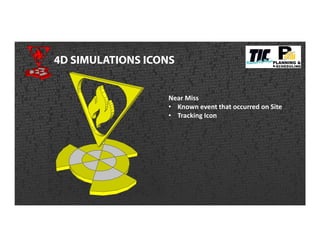
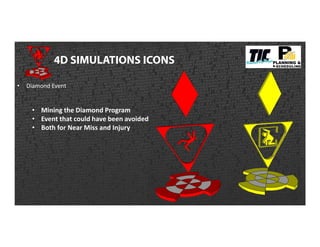
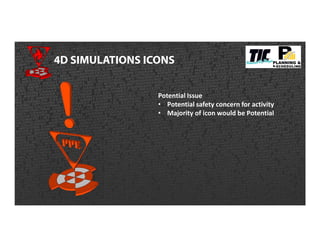
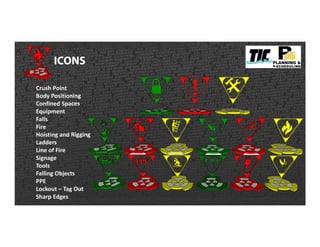
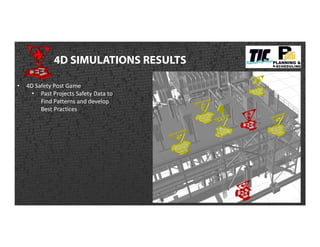
- 4D safety planning analyzes data, identifies benefits, and focuses on simulations with icons, reviews, and results to improve safety.
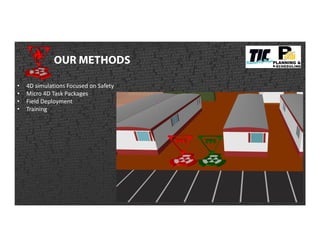
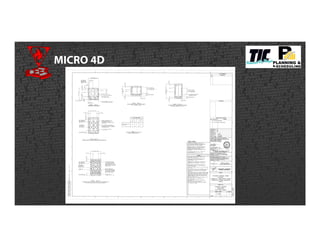
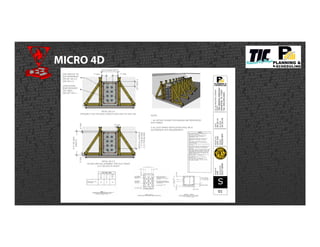
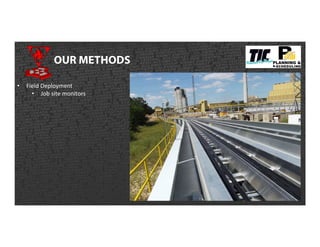
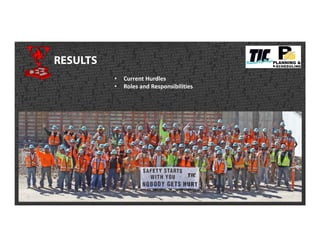
- Methods include micro 4D, field deployment, training, and identifying hurdles and roles.
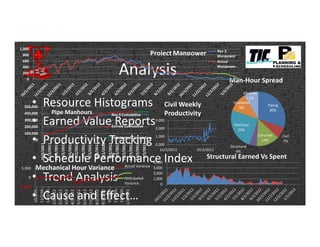
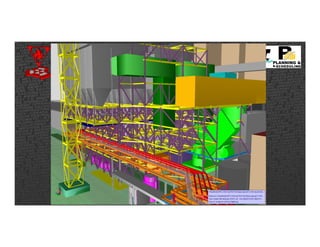
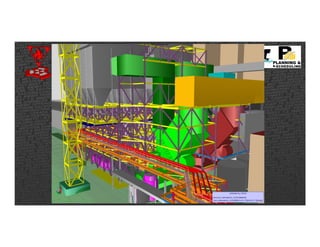
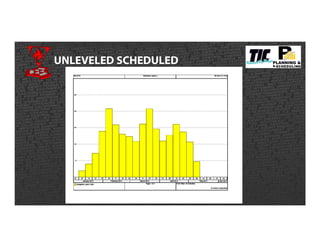
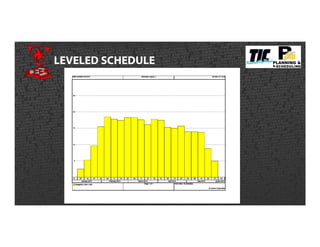
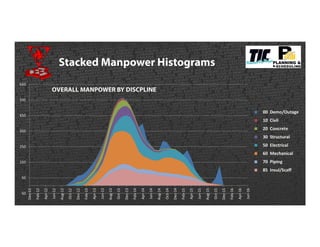
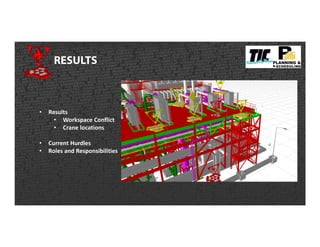
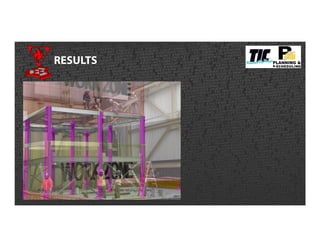
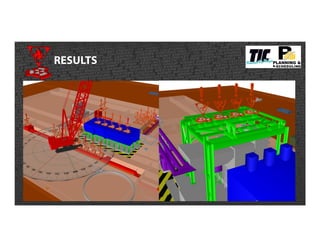
- Results found workspace conflicts, crane locations, and current hurdles while questions remained.