Cara Menggugurkan Sperma Yang Masuk Rahim Biyar Tidak Hamil
ICRA2019 Poster
1. www.data61.csiro.au
Why Simulation?
• No wear or damage to real-world hardware;
• Many instantiations of a simulation can run in parallel;
• (Often) Faster than real-time operation;
• Instant access to robots without having to purchase;
• Human intervention is not required; and
• Safety.
The ‘Reality Gap’ is the disparity seen when transferring a controller
generated, evolved or learnt in simulation to the real-world. Many things
cause the reality gap including:
Results
We compare real-world data to simulation data using 3D Euclidean distance.
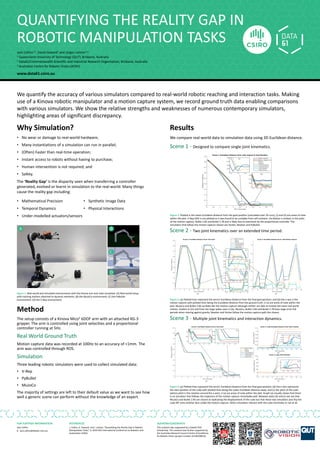
Scene 1 - Designed to compare single joint kinematics.
Scene 2 - Two joint kinematics over an extended time period.
Scene 3 - Multiple joint kinematics and interaction dynamics.
Figure 1: Real-world and simulated environments with the Kinova arm and cube visualised. (A) Real-world setup
with tracking markers attached to dynamic elements; (B) the MuJoCo environment; (C) the PyBullet
environment; (D) the V-Rep environment.
REFERENCES
J. Collins, D. Howard, and J. Leitner, “Quantifying the Reality Gap in Robotic
Manipulation Tasks,” in 2019 IEEE International Conference on Robotics and
Automation (ICRA).
ACKNOWLEDGEMENTS
This research was supported by a Data61 PhD
Scholarship. This research was further supported by
the Australian Research Council Centre of Excellence
for Robotic Vision (project number CE140100016).
QUANTIFYING THE REALITY GAP IN
ROBOTIC MANIPULATION TASKS
We quantify the accuracy of various simulators compared to real-world robotic reaching and interaction tasks. Making
use of a Kinova robotic manipulator and a motion capture system, we record ground truth data enabling comparisons
with various simulators. We show the relative strengths and weaknesses of numerous contemporary simulators,
highlighting areas of significant discrepancy.
Jack Collins1,2, David Howard2 and Jürgen Leitner1,3
1 Queensland University of Technology (QUT), Brisbane, Australia
2 Data61/Commonwealth Scientific and Industrial Research Organisation, Brisbane, Australia
3 Australian Centre for Robotic Vision (ACRV)
Figure 3: (a) Plotted lines represent the wrist's Euclidean distance from the final goal position; and (b) the x-axis is the
motion capture with plotted lines being the Euclidean distance from the ground truth. (i-iv) are areas of note within the
plot. MuJoCo and Bullet 2.83 oscillate like the motion capture although neither are able to imitate the exact real world
motion. Evident in (iii) and from the large spikes seen in (b), MuJoCo, Bullet 2.83 and Bullet 2.78 have large error-full
periods when moving against gravity. Newton and Vortex follow the motion capture path the closest.
Method
The setup consists of a Kinova Mico2 6DOF arm with an attached KG-3
gripper. The arm is controlled using joint velocities and a proportional
controller running at 5Hz.
Real World Ground Truth
Motion capture data was recorded at 100Hz to an accuracy of <1mm. The
arm was controlled through ROS.
Simulation
Three leading robotic simulators were used to collect simulated data:
• V-Rep
• PyBullet
• MuJoCo
The majority of settings are left to their default value as we want to see how
well a generic scene can perform without the knowledge of an expert.
FOR FURTHER INFORMATION
Jack Collins
e jack.collins@data61.csiro.au
• Mathematical Precision
• Temporal Dynamics
• Under-modelled actuators/sensors
• Synthetic Image Data
• Physical Interactions
Figure 4: (a) Plotted lines represent the wrist's Euclidean distance from the final goal position; (b) the x-axis represents
the start position of the cube with plotted lines being the cubes Euclidean distance away; and (c) the pitch of the cube
(where pitch is the rotation around the y-axis). (i-iv) are areas of note within the plot. Graph (a) visually shows that there
is no simulator that follows the trajectory of the motion capture remarkably well. Between plots (b) and (c) we see that
MuJoCo and Bullet 2.83 are closest at replicating the displacement of the cube but that these two simulators also flip the
cube 90° onto another face unlike the motion capture. Other simulators interact with the cube minimally or not at all.
Figure 2: Plotted is the mean Euclidean distance from the goal position (calculated over 20 runs), (i) and (ii) are areas of note
within the plot. V-Rep ODE is not plotted as it was found to be unstable from self contacts. Oscillation is evident in the plots
of the motion capture, Bullet 2.83 and Bullet 2.78 and is likely due to overshoot by the proportional controller. The
simulators that follow the motion capture closest are Vortex, Newton and PyBullet.