SlideShare a Scribd company logo
1 of 1
Download to read offline
Calcareous	
  Nannofossil	
  Assemblages	
  from	
  the	
  Northern	
  Gulf	
  of	
  Alaska	
  and	
  Late	
  
Pleistocene	
  Environmental	
  Change	
  	
  
Inva	
  Braha1and	
  Leah	
  LeVay2	


  1ibraha@tamu.edu	
  ,	
  Department	
  of	
  Geology	
  and	
  Geophysics,	
  Texas	
  A&M	
  University,	
  College	
  StaIon,	
  TX	
  77843—3115;	
  
2levay@iodp.tamu.edu	
  InternaIonal	
  Ocean	
  Discovery	
  Program,	
  College	
  StaIon,77845	


IntroducIon/Background	
  
ScienIfic	
  ObjecIves	
  
Future	
  Work	
  
Results	
  Abstract	
  
Discussion/Conclusions	
  
References	
  
Acknowledgments	
  
Integrated	
  Ocean	
  Drilling	
  Program	
  (IODP)	
  Site	
  U1418	
  recovered	
  an	
  expanded	
  Middle	
  to	
  Late	
  Pleistocene	
  deep	
  water	
  
sedimentary	
  sequence	
  in	
  the	
  Gulf	
  of	
  Alaska.	
  The	
  purpose	
  of	
  this	
  project	
  is	
  to	
  reconstruct	
  paleoenviromental	
  sea	
  surface	
  
condiIons	
  using	
  calcerous	
  nannofossil	
  from	
  the	
  Late	
  Pleistocene	
  (~	
  0-­‐0.3	
  Ma).	
  Smear	
  slides	
  were	
  prepared	
  from	
  site	
  U1418	
  
core	
  samples,	
  and	
  a	
  Zeiss	
  Axioskop	
  microscope	
  at	
  1000×	
  magnificaIon	
  was	
  used	
  to	
  calculate	
  relaIve	
  abundances	
  of	
  
nannofossil	
  species.	
  Principal	
  component	
  analysis	
  was	
  used	
  to	
  examine	
  the	
  variance	
  in	
  the	
  assemblage	
  and	
  relate	
  it	
  to	
  changes	
  
in	
  paleoceanographic	
  condiIons.	
  IniIal	
  results	
  show	
  a	
  shid	
  between	
  a	
  fossil	
  assemblage	
  dominated	
  by	
  the	
  genus	
  
Gephyrocapsa	
  to	
  one	
  dominated	
  by	
  Coccolithus	
  at	
  ~	
  100	
  ka.	
  This	
  major	
  alteraIon	
  of	
  the	
  assemblage	
  is	
  likely	
  related	
  to	
  a	
  
change	
  in	
  surface	
  water	
  temperature,	
  nutrient	
  availability,	
  or	
  both.	
  	
  
Ø Integrated	
  Ocean	
  Drilling	
  Program	
  (IODP)	
  ExpediIon	
  341	
  recovered	
  deep	
  water	
  sedimentary	
  records	
  
from	
  the	
  Southern	
  Alaska	
  Margin.	
  Site	
  U1418	
  was	
  drilled	
  on	
  the	
  Surveyor	
  Fan	
  in	
  the	
  Gulf	
  of	
  Alaska.	
  	
  
Ø BiostraIgraphy	
  and	
  magnetostraIgraphy	
  data	
  indicate	
  a	
  Pleistocene	
  age	
  for	
  the	
  secIon	
  cored	
  at	
  Site	
  
U1418	
  (~	
  0-­‐0.3	
  Ma).	
  	
  
Ø Site	
  U1418	
  was	
  drilled	
  in	
  3703	
  m	
  of	
  water	
  and	
  penetrated	
  to	
  ~950	
  m	
  below	
  seafloor	
  (mbsf).	


Figure	
  1.	
  The	
  Gulf	
  of	
  Alaska	
  region	
  (located	
  in	
  the	
  subarcIc	
  northeast	
  Pacific	
  Ocean	
  ):	
  geography	
  and	
  locaIon	
  of	
  previous	
  DSDP	
  
and	
  ODP	
  drilling	
  locaIons	
  (see	
  inset)	
  and	
  ExpediIon	
  341	
  drilling	
  sites	
  (from	
  Jaeger	
  et	
  al.,	
  2014).	


Figure	
  2.	
  Site	
  U1418	
  is	
  located	
  between	
  AleuEan	
  Trench	
  channel	
  and	
  Bering	
  channel	
  at	
  the	
  base	
  of	
  the	
  conEnental	
  shelf	
  break	
  
(from	
  Jaeger	
  et	
  al.,	
  2014)	
  
Site	
  U1418	
  
Lat:	
  58˚56.60ʹ′	
  N	
  
Long:	
  144˚29.56ʹ′	
  W	
  
Water	
  depth:	
  948.7	
  m	
  
Age:	
  Pleistocene	
  to	
  
Holocene	


Ø The	
  objecIve	
  of	
  this	
  research	
  is	
  to	
  reconstruct	
  paleoenviromental	
  sea	
  surface	
  condiIons	
  using	
  
calcareous	
  nannofossils	
  from	
  the	
  Late	
  Pleistocene.	
  
Ø Determine	
  glacial	
  and	
  interglacial	
  cyclicity	
  recorded	
  in	
  the	
  cores	
  by	
  comparing	
  the	
  nannofossil	
  
data	
  from	
  Site	
  U1418	
  with	
  the	
  global	
  benthic	
  oxygen	
  isotope	
  record	
  of	
  Lisiecki	
  and	
  Raymo	
  
(2005).	


Ø A	
  total	
  of	
  44	
  samples	
  for	
  this	
  project	
  were	
  collected	
  from	
  cores	
  
recovered	
  during	
  IODP	
  ExpediIon	
  341,	
  Southern	
  Alaska	
  Margin	
  
Tectonics,	
  Climate	
  &	
  SedimentaIon.	
  	
  
Ø We	
  prepared	
  smear	
  slides	
  for	
  examinaIon	
  of	
  calcareous	
  
nannofossils	
  using	
  standard	
  techniques	
  (Bown	
  and	
  Young,	
  1998).	
  
Ø We	
  examined	
  samples	
  using	
  a	
  Zeiss	
  Axioskop	
  and	
  a	
  Zeiss	
  
Axioscope	
  .A1	
  microscope	
  (Fig.	
  3)	
  at	
  1000×	
  magnificaIon.	
  Up	
  to	
  100	
  
specimens	
  were	
  counted	
  per	
  slide	
  to	
  calculate	
  relaIve	
  abundances	
  
of	
  nannofossil	
  species.	
  
Ø 	
  Photomicrographs	
  were	
  taken	
  using	
  a	
  Spot	
  camera	
  (Fig.	
  3).	
  
Ø The	
  abundances	
  of	
  Gephyrocapsa	
  and	
  Coccolithus	
  are	
  inversely	
  related	
  throughout	
  much	
  
of	
  the	
  record,	
  suggesIng	
  that	
  they	
  are	
  responding	
  in	
  opposite	
  ways	
  to	
  changes	
  in	
  sea-­‐
surface	
  condiIons.	
  Since	
  both	
  prefer	
  colder	
  waters	
  (e.g.,	
  Winter	
  et	
  al.,	
  2004),	
  these	
  
variaIons	
  may	
  be	
  due	
  to	
  changes	
  in	
  nutrient	
  availability,	
  as	
  G.	
  muellerae	
  prefers	
  
eutrophic	
  condiIons	
  (e.g.,	
  Winter	
  et	
  al.,	
  1994;	
  Boeckel	
  et	
  al.,	
  2006).	
  
Ø Based	
  on	
  the	
  correlaIon	
  of	
  the	
  calcareous	
  nannofossil	
  assemblage	
  data	
  and	
  Site	
  U1418	
  
age	
  model	
  to	
  the	
  global	
  oxygen	
  Isotope	
  stack	
  based	
  on	
  on	
  benthic	
  foraminifera,	
  we	
  
interpret	
  that	
  Geophyrocapsa	
  is	
  more	
  abundant	
  during	
  the	
  last	
  glacial	
  maximum	
  (Marine	
  
Isotope	
  Stage	
  2)	
  and	
  penulImate	
  glaciaIon	
  (Stage	
  6),	
  whereas	
  Coccolithus	
  pelagicus	
  and	
  
Cruciplacolithus	
  have	
  their	
  highest	
  abundances	
  near	
  the	
  end	
  of	
  the	
  last	
  glacial	
  cycle	
  
(Marine	
  Isotope	
  Stages	
  3	
  and	
  4).	
  
Ø InteresIngly,	
  very	
  warm	
  interglacial	
  Stage	
  5	
  also	
  has	
  high	
  abundances	
  of	
  Gephyrocapsa	
  
and	
  low	
  abundances	
  of	
  Coccolithus,	
  similar	
  to	
  glacial	
  Stage	
  6.	
  More	
  work	
  is	
  needed	
  to	
  
understand	
  the	
  mechanisms	
  driving	
  the	
  variaIons	
  in	
  abundance	
  of	
  these	
  taxa.	
  
Ø The	
  total	
  abundance	
  of	
  nannofossils	
  decreases	
  and	
  is	
  more	
  variable	
  below	
  100	
  mbsf	
  (Fig.	
  4)	
  
Ø High	
  abundances	
  of	
  Gephyrocapsa	
  and	
  low	
  abundances	
  of	
  Coccolithus	
  occur	
  from	
  ~100-­‐250	
  mbsf	
  (Fig	
  4)	
  
Ø 	
  Cruciplacolithus	
  decreases	
  below	
  100	
  mbsf	
  (Fig.	
  4)	
  
Ø Reworked	
  specimens	
  are	
  consistently	
  present	
  above	
  50	
  mbsf,	
  with	
  intermipent	
  pulses	
  below	
  that	
  depth	
  (Fig.	
  4)	
  
Ø Figure	
  5	
  shows	
  the	
  nannofossil	
  assemblage	
  data	
  compared	
  to	
  the	
  Lisiecki	
  and	
  Raymo	
  (2005)	
  benthic	
  oxygen	
  isotope	
  stack	
  using	
  the	
  Site	
  U1418	
  age	
  model	
  to	
  
see	
  illustrate	
  the	
  influence	
  of	
  glacial/interglacial	
  variability	
  on	
  the	
  nannofossil	
  abundances.	


Boeckel,	
  B.,	
  Baumann,	
  K.-­‐H.,	
  Henrich,	
  R.,	
  and	
  Kinkel,	
  H.,	
  2006.	
  Coccolith	
  distribuIon	
  paperns	
  in	
  South	
  AtlanIc	
  and	
  Southern	
  Ocean	
  surface	
  sediments	
  
in	
  relaIon	
  to	
  environmental	
  gradients.	
  Deep-­‐Sea	
  Research	
  I,	
  1073-­‐1099.	
  
Bown,	
  P.R.	
  &	
  Young,	
  J.R.	
  1998.	
  Techniques.	
  In:	
  P.R.	
  Bown	
  (Ed.).	
  Calcareous	
  Nannofossil	
  Biostra8graphy.	
  Kluwer	
  Academie,	
  London:	
  16–28.	
  
Jaeger,	
  J.M.,	
  Gulick,	
  S.P.S.,	
  LeVay,	
  L.J.,	
  Asahi,	
  H.,	
  Bahlburg,	
  H.,	
  Belanger,	
  C.L.,	
  Berbel,	
  G.B.B.,	
  Childress,	
  L.B.,	
  Cowan,	
  E.A.,	
  Drab,	
  L.,	
  Forwick,	
  M.,	
  
Fukumura,	
  A.,	
  Ge,	
  S.,	
  Gupta,	
  S.M.,	
  Kioka,	
  A.,	
  Konno,	
  S.,	
  März,	
  C.E.,	
  Matsuzaki,	
  K.M.,	
  McClymont,	
  E.L.,	
  Mix,	
  A.C.,	
  Moy,	
  C.M.,	
  Müller,	
  J.,	
  Nakamura,	
  
A.,	
  Ojima,	
  T.,	
  Ridgway,	
  K.D.,	
  Rodrigues	
  Ribeiro,	
  F.,	
  Romero,	
  O.E.,	
  Slagle,	
  A.L.,Stoner,	
  J.S.,	
  St-­‐Onge,	
  G.,	
  Suto,	
  I.,	
  Walczak,	
  M.H.,	
  and	
  Worthington,	
  
L.L.,	
  2014.	
  Site	
  U1418.	
  In	
  Jaeger,	
  J.M.,	
  Gulick,	
  S.P.S.,	
  LeVay,	
  L.J.,	
  and	
  the	
  ExpediIon	
  341	
  ScienIsts,	
  Proc.	
  IODP,	
  341:	
  College	
  StaIon,	
  TX	
  (Integrated	
  
Ocean	
  Drilling	
  Program).	
  doi:10.2204/iodp.proc.341.104.2014	
  
Lisiecki,	
  L.E.,	
  and	
  Raymo,	
  M.E.,	
  2005,	
  A	
  Pliocene-­‐Pleistocene	
  stack	
  of	
  57	
  globally	
  distributed	
  benthic	
  d18O	
  records.	
  Paleoceanography,	
  20:PA1003.	
  
Winter,	
  A.,	
  Jordan,	
  R.W.,	
  and	
  Roth,	
  P.H.,	
  1994.	
  Biogeography	
  of	
  living	
  coccolithophores	
  in	
  oceanic	
  waters.	
  In:	
  Winter,	
  A.	
  and	
  Siesser,	
  W.G.	
  (Eds),	
  
Coccolithophores.	
  Cambridge	
  University	
  Press,	
  Cambridge,	
  pp.	
  161-­‐177.	


This	
  project	
  uses	
  samples	
  and	
  data	
  provided	
  by	
  the	
  Integrated	
  Ocean	
  Drilling	
  Program.	
  Funding	
  for	
  this	
  research	
  comes	
  from	
  an	
  IODP	
  Post-­‐ExpediIon	
  
Award	
  to	
  Leah	
  LeVay.	
  This	
  project	
  has	
  been	
  supported	
  by	
  laboratory	
  equipment	
  at	
  IODP	
  at	
  Texas	
  A&M	
  University.	
  Special	
  thank	
  you	
  to	
  Dr.	
  Leah	
  LeVay	
  
and	
  Dr.	
  Denise	
  Kulhanek	
  for	
  assisIng	
  and	
  guiding	
  me	
  in	
  this	
  project.	
  
Gephyrocapsa	
  sp.	
  	
  
U1418C-­‐2H-­‐3,	
  116-­‐120	
  cm	
  
Coccolithus	
  pelagicus	
  
U1418C-­‐2H-­‐3,	
  16-­‐20	
  cm	
  
Re8culofenstrata	
  sp.	
  (reworked)	
  
U1418D-­‐2H-­‐5,	
  116-­‐120	
  cm	
  
Gephyrocapsa	
  muellerae	
  
U1418C-­‐2H-­‐3,	
  116-­‐120	
  cm	
  
Figure	
  6.	
  Photomicrographs	
  of	
  calcareous	
  nannofossil	
  taken	
  from	
  different	
  samples.	
  Pictures	
  taken	
  using	
  a	
  Spot	
  camera	
  on	
  a	
  Zeiss	
  Axioscope.	
  	
  
Figure	
  4.	
  	
  VariaIons	
  in	
  the	
  total	
  abundance	
  of	
  nannofossils	
  and	
  percentage	
  abundance	
  of	
  different	
  species	
  downhole,	
  ploped	
  against	
  the	
  lithology	
  of	
  Site	
  U1418.	
  
Ø  Future	
  work	
  will	
  include	
  addiIonal	
  analyses	
  and	
  comparison	
  to	
  other	
  paleoclimaIc	
  
proxies	
  to	
  beper	
  understand	
  the	
  Late	
  Pleistocene	
  paleoceanography	
  and	
  
paleoclimate	
  of	
  the	
  region.	


Methods	
  
Cruciplacolithus	
  sp.	
  
U1418C-­‐2H-­‐3,	
  116-­‐120	
  cm	
  
Re8culofenstrata	
  sp.	
  (reworked)	
  
U1418D-­‐4H-­‐5,	
  36-­‐40	
  cm	
  
Re8culofenstrata	
  sp.	
  (reworked)	
  
U1418D-­‐2H-­‐5,	
  116-­‐120	
  cm	
  
Toweius	
  sp.	
  (reworked)	
  
U1418C-­‐2H-­‐3,	
  116-­‐120	
  cm	
  
Figure	
  3.	
  Zeiss	
  Axioscope	
  .A1	
  microscope	
  and	
  Spot	
  camera	
  used	
  for	
  this	
  study.	
  
Figure	
  5.	
  Benthic	
  oxygen	
  isotope	
  stack	
  (Lisiecki	
  and	
  Raymo,	
  2005)	
  (black)	
  ploped	
  together	
  
with	
  percent	
  abundance	
  Gephyrocapsa	
  (blue),	
  Coccolithus	
  (red),	
  and	
  Cruciplacolithus	
  (green)	
  
according	
  to	
  the	
  Site	
  U1418	
  age	
  model.	
  Marine	
  isotope	
  stages	
  are	
  indicated	
  at	
  the	
  top	
  and	
  
gray	
  rectangles	
  highlight	
  cold	
  (glacial)	
  stages.	
  
Depth(mbsfHoleU1418D)
Site U1418
300
275
250
225
200
175
150
125
100
75
50
25
0
I
II
4
3
2
1
Lith.
unit
Graphic
lithology
Volcanic
grain
abundance
0 20 40 60 80 100120
Total Nannofossils
(counts)
0 20 40 60 80 100
Gephyrocapsa
muellerae >3 µm
0 20 40 60 80 100
Gephyrocapsa
muellerae <3 µm
0 20 40 60 80 100
Coccolithus
(total)
0 20 40 60 80 100
Reworked
nannofossils
0 20 40 60 80 100
Cruciplacolithus
(total)
0 20 40 60 80 100
Gephyrocapsa
(total)
Depth(ccsfSiteU1418)

More Related Content

What's hot

The age and extent of tropical alpine glaciation in the cordillera blanca per...
The age and extent of tropical alpine glaciation in the cordillera blanca per...The age and extent of tropical alpine glaciation in the cordillera blanca per...
The age and extent of tropical alpine glaciation in the cordillera blanca per...WilJaIn
 
DUGG 2012 Bing Final low res
DUGG 2012 Bing Final low resDUGG 2012 Bing Final low res
DUGG 2012 Bing Final low resChristiane Alepuz
 
Samec - Regression analysis of relations among main Quaternary environmental ...
Samec - Regression analysis of relations among main Quaternary environmental ...Samec - Regression analysis of relations among main Quaternary environmental ...
Samec - Regression analysis of relations among main Quaternary environmental ...swenney
 
Greening of the Arctic: Climate change and circumpolar Arctic vegetation
Greening of the Arctic: Climate change and circumpolar Arctic vegetation Greening of the Arctic: Climate change and circumpolar Arctic vegetation
Greening of the Arctic: Climate change and circumpolar Arctic vegetation Edie Barbour
 
DewhurstPublicationListNov2015
DewhurstPublicationListNov2015DewhurstPublicationListNov2015
DewhurstPublicationListNov2015Dave Dewhurst
 
Iab2008 goa0811120(1)
Iab2008 goa0811120(1)Iab2008 goa0811120(1)
Iab2008 goa0811120(1)Edie Barbour
 
Enjefa beach kuwait for linkedin 2
Enjefa beach kuwait for linkedin 2Enjefa beach kuwait for linkedin 2
Enjefa beach kuwait for linkedin 2Stephen Crittenden
 
Walker rovaniemilclu cmeetingtalk20120517(1)
Walker rovaniemilclu cmeetingtalk20120517(1)Walker rovaniemilclu cmeetingtalk20120517(1)
Walker rovaniemilclu cmeetingtalk20120517(1)Edie Barbour
 
Long-term palaeoclimate: the origin of the ice ages
Long-term palaeoclimate: the origin of the ice agesLong-term palaeoclimate: the origin of the ice ages
Long-term palaeoclimate: the origin of the ice agesProf Simon Haslett
 
The North America and Eurasia Arctic transects:
The North America and Eurasia Arctic transects: The North America and Eurasia Arctic transects:
The North America and Eurasia Arctic transects: Edie Barbour
 
The Boltysh crater fill sediments – a 500,000 year record of the lower Danian
The Boltysh crater fill sediments – a 500,000 year record of the lower DanianThe Boltysh crater fill sediments – a 500,000 year record of the lower Danian
The Boltysh crater fill sediments – a 500,000 year record of the lower DanianIain Gilmour
 
McClymont_Alastair-Publication_List
McClymont_Alastair-Publication_ListMcClymont_Alastair-Publication_List
McClymont_Alastair-Publication_ListAlastair McClymont
 
研究テーマ紹介:エルニーニョ・準10年スケール変動・沿岸湧昇など:「みらい」船内セミナー2012年7月21日
研究テーマ紹介:エルニーニョ・準10年スケール変動・沿岸湧昇など:「みらい」船内セミナー2012年7月21日研究テーマ紹介:エルニーニョ・準10年スケール変動・沿岸湧昇など:「みらい」船内セミナー2012年7月21日
研究テーマ紹介:エルニーニョ・準10年スケール変動・沿岸湧昇など:「みらい」船内セミナー2012年7月21日Takuya HASEGAWA
 
Source rock maturation studies using vitrinite reflectance and geothermal dat...
Source rock maturation studies using vitrinite reflectance and geothermal dat...Source rock maturation studies using vitrinite reflectance and geothermal dat...
Source rock maturation studies using vitrinite reflectance and geothermal dat...Premier Publishers
 
Antarctic climate history and global climate changes
Antarctic climate history and global climate changesAntarctic climate history and global climate changes
Antarctic climate history and global climate changesPontus Lurcock
 
Spatial–temporal changes in andean plateau climate and elevation from stable ...
Spatial–temporal changes in andean plateau climate and elevation from stable ...Spatial–temporal changes in andean plateau climate and elevation from stable ...
Spatial–temporal changes in andean plateau climate and elevation from stable ...herculanoalvarenga
 

What's hot (20)

The age and extent of tropical alpine glaciation in the cordillera blanca per...
The age and extent of tropical alpine glaciation in the cordillera blanca per...The age and extent of tropical alpine glaciation in the cordillera blanca per...
The age and extent of tropical alpine glaciation in the cordillera blanca per...
 
DUGG 2012 Bing Final low res
DUGG 2012 Bing Final low resDUGG 2012 Bing Final low res
DUGG 2012 Bing Final low res
 
Samec - Regression analysis of relations among main Quaternary environmental ...
Samec - Regression analysis of relations among main Quaternary environmental ...Samec - Regression analysis of relations among main Quaternary environmental ...
Samec - Regression analysis of relations among main Quaternary environmental ...
 
Greening of the Arctic: Climate change and circumpolar Arctic vegetation
Greening of the Arctic: Climate change and circumpolar Arctic vegetation Greening of the Arctic: Climate change and circumpolar Arctic vegetation
Greening of the Arctic: Climate change and circumpolar Arctic vegetation
 
DewhurstPublicationListNov2015
DewhurstPublicationListNov2015DewhurstPublicationListNov2015
DewhurstPublicationListNov2015
 
Iab2008 goa0811120(1)
Iab2008 goa0811120(1)Iab2008 goa0811120(1)
Iab2008 goa0811120(1)
 
Enjefa beach kuwait for linkedin 2
Enjefa beach kuwait for linkedin 2Enjefa beach kuwait for linkedin 2
Enjefa beach kuwait for linkedin 2
 
Walker rovaniemilclu cmeetingtalk20120517(1)
Walker rovaniemilclu cmeetingtalk20120517(1)Walker rovaniemilclu cmeetingtalk20120517(1)
Walker rovaniemilclu cmeetingtalk20120517(1)
 
Long-term palaeoclimate: the origin of the ice ages
Long-term palaeoclimate: the origin of the ice agesLong-term palaeoclimate: the origin of the ice ages
Long-term palaeoclimate: the origin of the ice ages
 
The North America and Eurasia Arctic transects:
The North America and Eurasia Arctic transects: The North America and Eurasia Arctic transects:
The North America and Eurasia Arctic transects:
 
The Boltysh crater fill sediments – a 500,000 year record of the lower Danian
The Boltysh crater fill sediments – a 500,000 year record of the lower DanianThe Boltysh crater fill sediments – a 500,000 year record of the lower Danian
The Boltysh crater fill sediments – a 500,000 year record of the lower Danian
 
McClymont_Alastair-Publication_List
McClymont_Alastair-Publication_ListMcClymont_Alastair-Publication_List
McClymont_Alastair-Publication_List
 
研究テーマ紹介:エルニーニョ・準10年スケール変動・沿岸湧昇など:「みらい」船内セミナー2012年7月21日
研究テーマ紹介:エルニーニョ・準10年スケール変動・沿岸湧昇など:「みらい」船内セミナー2012年7月21日研究テーマ紹介:エルニーニョ・準10年スケール変動・沿岸湧昇など:「みらい」船内セミナー2012年7月21日
研究テーマ紹介:エルニーニョ・準10年スケール変動・沿岸湧昇など:「みらい」船内セミナー2012年7月21日
 
Cycles of climatic changes
Cycles of climatic changesCycles of climatic changes
Cycles of climatic changes
 
Source rock maturation studies using vitrinite reflectance and geothermal dat...
Source rock maturation studies using vitrinite reflectance and geothermal dat...Source rock maturation studies using vitrinite reflectance and geothermal dat...
Source rock maturation studies using vitrinite reflectance and geothermal dat...
 
1996 hossainfs62 350 (2)
1996 hossainfs62 350 (2)1996 hossainfs62 350 (2)
1996 hossainfs62 350 (2)
 
Antarctic climate history and global climate changes
Antarctic climate history and global climate changesAntarctic climate history and global climate changes
Antarctic climate history and global climate changes
 
Wilson cycle
Wilson cycleWilson cycle
Wilson cycle
 
Spatial–temporal changes in andean plateau climate and elevation from stable ...
Spatial–temporal changes in andean plateau climate and elevation from stable ...Spatial–temporal changes in andean plateau climate and elevation from stable ...
Spatial–temporal changes in andean plateau climate and elevation from stable ...
 
Alvarenga et al. 2008
Alvarenga et al. 2008Alvarenga et al. 2008
Alvarenga et al. 2008
 

Similar to Inva_poster_FINAL

Emma Hutchinson SESUR poster
Emma Hutchinson SESUR posterEmma Hutchinson SESUR poster
Emma Hutchinson SESUR posterEmma Hutchinson
 
Speleothems Ppt
Speleothems PptSpeleothems Ppt
Speleothems Pptjmole
 
Foraminiferal Approach to Palaeoenvironmental Interpretations: Case Study of ...
Foraminiferal Approach to Palaeoenvironmental Interpretations: Case Study of ...Foraminiferal Approach to Palaeoenvironmental Interpretations: Case Study of ...
Foraminiferal Approach to Palaeoenvironmental Interpretations: Case Study of ...Premier Publishers
 
Gold in Oceans-EPSL
Gold in Oceans-EPSLGold in Oceans-EPSL
Gold in Oceans-EPSLRoss Large
 
Abstract: SEDIMENT RECORD DEMONSTRATES DYNAMICS OF DEGLACIATION IN THE HUGO I...
Abstract: SEDIMENT RECORD DEMONSTRATES DYNAMICS OF DEGLACIATION IN THE HUGO I...Abstract: SEDIMENT RECORD DEMONSTRATES DYNAMICS OF DEGLACIATION IN THE HUGO I...
Abstract: SEDIMENT RECORD DEMONSTRATES DYNAMICS OF DEGLACIATION IN THE HUGO I...Isabelle Weisman
 
Marine isotope stages short doc
Marine isotope stages short docMarine isotope stages short doc
Marine isotope stages short docJGGOKULAKRISHNAN
 
Cenomanian – Turonian Foraminifera and Palynomorphs from the Calabar Flank, S...
Cenomanian – Turonian Foraminifera and Palynomorphs from the Calabar Flank, S...Cenomanian – Turonian Foraminifera and Palynomorphs from the Calabar Flank, S...
Cenomanian – Turonian Foraminifera and Palynomorphs from the Calabar Flank, S...Premier Publishers
 
Kim Cobb's Borneo stalagmite talk - AGU 2015
Kim Cobb's Borneo stalagmite talk - AGU 2015Kim Cobb's Borneo stalagmite talk - AGU 2015
Kim Cobb's Borneo stalagmite talk - AGU 2015Kim Cobb
 
Monahan - GSA Poster 36x48
Monahan - GSA Poster 36x48Monahan - GSA Poster 36x48
Monahan - GSA Poster 36x48Kyle Monahan
 
Bujak Arctic Cenozoic talk
Bujak Arctic Cenozoic talkBujak Arctic Cenozoic talk
Bujak Arctic Cenozoic talkJonathan Bujak
 
An introduction to environmental change
An introduction to environmental changeAn introduction to environmental change
An introduction to environmental changeProf Simon Haslett
 
Biostratigraphy and microfossils
Biostratigraphy and microfossilsBiostratigraphy and microfossils
Biostratigraphy and microfossilsProf Simon Haslett
 
Science_Coale_Roberts_2004
Science_Coale_Roberts_2004Science_Coale_Roberts_2004
Science_Coale_Roberts_2004phyto
 
Data Report .PDF
Data Report .PDFData Report .PDF
Data Report .PDFNoelle Moen
 
Photosynthesis in the Marine Environment BOOK REVIEW
Photosynthesis in the Marine Environment BOOK REVIEWPhotosynthesis in the Marine Environment BOOK REVIEW
Photosynthesis in the Marine Environment BOOK REVIEWMats Björk
 

Similar to Inva_poster_FINAL (20)

Emma Hutchinson SESUR poster
Emma Hutchinson SESUR posterEmma Hutchinson SESUR poster
Emma Hutchinson SESUR poster
 
LPSC_final
LPSC_finalLPSC_final
LPSC_final
 
OSMposter
OSMposterOSMposter
OSMposter
 
Marine palaeoclimatology
Marine palaeoclimatologyMarine palaeoclimatology
Marine palaeoclimatology
 
Speleothems Ppt
Speleothems PptSpeleothems Ppt
Speleothems Ppt
 
Foraminiferal Approach to Palaeoenvironmental Interpretations: Case Study of ...
Foraminiferal Approach to Palaeoenvironmental Interpretations: Case Study of ...Foraminiferal Approach to Palaeoenvironmental Interpretations: Case Study of ...
Foraminiferal Approach to Palaeoenvironmental Interpretations: Case Study of ...
 
Gold in Oceans-EPSL
Gold in Oceans-EPSLGold in Oceans-EPSL
Gold in Oceans-EPSL
 
Abstract: SEDIMENT RECORD DEMONSTRATES DYNAMICS OF DEGLACIATION IN THE HUGO I...
Abstract: SEDIMENT RECORD DEMONSTRATES DYNAMICS OF DEGLACIATION IN THE HUGO I...Abstract: SEDIMENT RECORD DEMONSTRATES DYNAMICS OF DEGLACIATION IN THE HUGO I...
Abstract: SEDIMENT RECORD DEMONSTRATES DYNAMICS OF DEGLACIATION IN THE HUGO I...
 
Marine isotope stages short doc
Marine isotope stages short docMarine isotope stages short doc
Marine isotope stages short doc
 
Cenomanian – Turonian Foraminifera and Palynomorphs from the Calabar Flank, S...
Cenomanian – Turonian Foraminifera and Palynomorphs from the Calabar Flank, S...Cenomanian – Turonian Foraminifera and Palynomorphs from the Calabar Flank, S...
Cenomanian – Turonian Foraminifera and Palynomorphs from the Calabar Flank, S...
 
Kim Cobb's Borneo stalagmite talk - AGU 2015
Kim Cobb's Borneo stalagmite talk - AGU 2015Kim Cobb's Borneo stalagmite talk - AGU 2015
Kim Cobb's Borneo stalagmite talk - AGU 2015
 
Monahan - GSA Poster 36x48
Monahan - GSA Poster 36x48Monahan - GSA Poster 36x48
Monahan - GSA Poster 36x48
 
Bujak Arctic Cenozoic talk
Bujak Arctic Cenozoic talkBujak Arctic Cenozoic talk
Bujak Arctic Cenozoic talk
 
An introduction to environmental change
An introduction to environmental changeAn introduction to environmental change
An introduction to environmental change
 
Biostratigraphy and microfossils
Biostratigraphy and microfossilsBiostratigraphy and microfossils
Biostratigraphy and microfossils
 
Science_Coale_Roberts_2004
Science_Coale_Roberts_2004Science_Coale_Roberts_2004
Science_Coale_Roberts_2004
 
Data Report .PDF
Data Report .PDFData Report .PDF
Data Report .PDF
 
Photosynthesis in the Marine Environment BOOK REVIEW
Photosynthesis in the Marine Environment BOOK REVIEWPhotosynthesis in the Marine Environment BOOK REVIEW
Photosynthesis in the Marine Environment BOOK REVIEW
 
Carbon regeneration in cariaco basin, venezuela. final
Carbon regeneration in cariaco basin, venezuela. finalCarbon regeneration in cariaco basin, venezuela. final
Carbon regeneration in cariaco basin, venezuela. final
 
fmicb-05-00679
fmicb-05-00679fmicb-05-00679
fmicb-05-00679
 

Inva_poster_FINAL

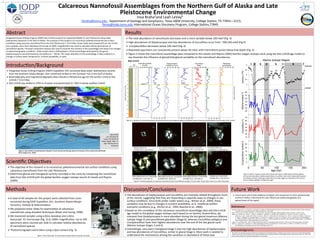
  • 1. Calcareous  Nannofossil  Assemblages  from  the  Northern  Gulf  of  Alaska  and  Late   Pleistocene  Environmental  Change     Inva  Braha1and  Leah  LeVay2            1ibraha@tamu.edu  ,  Department  of  Geology  and  Geophysics,  Texas  A&M  University,  College  StaIon,  TX  77843—3115;   2levay@iodp.tamu.edu  InternaIonal  Ocean  Discovery  Program,  College  StaIon,77845     IntroducIon/Background   ScienIfic  ObjecIves   Future  Work   Results  Abstract   Discussion/Conclusions   References   Acknowledgments   Integrated  Ocean  Drilling  Program  (IODP)  Site  U1418  recovered  an  expanded  Middle  to  Late  Pleistocene  deep  water   sedimentary  sequence  in  the  Gulf  of  Alaska.  The  purpose  of  this  project  is  to  reconstruct  paleoenviromental  sea  surface   condiIons  using  calcerous  nannofossil  from  the  Late  Pleistocene  (~  0-­‐0.3  Ma).  Smear  slides  were  prepared  from  site  U1418   core  samples,  and  a  Zeiss  Axioskop  microscope  at  1000×  magnificaIon  was  used  to  calculate  relaIve  abundances  of   nannofossil  species.  Principal  component  analysis  was  used  to  examine  the  variance  in  the  assemblage  and  relate  it  to  changes   in  paleoceanographic  condiIons.  IniIal  results  show  a  shid  between  a  fossil  assemblage  dominated  by  the  genus   Gephyrocapsa  to  one  dominated  by  Coccolithus  at  ~  100  ka.  This  major  alteraIon  of  the  assemblage  is  likely  related  to  a   change  in  surface  water  temperature,  nutrient  availability,  or  both.     Ø Integrated  Ocean  Drilling  Program  (IODP)  ExpediIon  341  recovered  deep  water  sedimentary  records   from  the  Southern  Alaska  Margin.  Site  U1418  was  drilled  on  the  Surveyor  Fan  in  the  Gulf  of  Alaska.     Ø BiostraIgraphy  and  magnetostraIgraphy  data  indicate  a  Pleistocene  age  for  the  secIon  cored  at  Site   U1418  (~  0-­‐0.3  Ma).     Ø Site  U1418  was  drilled  in  3703  m  of  water  and  penetrated  to  ~950  m  below  seafloor  (mbsf).       Figure  1.  The  Gulf  of  Alaska  region  (located  in  the  subarcIc  northeast  Pacific  Ocean  ):  geography  and  locaIon  of  previous  DSDP   and  ODP  drilling  locaIons  (see  inset)  and  ExpediIon  341  drilling  sites  (from  Jaeger  et  al.,  2014).     Figure  2.  Site  U1418  is  located  between  AleuEan  Trench  channel  and  Bering  channel  at  the  base  of  the  conEnental  shelf  break   (from  Jaeger  et  al.,  2014)   Site  U1418   Lat:  58˚56.60ʹ′  N   Long:  144˚29.56ʹ′  W   Water  depth:  948.7  m   Age:  Pleistocene  to   Holocene     Ø The  objecIve  of  this  research  is  to  reconstruct  paleoenviromental  sea  surface  condiIons  using   calcareous  nannofossils  from  the  Late  Pleistocene.   Ø Determine  glacial  and  interglacial  cyclicity  recorded  in  the  cores  by  comparing  the  nannofossil   data  from  Site  U1418  with  the  global  benthic  oxygen  isotope  record  of  Lisiecki  and  Raymo   (2005).         Ø A  total  of  44  samples  for  this  project  were  collected  from  cores   recovered  during  IODP  ExpediIon  341,  Southern  Alaska  Margin   Tectonics,  Climate  &  SedimentaIon.     Ø We  prepared  smear  slides  for  examinaIon  of  calcareous   nannofossils  using  standard  techniques  (Bown  and  Young,  1998).   Ø We  examined  samples  using  a  Zeiss  Axioskop  and  a  Zeiss   Axioscope  .A1  microscope  (Fig.  3)  at  1000×  magnificaIon.  Up  to  100   specimens  were  counted  per  slide  to  calculate  relaIve  abundances   of  nannofossil  species.   Ø   Photomicrographs  were  taken  using  a  Spot  camera  (Fig.  3).   Ø The  abundances  of  Gephyrocapsa  and  Coccolithus  are  inversely  related  throughout  much   of  the  record,  suggesIng  that  they  are  responding  in  opposite  ways  to  changes  in  sea-­‐ surface  condiIons.  Since  both  prefer  colder  waters  (e.g.,  Winter  et  al.,  2004),  these   variaIons  may  be  due  to  changes  in  nutrient  availability,  as  G.  muellerae  prefers   eutrophic  condiIons  (e.g.,  Winter  et  al.,  1994;  Boeckel  et  al.,  2006).   Ø Based  on  the  correlaIon  of  the  calcareous  nannofossil  assemblage  data  and  Site  U1418   age  model  to  the  global  oxygen  Isotope  stack  based  on  on  benthic  foraminifera,  we   interpret  that  Geophyrocapsa  is  more  abundant  during  the  last  glacial  maximum  (Marine   Isotope  Stage  2)  and  penulImate  glaciaIon  (Stage  6),  whereas  Coccolithus  pelagicus  and   Cruciplacolithus  have  their  highest  abundances  near  the  end  of  the  last  glacial  cycle   (Marine  Isotope  Stages  3  and  4).   Ø InteresIngly,  very  warm  interglacial  Stage  5  also  has  high  abundances  of  Gephyrocapsa   and  low  abundances  of  Coccolithus,  similar  to  glacial  Stage  6.  More  work  is  needed  to   understand  the  mechanisms  driving  the  variaIons  in  abundance  of  these  taxa.   Ø The  total  abundance  of  nannofossils  decreases  and  is  more  variable  below  100  mbsf  (Fig.  4)   Ø High  abundances  of  Gephyrocapsa  and  low  abundances  of  Coccolithus  occur  from  ~100-­‐250  mbsf  (Fig  4)   Ø   Cruciplacolithus  decreases  below  100  mbsf  (Fig.  4)   Ø Reworked  specimens  are  consistently  present  above  50  mbsf,  with  intermipent  pulses  below  that  depth  (Fig.  4)   Ø Figure  5  shows  the  nannofossil  assemblage  data  compared  to  the  Lisiecki  and  Raymo  (2005)  benthic  oxygen  isotope  stack  using  the  Site  U1418  age  model  to   see  illustrate  the  influence  of  glacial/interglacial  variability  on  the  nannofossil  abundances.       Boeckel,  B.,  Baumann,  K.-­‐H.,  Henrich,  R.,  and  Kinkel,  H.,  2006.  Coccolith  distribuIon  paperns  in  South  AtlanIc  and  Southern  Ocean  surface  sediments   in  relaIon  to  environmental  gradients.  Deep-­‐Sea  Research  I,  1073-­‐1099.   Bown,  P.R.  &  Young,  J.R.  1998.  Techniques.  In:  P.R.  Bown  (Ed.).  Calcareous  Nannofossil  Biostra8graphy.  Kluwer  Academie,  London:  16–28.   Jaeger,  J.M.,  Gulick,  S.P.S.,  LeVay,  L.J.,  Asahi,  H.,  Bahlburg,  H.,  Belanger,  C.L.,  Berbel,  G.B.B.,  Childress,  L.B.,  Cowan,  E.A.,  Drab,  L.,  Forwick,  M.,   Fukumura,  A.,  Ge,  S.,  Gupta,  S.M.,  Kioka,  A.,  Konno,  S.,  März,  C.E.,  Matsuzaki,  K.M.,  McClymont,  E.L.,  Mix,  A.C.,  Moy,  C.M.,  Müller,  J.,  Nakamura,   A.,  Ojima,  T.,  Ridgway,  K.D.,  Rodrigues  Ribeiro,  F.,  Romero,  O.E.,  Slagle,  A.L.,Stoner,  J.S.,  St-­‐Onge,  G.,  Suto,  I.,  Walczak,  M.H.,  and  Worthington,   L.L.,  2014.  Site  U1418.  In  Jaeger,  J.M.,  Gulick,  S.P.S.,  LeVay,  L.J.,  and  the  ExpediIon  341  ScienIsts,  Proc.  IODP,  341:  College  StaIon,  TX  (Integrated   Ocean  Drilling  Program).  doi:10.2204/iodp.proc.341.104.2014   Lisiecki,  L.E.,  and  Raymo,  M.E.,  2005,  A  Pliocene-­‐Pleistocene  stack  of  57  globally  distributed  benthic  d18O  records.  Paleoceanography,  20:PA1003.   Winter,  A.,  Jordan,  R.W.,  and  Roth,  P.H.,  1994.  Biogeography  of  living  coccolithophores  in  oceanic  waters.  In:  Winter,  A.  and  Siesser,  W.G.  (Eds),   Coccolithophores.  Cambridge  University  Press,  Cambridge,  pp.  161-­‐177.       This  project  uses  samples  and  data  provided  by  the  Integrated  Ocean  Drilling  Program.  Funding  for  this  research  comes  from  an  IODP  Post-­‐ExpediIon   Award  to  Leah  LeVay.  This  project  has  been  supported  by  laboratory  equipment  at  IODP  at  Texas  A&M  University.  Special  thank  you  to  Dr.  Leah  LeVay   and  Dr.  Denise  Kulhanek  for  assisIng  and  guiding  me  in  this  project.   Gephyrocapsa  sp.     U1418C-­‐2H-­‐3,  116-­‐120  cm   Coccolithus  pelagicus   U1418C-­‐2H-­‐3,  16-­‐20  cm   Re8culofenstrata  sp.  (reworked)   U1418D-­‐2H-­‐5,  116-­‐120  cm   Gephyrocapsa  muellerae   U1418C-­‐2H-­‐3,  116-­‐120  cm   Figure  6.  Photomicrographs  of  calcareous  nannofossil  taken  from  different  samples.  Pictures  taken  using  a  Spot  camera  on  a  Zeiss  Axioscope.     Figure  4.    VariaIons  in  the  total  abundance  of  nannofossils  and  percentage  abundance  of  different  species  downhole,  ploped  against  the  lithology  of  Site  U1418.   Ø  Future  work  will  include  addiIonal  analyses  and  comparison  to  other  paleoclimaIc   proxies  to  beper  understand  the  Late  Pleistocene  paleoceanography  and   paleoclimate  of  the  region.           Methods   Cruciplacolithus  sp.   U1418C-­‐2H-­‐3,  116-­‐120  cm   Re8culofenstrata  sp.  (reworked)   U1418D-­‐4H-­‐5,  36-­‐40  cm   Re8culofenstrata  sp.  (reworked)   U1418D-­‐2H-­‐5,  116-­‐120  cm   Toweius  sp.  (reworked)   U1418C-­‐2H-­‐3,  116-­‐120  cm   Figure  3.  Zeiss  Axioscope  .A1  microscope  and  Spot  camera  used  for  this  study.   Figure  5.  Benthic  oxygen  isotope  stack  (Lisiecki  and  Raymo,  2005)  (black)  ploped  together   with  percent  abundance  Gephyrocapsa  (blue),  Coccolithus  (red),  and  Cruciplacolithus  (green)   according  to  the  Site  U1418  age  model.  Marine  isotope  stages  are  indicated  at  the  top  and   gray  rectangles  highlight  cold  (glacial)  stages.   Depth(mbsfHoleU1418D) Site U1418 300 275 250 225 200 175 150 125 100 75 50 25 0 I II 4 3 2 1 Lith. unit Graphic lithology Volcanic grain abundance 0 20 40 60 80 100120 Total Nannofossils (counts) 0 20 40 60 80 100 Gephyrocapsa muellerae >3 µm 0 20 40 60 80 100 Gephyrocapsa muellerae <3 µm 0 20 40 60 80 100 Coccolithus (total) 0 20 40 60 80 100 Reworked nannofossils 0 20 40 60 80 100 Cruciplacolithus (total) 0 20 40 60 80 100 Gephyrocapsa (total) Depth(ccsfSiteU1418)