SlideShare a Scribd company logo
1 of 18
Download to read offline
JOURNAL OF QUATERNARY SCIENCE (2005) 20(7–8) 759–776
Copyright ß 2005 John Wiley & Sons, Ltd.
Published online in Wiley InterScience (www.interscience.wiley.com). DOI: 10.1002/jqs.994
The age and extent of tropical alpine glaciation
in the Cordillera Blanca, Peru
DANIEL L. FARBER,1,2
* GREGORY S. HANCOCK,3
ROBERT C. FINKEL1
and DONALD T. RODBELL4
1
University of California, Lawrence Livermore National Laboratory, Livermore, CA, USA
2
University of California, Santa Cruz, Santa Cruz, CA, USA
3
College of William and Mary, Williamsburg, VA, USA
4
Union College, Schenectady, New York, USA
Farber, D. L., Hancock, G. S., Finkel, R. C. and Rodbell, D. T. 2005. The age and extent of tropical alpine glaciation in the Cordillera Blanca, Peru. J. Quaternary Sci.,
Vol. 20 pp. 759–776. ISSN 0267-8179.
Received 17 October 2005; Accepted 18 October 2005
ABSTRACT: Based on new 10
Be data for moraines in the Cordillera Blanca of central Peru, we have
calculated model ages of three sets of Pleistocene glacial moraines. In order of decreasing age, these
are the Cojup, Rurec and Laguna Baja moraines. The oldest moraines occur at the lowest elevations
and yield dates of >400 ka pre-dating the last interglacial and demonstrating that maximum ice
volumes occurred during previous glacial periods, and not at the end of the last glacial. Our new data
from the younger moraines indicate that the end of the last glacial cycle comprised two separate
advances at ca. 29 ka and ca. 16.5 ka, each reflecting significant (>4
C) tropical of cooling at 10
S. These data combined with published records from the Laurentide ice sheet, indicate that climate
instabilities associated with the close of the last glacial were likely global and synchronous in nature.
Copyright ß 2005 John Wiley  Sons, Ltd.
KEYWORDS: palaeoclimate; tropical glaciation; geochronology; cosmogenic; radionuclides; Andes.
Introduction
High-resolution isotopic studies of ice cores (Dansgaard et al.,
1993), sediments (Bond and Lotti, 1995; Broecker, 1994;
Linsley, 1996) and corals (Fairbanks, 1989; Guilderson et al.,
1994) have demonstrated that the last glacial period was a time
of dramatic climate instability. The precise timing and the glo-
bal distribution of climate fluctuations yield information about
the dynamics of the ocean–atmosphere system that can contri-
bute to understanding the causes of global climatic change
(Broecker and Denton, 1994). However, most climate records
are derived from mid- to high-latitude regions, and therefore
the nature of climate change in the tropics and the degree to
which the climate of the tropics mirrors that of temperate
regions remains the subject of debate.
Although moraines provide a detailed record that may be
useful in developing records of local climate change (Gillespie
and Molnar, 1995), obtaining accurate ages on depositional
features such as moraines is often difficult. Recently, in-situ-
produced cosmogenic radionuclides (CRN) have proved to
be a powerful tool for precisely dating such deposits (e.g.
Phillips et al., 1997). Here we use in-situ-production of 10
Be
to date Pleistocene moraines of the western Cordillera Blanca
in Peru in order to develop a detailed chronology of alpine
glacier fluctuations in the southern tropics during the
Quaternary. Because the low altitude limit of glaciers in this
region is a sensitive function of temperature (Lliboutry et al.,
1977), past glacier extent recorded by moraines can serve as
an indicator of palaeotemperature fluctuations at this latitude.
In addition, central Peru’s climate is strongly affected by global
atmospheric patterns through the influence of the Southern
Oscillation on the Amazon basin immediately to the east
(Martin et al., 1993) while northern Peru is affected by fluctua-
tions of the Intertropical Convergence Zone. Thus, the Pleisto-
cene history of alpine glacier fluctuations in the Cordillera
Blanca, Peru, can be used to address the timing of both global
and regional climatic change.
Detailed mapping by Clapperton (1972, 1981) delineated
three Pleistocene moraine groups in the Cordillera Blanca: (1)
relatively fresh lateral and terminal moraines marking the most
recent extensive advance; (2) a set of older ‘pre-Wisconsinan’
moraines, and (3) a older set of highly diffused, discontinuous
moraines. The classification was further refined by Rodbell
(1993a) into four groups based on the height of rock weathering
posts, soil development and 14
C dates. In order of increasing
age, Rodbell (1993a) identified the Manachaque, Laguna Baja,
Rurec and Cojup moraines. 14
C age constraints on these
moraines were obtained from peat deposits in the Rio Negro
drainage ca. 10 km south of our study area (Rodbell, 1993a).
The minimum-limiting age of the Manachaque and Laguna
Baja moraines is 15 860 Æ 290 cal. yr BP (recalculated from
13 280 Æ 190 yr BP in Rodbell (1993a) to calibrated 14
C ages
in calendar years (cal. yr BP); Stuiver and Reimer, 1993). This
age was obtained from organic material collected from peat
in a lake sediment section exposed inside the oldest Manacha-
que moraine. The minimum age of the Rurec moraines is
* Correspondence to: Daniel L. Farber, University of California, Lawrence Liver-
more National Laboratory, Livermore, California, USA; University of California,
Santa Cruz, Santa Cruz, California, USA. E-mail: farber2@llnl.gov
derived from basal organic matter from sediment cores within
bogs dammed behind Rurec moraines (Rodbell, 1993a). Two
dates were obtained, one from the Rio Negro drainage
(21 480 Æ 410 cal. yr BP), and the second from a drainage at
the southern end of the range (ca. 30 km south of our field area)
(ca. 24 ka cal. yr BP using the calibration of Kitagawa and van
der Plicht (1998)). The degree to which these dates underesti-
mate the true moraine age could not be determined by Rodbell
(1993a, 1993b).
In this paper, we report the results of direct dating of the LGM
and older moraines in the central Andes using the CRN 10
Be.
We seek to address the following questions using these dates.
(1) What do moraine ages suggest about the precise timing of
maximum glaciation in the tropical central Andes? (2) How
synchronous were glacial advances in the central Andes with
other regional and global glacial advances during the LGM?
(3) What does this comparison suggest about the linkages
between tropical climate events and those of higher latitudes?
Recently, the application of CRN exposure age dating has
greatly increased in a number of areas including burial
dating of sediments, neotectonics, quantifying rates of soil
production and palaeoclimatlogy (Chevalier et al., 2005;
Heimsath et al., 1997, 1999; Smith et al., 2005). However, of
these its application to palaeoclimatology remains at some
level quite difficult. To be useful in comparing palaeoclimate
records, CRN dating requires accuracies approaching Æ 5%
to allow comparison with other records from different regions
and calibrated over different timescales (i.e. 14
C, U/Th). This
study presents one of relatively few attempts to quantitatively
compare palaeoclimate records in the tropics to the higher lati-
tudes. As the methods by which we determine CRN ages in this
low-latitude setting are critical in assessing the accuracy of the
comparison of our chronology to others, we start with a
detailed discussion of the methodology we use to obtain expo-
sure ages.
Cosmogenic radionuclide dating methods
Sample collection and processing
We have determined the time of glacial retreat by measuring
the concentration of 10
Be in quartz extracted from moraines
classified as Laguna Baja, Rurec and Cojup deposits by Rodbell
(1993a). Our samples were collected northeast of Huaraz from
moraines emanating from the quebradas (valleys) of Llaca and
Cojup and southeast of Huaraz from moraines extending out
from the Quebrada Queshque (Fig. 1; Rodbell, 1993a). In both
locations, moraines equivalent to the Laguna Baja, Rurec and
Cojup deposits are well preserved, and are littered with gla-
cially deposited boulders of granite and, in some cases, quart-
zite, with boulder sizes ranging up to 1–4 m in diameter. As the
only source for the granite and quarzite boulders is from within
the Cordillera Blanca proper their presence in moraines ema-
nating from the range indicates glacial transport to their current
position. The proximity of our locations to the type-locale
Figure 1 Location of the Cordillera Blanca. The landsat image shows the Cordillera Blanca and some of the major peaks. The city of Huaraz is shown
in the centre of the image. Labelled are the areas referred to in the text. These include, from north to south, Quabradas and Llaca, Cojup, the Rio Negro
drainage and Quebrada Queshque
760 JOURNAL OF QUATERNARY SCIENCE
Copyright ß 2005 John Wiley  Sons, Ltd. J. Quaternary Sci., Vol. 20(7–8) 759–776 (2005)
where Rodbell (1993a) obtained minimum limiting ages for
these moraines provides confidence in using the same classifi-
cation of these moraines, and allows use of the same minimum
limiting ages as derived by Rodbell (1993a). In order to reduce
possible error arising from variable erosion histories or sedi-
ment coverage, we collected large samples of ca. 2 kg of intact
rock from the top 5 cm of large granitic and quartzite boulders
(greater than ca. 1 m in diameter) located on stable slopes near
moraine crests. Quartz was extracted from the samples follow-
ing a modification of Kohl and Nishiizumi (1992). Isolation of
10
Be from quartz was followed by measurement of the ratios
10
Be/9
Be by accelerator mass spectrometry (AMS) at Lawrence
Livermore National Laboratory. The sample characteristics and
measured 10
Be concentrations are given in Tables 1–3.
Table 1 Locations and analytical results for samples collected in Quebrada Rurec
Samplea
Size Latitude Longitude Altitude Scaling Depth/ 10
Be production [10Be] 10
Be 10
Be
(m) (deg S) (deg W) (m) factorb
topography rate [10Be] uncertainty exposure exposure
correction (at gÀ1
yrÀ1
)c
(105
at gÀ1
) (105
at gÀ1
) age (yr)d
age error (yr)
HU-41 1 9.651 77.361 4045 7.26 0.98 38.70 4.59 0.11 11 800 290
HU-43 0.5 9.651 77.361 4045 7.26 0.98 38.70 4.40 0.20 11 340 530
PE98RU-43a 1 9.651 77.361 4045 7.26 0.98 38.70 5.04 0.18 13 160 460
PE98RU-43b 1 9.651 77.361 4045 7.26 0.98 38.70 4.84 0.17 12 590 450
PE98RU-C41 1 9.651 77.361 4045 7.26 0.98 38.70 4.10 0.16 10 430 420
PE98RU-C42 1 9.651 77.361 4045 7.26 0.98 38.70 4.18 0.14 10 650 370
PE98RU-C44 0.5 9.653 77.365 4045 7.26 0.98 38.70 4.88 0.16 12 670 420
PE98RU-C45 1 9.652 77.365 4045 7.26 0.98 38.70 4.18 0.15 10 660 390
a
All the boulders sampled on this surface were composed of quartzite. Samples of same number with ‘a’ and ‘b’ designations were split after quartz
isolation from the sampled material.
b
Altitude and latitude corrections based on Stone (2000).
c
Assumes a sea-level, high-latitude production rate of 5.44 atoms 10
Be per gram of quartz per year.
d
Incorporates correction for magnetic field variation using palaeointensity data from Ohno and Hamano (1992), McElhinny and Senanayake (1982)
and the SINT-800 record.
Table 2 Locations and analytical results from Group 1 and 2 moraines, Quebradas Cojup and Llaca
Samplea
Latitude Longitude Altitude Scaling Depth/topography 10
Be [10Be] 10
Be 10
Be
(deg S) (deg W) (m) factorb
correction11 production rate [10Be] uncertainty exposure exposure
(at gÀ1
yrÀ1
)c
(105
at gÀ1
) (105
at gÀ1
) age (yr)d
age error (yr)
Group 1 (Laguna Baja)
GV-22 9.831 77.306 4212 7.84 0.98 41.80 8.05 0.19 19 460 470
GV-23 9.831 77.306 4182 7.74 0.97 40.84 6.29 0.46 15 530 1140
GV-24 9.831 77.307 4157 7.65 0.98 40.78 5.92 0.14 14 690 350
K-13 9.488 77.474 3787 6.42 0.98 34.23 4.83 0.23 14 230 670
K-6a 9.478 77.468 3963 6.98 0.98 37.21 5.62 0.21 15 240 580
K-6b 9.478 77.468 3963 6.98 0.98 37.21 5.64 0.27 15 280 730
K-8a 9.477 77.468 4008 7.13 0.98 37.21 6.06 0.30 16 070 790
K-8b 9.477 77.468 4008 7.13 0.98 38.01 6.02 0.27 15 970 730
K-9 9.491 77.461 3782 6.4 0.98 38.01 5.06 0.28 14 940 830
P98GV-C19 9.830 77.304 4206 7.82 0.98 34.12 5.00 0.31 11 940 750
P98GV-C20 9.830 77.304 4206 7.82 0.98 41.69 5.43 0.14 13 080 340
P98GV-C21 9.830 77.304 4206 7.82 0.98 41.69 5.33 0.24 12 830 580
Group 2 (Rurec)
HU-1 9.486 77.453 4016 7.15 0.96 37.34 7.14 0.21 19 240 580
HU-2 9.486 77.453 4002 7.11 0.96 37.13 6.74 0.16 18 280 430
HU-4 9.486 77.452 3984 7.05 0.96 36.82 6.96 0.17 19 050 470
K-1 9.485 77.464 3830 6.55 0.98 34.92 10.20 0.70 28 410 1900
K-10 9.493 77.461 3816 6.51 0.98 34.71 10.51 0.43 29 330 1200
K-2 9.484 77.471 3817 6.51 0.98 34.71 5.77 0.59 16 730 1700
K-3 9.486 77.480 3729 6.24 0.98 33.27 6.73 0.30 20 330 890
K-4 9.484 77.476 3848 6.61 0.98 35.24 6.52 0.31 18 620 890
K-5a 9.479 77.473 3885 6.73 0.98 35.88 8.65 0.41 23 610 720
K-5b 9.479 77.473 3885 6.73 0.98 35.88 8.53 0.26 23 920 1100
K-7 9.477 77.468 4008 7.13 0.98 38.01 6.41 0.29 16 980 780
Peru-18 9.492 77.460 3749 6.3 0.98 33.59 5.69 0.18 17 040 550
Peru-21 9.488 77.454 3840 6.58 0.98 35.08 6.84 0.26 19 600 740
a
Samples of same number with ‘a’ and ‘b’ designations were split after quartz isolation from the sampled material.
b
Altitude and latitude corrections based on Stone (2000).
c
Assumes a modern instantaneous sea-level, high-latitude production rate of 5.44 atoms 10
Be per gram of quartz per year.
d
Incorporates correction for magnetic field variation using palaeointensity data from Ohno and Hamano (1992), McElhinny and Senanayake (1982)
and the SINT-800 record.
TROPICAL ALPINE GLACIATION IN THE CORDILLERA BLANCA, PERU 761
Copyright ß 2005 John Wiley  Sons, Ltd. J. Quaternary Sci., Vol. 20(7–8) 759–776 (2005)
Table3Locationandanalyticalresultsforpre-LastGlacialMaximummoraines,QuebradasCojupandQueshgue
Samplea
LatitudeLongitudeAltitudeScalingDepth/topography10
Beproduction[10Be][10Be]uncertainty10
Beexposureage10
Beexposureage10
Beexposureage10
Beexposureage
(degS)(degW)(m)factorb
correctionrate(atgÀ1
yrÀ1
)c
(105
atgÀ1
)(105
atgÀ1
)(1mMaÀ1
)(yr)d
error(yr)(0mMaÀ1
)(yr)e
error(yr)
K-12a9.49477.46338906.740.9835.9348.001.7813360050001185004400
K-12b9.49477.46338906.740.9835.9351.181.5014560043001259003700
PE-98–9819.82177.36740607.310.9838.97172.004.897824002400044130013000
PE-98–9829.82177.36740607.310.9838.9774.601.7820700050001755004200
Peru-19.50277.46336886.120.9832.63142.634.358698002500043850013000
Peru-109.50577.46636425.980.9831.8870.392.7823730094001993007900
Peru-129.49577.46437296.240.9833.2764.721.4721040048001796004100
Peru-139.49677.46437506.30.9833.5963.611.8320540059001742005000
Peru-169.49477.46338136.50.9834.6528.730.78859002300763202100
Peru-39.50477.46436886.120.9832.6380.390.9228530033002252002600
Peru-49.50477.46436886.120.9832.6357.991.6218620052001623004500
Peru-59.50577.46636425.980.9831.8861.680.7319730024001786002100
Peru-69.50577.46636425.980.9831.8830.191.05907803100881903100
Peru-79.50577.46636425.980.9831.8871.571.4824320050002031004200
Peru-89.50577.46636275.940.9831.6769.832.5523440086001993007300
Peru-99.50577.46636275.940.9831.6768.381.5822660052001951004500
a
Samplesofsamenumberwith‘a’and‘b’designationsweresplitafterquartzisolationfromthesampledmaterial.
b
AltitudeandlatitudecorrectionsbasedonStone(2000).
c
Assumesamoderninstantaneoussea-level,high-latitudeproductionrateof5.44atoms10
Bepergramquartzperyear.
d
Assumesanerosionrateof1mMaÀ1
,andincorporatescorrectionformagneticfieldvariationusingpalaeointensitydatafromOhnoandHamano(1992),McElhinnyandSenanayake(1982)andtheSINT-800record.
e
Assumesanerosionrateof0,andincorporatescorrectionformagneticfieldvariationusingpalaeointensitydatafromOhnoandHamano(1992),McElhinnyandSenanayake(1982)andtheSINT-800record.
762 JOURNAL OF QUATERNARY SCIENCE
Copyright ß 2005 John Wiley  Sons, Ltd. J. Quaternary Sci., Vol. 20(7–8) 759–776 (2005)
Model age calculations
Translating the 10
Be concentrations into model ages requires
corrections for the horizon blockage (e.g. topographic shield-
ing), sample thickness, latitude, altitude, palaeomagnetic field
variations and local atmospheric effects. We have used a
methodology developed by two of the authors (Farber and
Finkel) in order to correct radionuclide production rates for
these effects (Lal, 1991; Nishiizumi et al., 1989). Much of
the physics behind the corrections has been treated in some
detail in Gosse and Phillips (2001), but our calculations involve
several new numerical routines that we describe in detail
below.
Horizon blockage
Horizon blockage can be considered a modification factor to
the production rate that is the ratio of the actual cosmic ray flux
incident on a surface to the expected flux if the surface were
horizontal and had full sky exposure (e.g. 2 steradians sky
exposure). To calculate this factor we numerically integrate
over the entire exposure geometry of the sample. We treat
two types of horizon blockage in our model: (1) horizon shield-
ing arising from a dipping sample surface (i.e. self-shielding)
and (2) shielding due to topography blocking the horizon. To
account for self-shielding due to dip, we assume that the sam-
ple was taken from an infinite half-space (Fig. 2) with strike
(azimuth measured from north) s and dip (angle below the hor-
izon) d (here the direction of dip is defined as s þ ð=2ÞÞ. Thus,
the horizon due to the plane is given by:
 ¼ tanÀ1
tan dð Þsin  À s þ ð Þð Þ½ Š 8 s þ    s þ 2
 ¼ 0 8 s    s þ 
ð1Þ
where  is the apparent horizon in the azimuth direction 
(measured from north). For the topographic shielding, we mea-
sure the azimuth and angle above the horizontal to all signifi-
cant elevation maxima and minima in the topography
surrounding the sample site. Using this data, we create a syn-
thetic horizon by calculating the elevation angle measured
from the horizontal, ðÞ, at 1
increments by interpolating
between the field measurements of the topography surrounding
the sample site. The incident cosmic ray flux through any sur-
face is a strong function of and is only weakly dependent on
azimuth angle, . Thus, for our calculations, we ignore the
small east–west asymmetry in the cosmic ray flux. The depen-
dence of cosmic ray flux on elevation angle arises due to the
variation in atmospheric depth through which incoming radia-
tion must pass. The atmospheric depth is greatest for neutrons
travelling along trajectories near the horizontal and smallest in
the zenith direction. The actual angular distribution of cosmic
radiation is given by
F ð Þ ¼ F0 sin2:3
 ð2Þ
where F is the intensity of the cosmic radiation at the elevation
angle  (measured from the horizontal) and F0 is the maximum
intensity (at the zenith) (Lal, 1958; Nishiizumi et al., 1989).
Because this exponent is derived from a fit to experimental data
collected with fixed aperture cosmic ray telescopes, the actual
flux at any elevation must be corrected with an additional cos 
term to account for the decrease in the solid angle as the zenith
is approached.
Figure 2 Diagram showing the geometry of the shielding calculations. Â and  are the azimuth and elevation angles respectively. The plane is
recorded as a strike and a dip (labelled ) is described numerically by the normal vector P(s,d). f (Â,) is the direction vector for the cosmic ray flux.
É() is the elevation angle of the topography in the direction 
TROPICAL ALPINE GLACIATION IN THE CORDILLERA BLANCA, PERU 763
Copyright ß 2005 John Wiley  Sons, Ltd. J. Quaternary Sci., Vol. 20(7–8) 759–776 (2005)
One additional effect arises because the cosmic-ray flux
impinging on a horizontal surface from inclinations less than
=2 (i.e., the zenith) will be distributed over a larger surface
area. When calculating the cosmic-ray flux through a unit sur-
face area, this foreshortening factor is given by the cosine of the
angle between the normal to the plane and the vector defining
the cosmic ray flux. In the general case of a dipping plane, the
pole to this surface is given by the vector
P s; dð Þ ¼ sin sð Þ sin dð Þ; Àcos sð Þ sin dð Þ; cos dð Þð Þ ð3Þ
and the vector defining the cosmic ray flux is
f ; ð Þ ¼ cos cos; cos sin; sinð Þ ð4Þ
The total foreshortening factor is given by Pðs; dÞ  f ð; Þ. The
total cosmic ray flux though the unit surface is given as
Âf ð; ðÞÞ
¼
X2
¼0
X=2
¼maxð; ðÞÞ
FðÞ sinðÞP s; dð Þ  f ð; Þ d d
ð5Þ
The Equation (5) summation is performed numerically on the
synthetic horizon determined from field data at 1
increments,
with the lower elevation limit at each value of  being set equal
to the greater of the values for the apparent dip angle
and the angle to shielding topography, represented by
maxð; ðÞ (Fig. 2). In the simple case of unshielded, 2 expo-
sure on a horizontal surface, the cosmic ray flux though the unit
surface is given as
Â0ð; Þ ¼
X2
¼0
X=2
¼0
FðÞ sinðÞ d d ð6Þ
The shielding factor S is then calculated,
S ¼
Âf
Â0
ð7Þ
Depth correction
Because CRN production declines as a function of depth due to
the attenuation of the neutron flux with depth, we must take
into account the sample thickness to arrive at an estimate
for the average production rate for our samples. The depth-
dependence of the cosmic ray flux is given by
Fd
¼ Fd
0 exp Àmxð Þ ð8Þ
where Fd
is the flux at depth x (cm), Fd
0 is the flux at x ¼ 0, and
m ¼ /Ã, where  is the density (g cmÀ3
) and à is attenuation
length (g cmÀ2
). Typically, a value close to 155 (g cmÀ2
) is used
for à in rocks near the surface where fast nucleon production
dominates (see Gosse and Phillips, 2001). However, this is in
fact an apparent value that is only appropriate for a vertical sec-
tion on a horizontal surface with 2 exposure. For the numer-
ical calculation performed here, one must determine the actual
attenuation length along the path travelled by a cosmic ray.
In order to determine the actual attenuation length for neu-
trons travelling along a linear path in, we have performed simu-
lations for full 2 exposure on a horizontal surface as a function
of depth. These calculations yield a best-fit attenuation length
of 205 g cmÀ2
(Fig. 3). The direct numerical approach taken
here allows us to easily account for the affects on production
at depth due to topographic shielding and surface dip. In gen-
eral, increasing dip results in lowered production as a function
Figure 3 The depth dependence of the radionuclide production. The dashed line is our numerical calculation using an attenuation length of
204 g cmÀ2
and the solid line is the analytical result using 155 g cmÀ2
764 JOURNAL OF QUATERNARY SCIENCE
Copyright ß 2005 John Wiley  Sons, Ltd. J. Quaternary Sci., Vol. 20(7–8) 759–776 (2005)
of depth (Fig. 4). While these changes can be accounted for
explicitly in an analytical approach (Gosse and Phillips,
2001, eq. 3.73), they fall out of the numerical calculations
directly.
To account for samples of finite thickness, we calculate
Equation (7) at several depth intervals along a direction given
by Pðs; dÞ and then calculate the mean of these values. We
note that presently we are limited to calculations that assume
a constant density over the sample thickness.
Latitude and altitude scaling
The production of CRN in a rock surface depends on both the
altitude and the latitude, and therefore a site-specific produc-
tion rate must be known to calculate a model age. Because
there is little latitudinal variation in the production rate above
a latitude of ca. 60
(Lal, 1991; Dunai, 2000), we commonly
use a sea-level high-latitude production rate (SLHL) as a refer-
ence and a set of latitude and altitude scaling factors to calcu-
late the local production at any point on the globe. Calibration
of the SLHL production rate of CRNs has typically come from
measuring the radionuclide abundance in a surface of known
age and calculating the production rate directly. In order to cal-
culate the SLHL production rate from a site located at a latitude
below 60
, a set of scaling factors must be used and thus the
two previously independent models (the SLHL and the scaling
factors) are necessarily linked in all future applications. This
results in a unique SLHL for each different set of scaling factors.
Recently, Stone (2000) has suggested the best-fit value to all the
estimates of the SLHL value is 5.1 Æ 0.3 atoms gÀ1
yrÀ1
for 10
Be
using a muon contribution based on the results of Heisinger
et al. (1997). However, as our sites are at low latitudes and high
altitudes, they represent areas that are far from the SLHL refer-
ence and our model ages are thus quite sensitive to the SLHL
and scaling factors used. Thus, we have also evaluated the
model of Dunai (2000) together with the muon contribution
from Heisinger et al. (1997) and a best-fit SLHL value of
4.99 atoms gÀ1
yrÀ1
(J. Stone, pers. comm., 2002). Our calcula-
tions utilise a spallation fraction of the total nuclide production
at sea level of 0.97. For scaling the muon production we have
assumed that the latitude effect is the same as in the case of
spallation and scale for altitude using an attenuation length
of 247 (g cmÀ2
).
Corrections for variations in the geomagnetic field
We correct for the variations in palaeomagnetic intensity using
the palaeomagnetic correction schemes from Nishiizumi et al.
(1989), with modifications to the original method in order to
treat sites near the equator. This treatment is essentially the
same as that proposed by Dunai (2001). We use the palaeo-
magnetic records from Guyodo and Valet (1999) and McEl-
hinny and Senanayake (1982), and the Holocene magnetic
pole positions from Ohno and Hamano (1992). Essentially,
Nishiizumi et al. (1989) generate a time series record of effec-
tive palaeolatitudes from the palaeomagnetic records using the
relationship
coseffpalaeolat ¼
M
M0
 1=4
cosmagcolat ð9Þ
where leffpalaeolat is the effective palaeolatitude, M is the geo-
magnetic dipole moment at time t, M0 is the present-day geo-
magnetic dipole moment and llat the geographic latitude for
Figure 4 The depth-dependence of the radionuclide production as a function of dip. The subsurface production is shown in 10
intervals from 1
to
81
as determined from numerical simulations. Here an attenuation length of 205 g cmÀ2
was used in all the calculations
TROPICAL ALPINE GLACIATION IN THE CORDILLERA BLANCA, PERU 765
Copyright ß 2005 John Wiley  Sons, Ltd. J. Quaternary Sci., Vol. 20(7–8) 759–776 (2005)
the sample site at time t. For times younger than 10 kyr, we use
the palaeomagnetic colatitude instead of the geographic lati-
tude. The palaeomagnetic colatitude (lmagcolat) is calculated
using the spherical trigonometric law of cosines for sides giving
cosmagcolat ¼ cosb cosc þ sinb sinc cosA ð10Þ
where b is latitude of the palaeopole, c is latitude of the sample
site and A is the difference between the longitude of the palaeo-
pole and the longitude of the sample site. From this time series
of effective palaeolatitudes, one can derive a time series of
effective palaeo-production rates using a set of latitude and alti-
tude scaling factors.
While this is straightforward for sites at latitudes greater than
ca. 15
, nearer to the equator the record of the geomagnetic
field as a function of time indicates that there were periods of
higher geomagnetic field than at present, some of which would
imply negative effective latitudes. In order to avoid this diffi-
culty for all past time intervals where the palaeomagnetic
records generate negative values of the effective palaeolati-
tudes, we take the following approach. We transform the scal-
ing factors to functions of vertical threshold rigidity using
Pc ¼
M
4r2
e
cos4
l ð11Þ
from Sandstro¨m (1965) where M is the dipole moment and re is
the radius of the Earth and ll is the latitude. We note that this
equation only holds for a dipole and thus neglects any higher-
order terms in the spherical harmonic expansion of the Earth’s
magnetic field. However, this simplification is not necessarily
detrimental. In fact, past palaeomagnetic records of the Earth’s
magnetic field are typically stacked records from sites around
the globe and thus tend to average out the higher-order terms
and more closely represent an average dipole. Today, except in
special locations (see Dunai, 2001), the best representation
we have of the palaeomagnetic field is a dipole. Equation
(11) can easily be transformed to give the threshold rigidity
for a past time using a normalised palaeomagnetic record using
the relation
PcðtÞ ¼ P0
MðtÞ
M0
cos4
l ð12Þ
where P0 is the modern threshold rigidity at the magnetic equa-
tor, M0 is the modern dipole moment and t is time. Using this
function and our transformed scaling factors we can extrapo-
late scaling factors to threshold rigidities above modern thresh-
old rigidity at the magnetic equator. Performing this calculation
for all the time intervals in the past where the palaeomagnetic
records generate negative effective palaeolatitudes we con-
struct a time series of production rates at the sample site. This
sequence is then used to generate a time series of nuclides pro-
duced in the time interval represented by each palaeomagnetic
observation PðtÞÁtà where t* is the interval of time correspond-
ing to P(t). We then calculate time series of nuclide remaining
at the present from time t using
Np 0; tð Þ ¼ P tð ÞÁtà exp À  þ ð Þtð Þ ð13Þ
where l is the decay constant for 10
Be and  is the steady-state
erosion rate in centimetres per year. From this age-weighted
time series, we calculate the cumulative radionuclide abun-
dance present today for all ages and finally interpolate into this
time series to calculate the final calibrated age. We have tested
the stability of this numerical procedure on a synthetic time ser-
ies with no fluctuations in the intensity of the magnetic field
and calculate values to within ca. 3% of the analytical result.
One important note here concerns the SLHL production rate
used in conjunction with the palaeomagnetic corrections. The
SLHL production rates derived from geologic calibration sites
may or may not have added corrections for palaeomagnetic
field variations over the time of exposure. For instance, if we
use our algorithm with the Stone (2000) SLHL production of
5.1 Æ 0.3 atoms gÀ1
yrÀ1
for 10
Be and apply it to the raw data
from the Sierra Nevada calibration sites of Nishiizumi et al.
(1989) we will not recover the correct exposure time. Thus,
in order to use this type of palaeomagnetic correction, we must
determine the instantaneous modern SLHL production rate. We
define the instantaneous modern SLHL production rate as the
value that gives the correct exposure ages of the geologic
calibration sites after correcting for fluctuations in the geomag-
netic field over time. To this end, we have used the data set of
Nishiizumi et al. (1989) and the deglaciation age of Clark and
Gillespie (1997) to calculate the instantaneous modern SLHL
production rate for use with our palaeomagnetic correction
algorithm. We have chosen this dataset as it is of high quality
and has undergone many subsequent tests in this area, and is at
a latitude where the effects of changes in field strength are quite
strong. The best-fit values are 5.44 10
Be atoms gÀ1
yrÀ1
for the
correction factors of either Lal (1991) or Stone (2000) or 5.29
10
Be atoms gÀ1
yrÀ1
for the correction factors of Dunai
(2001). These values are 5% and 6% respectively higher than
the values used in the non-magnetic corrected scheme and
reproduce the uncorrected sample ages to better than 2%.
For the data presented here, we have used the Stone (2000) for-
mulation of the production rates and a modern instantaneous
production rate of 5.44 10
Be atoms gÀ1
yrÀ1
for calculations
of CRN model age.
While the palaeomagnetic records continue to be revised
with continued research, there is no doubt that changes in
the magnetic field over the period of exposure of most samples
have effected the production of CRNs. Thus, we feel it war-
ranted to make a reasonable attempt to account for these
changes. These corrections have now become a somewhat
standard procedure (Shanahan and Zreda, 2000; Dunai,
2001; Balco et al., 2002; Barrows et al., 2002; Desilets and
Zreda, 2003) and while we are sure that changes in the state
on knowledge of the palaeomagnetic records will effect the
absolute value of the ages we calculate, using the records
and algorithms we present here puts the reported ages on a
common basis with a number of other laboratories around
the world.
Corrections for local atmospheric effects
The altitude scaling factors of Lal (1991) are limited because
they are fitted as a function of altitude incorporating a standard
atmosphere. Subsequent efforts in deriving scaling factors have
instead been based on atmospheric depth (Dunai, 2001;
Desilets and Zreda, 2003). Although these incorporate a stan-
dard atmosphere model in the published equations, they are
not limited to these values. Stone (2000) pointed out that
long-term deviations from the standard atmospheric air pres-
sure by 20–40 hPa over Antarctica results in an underestima-
tion of the production rate and thus an overestimate of the
age of Antarctic samples. So, one must take account of such
effects elsewhere on the planet. The atmospheric conditions
above the central Andes are influenced by the hyper-arid
coastal desert, which has a strong but seasonally varying atmo-
spheric inversion. Figure 5 shows atmospheric data from sta-
tions in the Andean highlands together with the standard
atmosphere model (Johnson, 1976), illustrating that the Andean
stations deviate significantly from the standard atmospheric
model. The best fit to the Andean data gives a model with a
766 JOURNAL OF QUATERNARY SCIENCE
Copyright ß 2005 John Wiley  Sons, Ltd. J. Quaternary Sci., Vol. 20(7–8) 759–776 (2005)
mean sea-level pressure of 1012.8 mbar, an adiabatic lapse
rate of 6.5 mK mÀ1
and a mean sea level temperature of
301.73 K. The effect of the inversion is to raise the air tempera-
ture with increasing elevation to the top of the inversion layer at
between ca. 800 and 1500 m; from this level and above, the
central Andean atmosphere can be modelled with a relatively
standard adiabat. Thus, to model the high central Andes (above
the elevation effected by the coastal inversion which is ca.
1500 m) the best-fit model uses sea-level temperature, which
is effectively the extrapolated value of the measured high-
elevation temperature versus pressure curve. This value
(301.73 K) can then be used with one of the commonly used
equations such as that adopted by the International Civil
Aviation Organization (ICAO) (Dunai, 2001)
p zð Þ ¼ p0 1 À
0h
T0
  g0
Rd
0
ð14Þ
where p(z) is the pressure at altitude h, p0 is the pressure at
sea,
0 the adiabatic lapse rate, T0 the sea-level temperature
(in kelvins), g0 the standard sea-level gravitational acceleration
(9.80665 m sÀ2
) and, Rd the gas constant (287.05 J kgÀ1
KÀ1
).
It is possible to have tong-term variations in the atmospheric
conditions due to global climate fluctuations or tectonic
effects. However, the regional effects that give rise to the differ-
ences between the central Andean atmosphere and the stan-
dard model arise from a combination of factors including
high insolation, a topographic barrier and abnormally cold
water off the coast. These regional climatic factors have been
long lived (Alpers and Brimhall, 1988; Dunai et al., 2005)
and thus it is likely that our model is applicable for at least
the Quaternary.
Validation of the model age calculations
We validate the model age calculations using a nearby location
with a well-documented chronology based on 14
C dating. First,
we briefly review the chronology presented by Rodbell and
Seltzer (2000) for Glacial Lake Breque, located approximately
20 km south of our sample locations, and present our new CRN
data in order to test the validity of our model ages.
Within the Rio Negro drainage (Fig. 1), exposures of Late
Pleistocene sediments record a geologic history of glacial
deposition followed by lacustrine sedimentation later capped
by glacio-fluvial outwash. The most distal portions of the sec-
tion contain peat beds that are interbedded with horizontally
laminated silt and clay. Radiocarbon dates on two of the peat
beds provide maximum-limiting age constraints for the deposi-
tion of the massive gravel that is seen throughout much of the
eastern part of Glacial Lake Breque. Bulk peat below the gravel
yielded a radiocarbon age of 13 280 Æ 190 14
C yr BP and
macrofossils higher in the peat section yet still below the gravel
yielded an accelerator mass spectrometry (AMS) radiocarbon
age of 11 280 Æ 110 14
C yr BP. Deposition of the gravel thus
Figure 5 Air pressure versus altitude for sites in the central Andes. The standard atmosphere is calculated assuming a sea-level pressure of 1013.25mbar,
an adiabatic lapse rate of 6.5 mKmÀ1
and a sea-level temperature of 288.15 K. The upper curve is our best-fit to the Andean data and is calculated using
sea-level pressure of 1012.8mbar, an adiabatic lapse rate of 6.5mKmÀ1
and a sea-level temperature of 301.73 K. Note that all the sea-level sites are well
described by the standard sea-level pressure but the high altitudes deviate from the standard model. This suggests that the high-altitude sites can be fitted
with a non-standard sea-level temperature. We note, however, that this model is only good for sites above seasonal inversion level
TROPICAL ALPINE GLACIATION IN THE CORDILLERA BLANCA, PERU 767
Copyright ß 2005 John Wiley  Sons, Ltd. J. Quaternary Sci., Vol. 20(7–8) 759–776 (2005)
occurred after ca. 11 300 14
C yr BP. Minimum limiting ages are
provided from lake cores taken up-valley of the moraine mark-
ing the up-valley margin of the palaeolake basin. Plant macro-
fossils from the base of a ca. 6 m deep bog, ca. 1.5 km up-valley
from the palaeolake basin, yielded an AMS radiocarbon age of
10 990 Æ 60 14
C yr BP (Rodbell and Seltzer, 2000).
These data led Rodbell and Seltzer (2000) to propose the fol-
lowing geologic history of the site. The glacier reached the
confluence of the Rio Negro and Quebrada Rurec valleys
ca. 18 000 14
C yr BP (Rodbell, 1993b). It then retreated at least
3 km from this position and deposited the late glacial moraine
prior to ca. 13 300 14
C yr BP. The ice front then retreated at
least several kilometres up-valley, allowing the formation of
Glacial Lake Breque behind the late glacial moraine. A glacial
readvance culminated between 11 280 and 10 990 14
C yr BP or
between 13 250 and 13 071 cal. yr BP.
The tight chronology presented by Rodbell and Seltzer
(2000) led us to sample the late glacial moraine that dammed
the lake for CRN analysis. The moraine (Fig. 6) is well pre-
served with steep sides and little evidence of significant post-
deposition denudation. The moraine crest is strewn with
boulders; however, the typical size is ca. 1 m in diameter with
a few in the 2 m range. Within the upper Rio Negro drainage,
the crystalline bedrock of the Cordillera Blanca is composed
predominantly of the Jurassic Chicama formation with few
exposures of the Miocene granitoid batholith (McNulty et al.,
1998). The boulders along the moraine are almost solely gra-
phite-bearing quartzite probably derived from the metamor-
phosed Chicama schists near the contact with the batholith.
Figure 7 shows the distribution of boulder ages (Table 1) we
calculate from samples taken along the ridge crest. Applying
the model discussed above and using the latitude and altitude
scaling factors of Lal (1991) as recast by Stone (2000), we cal-
culate an apparent mean age of 12.1 þ 1 kyr BP. Using the lati-
tude and altitude scaling factors of Dunai (2000) we calculate
an apparent mean age of 11.2 Æ 0.9 kyr BP. If we take the age of
ca. 13.1 cal. kyr BP as a reasonable time for moraine exposure
than our model ages are too young by 8% and 14% respec-
tively. However, it is likely that at least some post-deposition
denudation of the moraine ridge crest did occur prior to stabi-
lisation with vegetation cover. If so, then we might expect
exhumation of young boulders not long after exposure of the
moraine. The relatively small size of the boulders on this mor-
aine suggests this scenario is plausible. Furthermore, recent
theoretical work (Masarik and Wieler, 2003) has suggested that
boulder size may effect the production efficiency at the boulder
surface. These models suggest boulders on the order of 1 m in
diameter may have a production rate ca. 5% lower relative to
that on a semi-infinite half-space. Thus, a more reasonable
model might be given by something approaching the maxi-
mum apparent age. Considering the oldest ages obtained from
the moraine, we are in almost perfect agreement with the 14
C
age control. While this strategy is suggested by Putkonen and
Swanson (2003), a more conservative approach might be to
remove the three young ‘outliers’ in the distribution. In this
case, using the altitude and latitude scaling factors of Stone
(2000) and Dunai (2000), we calculate apparent mean ages
12.7 Æ 0.8 and 11.8 Æ 0.7 kyr BP, respectively, which are
within 5% and 10% of the assumed true value. In either case,
at this locality, 9.6
S, 77.4
W, 3940 m, the scaling factors pro-
posed by Stone (2000), while yielding apparently low model
ages, reproduce 14
C moraine chronology to better than ca.
10% and probably to ca. 5%. The scaling factors of Dunai
(2000) yield low model ages, ca. 6% below the ages calculated
with Stone (2000). We note that while these conclusions are
important for the high central Andes, they are in not indicative
of the global accuracy of either set of scaling factors. For this
type of general conclusion, tests similar to ours must be done
elsewhere. Based on our ability to reproduce accurate CRN
ages of the Breque moraine, we suggest that the model ages
presented here are appropriate and probably accurate to better
than ca. 10% with respect the calibrated 14
C timescale.
Discussion
Moraine ages
The CRN ages we obtain in Quebradas Cojup, Llaca and Ques-
hgue suggests moraine crests represent several distinct glacier
stillstands and/or advances during the last glacial cycle. The
Figure 6 Photograph of the late glacial Breque moraine in the Rio Negro drainage. The moraine crest is well preserved, showing little post-deposition
degradation. Boulders along the ridge are typically smaller that those found along the moraines associated with the larger advances of the Last Glacial
Maximum (high ridge in the background at 1 o’clock). The sedimentary deposits of the late glacial lake Breque can be seen in the exposures along Rio
Negro below the breach of the Breque moraine
768 JOURNAL OF QUATERNARY SCIENCE
Copyright ß 2005 John Wiley  Sons, Ltd. J. Quaternary Sci., Vol. 20(7–8) 759–776 (2005)
ages along individual moraine crests are quite uniform
(Table 2, Fig. 8) and clearly indicate that there are at least
two generations of isotope stage 2 deposits. The younger
LGM ages range from ca. 16 to 18 ka (the Laguna Baja mor-
aines, Table 2), with an average age of ca. 16.6 ka. The older
LGM ages range from ca. 20 to 30 ka (the Rurec moraines,
Table 2), with an average age of ca. 23.4 ka. Plotting of prob-
ability density curves following Lowell (1995) suggests an age
of 15.4 ka and 19.1 ka for the Laguna Baja and Rurec moraines,
respectively (Fig. 9). These moraine ages are stratigraphically
consistent with minimum limiting 14
C ages of Rodbell
(1993a) at Quebrada Cojup, who suggest minimum ages of ca.
13.5 ka for the Laguna Baja and ca. 19.7 ka for the Rurec mor-
aines based on samples extracted from lacustrine deposits
directly up-valley. The older ages of Rurec and the age scatter
of the ages on the Rurec moraines could be associated with
greater boulder inheritance rather than a chronologically dis-
tinct advance (Anderson et al., 1996). However, our Laguna
Baja moraines ages show relatively little age scatter, and recon-
ciling the older age and variability on Rurec moraines by
inheritance would require distinctly different boulder transport
scenarios for the material in the Laguna Baja and Rurec mor-
aines, which seems unlikely given their proximity, identical
source area, and similarity in age. Furthermore, Putkonen
and Swanson (2003) argue that less than 3% of all moraine
boulders should show inheritance and of these only 85%
would give ages older than the true deposition age. We there-
fore suggest that the Laguna Baja and Rurec moraine exposure
ages are consistent with two distinct and separate glacial
advances. Based on the lack of moraines of similar preservation
and morphology down-valley of the Rurec moraines, the Rurec
moraine represents the maximum extent of the last glacial
cycle LGM in this area. Given the measured range of boulder
ages on the Rurec moraines and our the assumption that inheri-
tance is insignificant, we use the oldest age measured from this
surface as this should provide the best representation of the
actual deposition age. Based on these data, we suggest that gla-
ciers emanating from the western Cordillera Blanca advanced
to this maximum position by ca. 29 ka at the latest (sample
K-10), and persisted at this position until retreat initiating at
ca. 20.5 ka. Furthermore, we interpret the Laguna Baja
moraines as being deposited either during a hiatus in this
retreat or a separate readvance that culminated at ca.
16.5 ka. Retreat from this second LGM maxima was apparently
rapid, as no major moraine complexes are preserved for several
kilometres up-valley of the Laguna Baja moraines.
The ages obtained from the stratigraphically older moraines
at Quebradas Cojup and Queshgue (the Cojup moraines of
Rodbell (1993a)) are significantly older than the Laguna Baja
and Rurec moraines, ranging from ca. 120 to ca. 440 ka,
assuming no erosion of the boulder surfaces (Table 3). For these
old apparent ages, incorporating the effects of both denudation
of the original moraine surface as well as boulder disintegration
(boulder erosion) produce significant changes in boulder age
(Table 3). At each of the two locations, all samples were col-
lected from a single but highly degraded moraine surface, with
samples collected from up to ca. 300 m apart. An important
note here is that the two oldest ages come from valleys sepa-
rated by tens of kilometres and from boulders of different lithol-
ogies. Peru-1 comes from the Cojup drainage and is composed
of Miocene granodiorite from the batholith core, and PE-98-
981 comes from the Queshgue valley and is a striated and
polished quartzite boulder. Interestingly, both these samples
come from the largest (3 m) boulders left on their respective
moraine surface. In the case of the Queshgue moraine there
were only 2 large (1 m) boulders left on the entire surface
(PE-98-981, PE-98-982) with the remaining material being of
cobble size. Clearly, the preservation of striations and polish
Figure 7 10
Be model ages from boulders along the Breque moraine. Filled circles are calculated with the latitude and altitude scaling factors of Stone
(2000), the filled squares are calculated using the latitude and altitude scaling factors of Dunai (2000). The band shows the deposition age as deter-
mined by Rodbell and Seltzer (2000). While both sets of scaling factors a mean age that is 10–14% younger that the deposition age of the moraine, the
oldest ages closely match the 14
C chronology. This suggests post deposition exhumation of younger boulders and indicates that the best estimate for
the deposition age is given by the oldest boulders on the surface
TROPICAL ALPINE GLACIATION IN THE CORDILLERA BLANCA, PERU 769
Copyright ß 2005 John Wiley  Sons, Ltd. J. Quaternary Sci., Vol. 20(7–8) 759–776 (2005)
on PE-98-981 (this is also the case for PE-98-982) is evidence of
no significant erosion of the boulder surface since deposition or
exhumation. It also suggests, that this boulder was transported
at the base of the ice and plausibly underwent significant ero-
sion during transport to the present location. Both these lines of
evidence as well as the large size (which precludes nuclide
build-up on all but the original outer surface of the material
as it was positioned in place on the outcrop) argue against
any inherited radionuclide in this sample. The presence of stria-
tions on the PE-98-981 boulder surface may indicate a short
duration of subaerial weathering, implying recent exhumation
from the moraine. However, we suggest this is not the case, as
(1) the quartzite lithology probably weathers exceptionally
slowly in this high-altitude, arid environment; and (2) the lack
of any other significant boulders other than PE-98-982 on this
surface implies boulders are not being progressively exhumed
from the moraine subsurface. Thus, while we cannot rule
out these minimum ages, it is plausible that these oldest ages
(Peru-1, PE-98-981) closely represent a deposition age.
We consider the effects on model age that erosion of the
boulder surfaces may have had. Using the 10
Be abundance
from the boulder with the highest nuclide abundance (PE-98-
981), and making the assumption that the sampled surface
was in secular equilibrium with respect to 10
Be concentration,
we can put an upper bound on the boulder surface erosion rate
from the relation
 ¼
1

P
N
À Ã
 
ð15Þ
where  is the boulder surface erosion rate. We calculate a
maximum possible boulder erosion rate of ca. 1 m MaÀ1
. In
Table 3, we use this rate to calculate boulder model ages on
the older moraines. Incorporating erosion produces model ages
that extend back past 850 ka. However, we previously stated
that sample PE-98-981 (the oldest boulder from Quebrada
Queshgue) clearly had no significant erosion of the surface
since exposure. Thus, we argue the best choice for the model
age of this sample is 441 ka, which uses zero erosion of the
boulder surface. However, assuming Peru-1 (the oldest boulder
from Quebrada Cojup) underwent erosion of 1 m MaÀ1
yields
an age of ca. 850 ka. Given that both of these boulders are simi-
lar in size, the largest boulders on morphologically and
stratigraphically similar moraines, contain similar 10
Be con-
centrations, and differ only in lithology leads us to one of
two possible scenarios: (1) that neither of these two oldest
boulders have undergone significant erosion ( ¼ 0) since expo-
sure, giving model ages of 441 ka and 438 ka; or (2) that PE-98-
981 had no erosion and Peru-1 did erode, giving model ages of
Figure 8 Quebrada Cojup moraines. Schematic map of the moraines in the area surrounding Quebrada’s Cojup and Llaca. In red are the Laguna Baja
moraines dated in this work, in orange the Rurec moraines and in blue are the older pre-last glacial surfaces of the Cojup moraines (Rodbell, 1993a).
The photograph is a view looking northeast of Quebrada Cojup in the foreground with Quebrada Llaca in the background. The photograph shows the
large Rurec moraine with remnants of the highly denuded Cojup moraine in the lower foreground. Note the generally large size (3 m) of the granitoid
boulders on these surfaces in stark contrast to those on the late glacial surfaces (Fig. 6)
770 JOURNAL OF QUATERNARY SCIENCE
Copyright ß 2005 John Wiley  Sons, Ltd. J. Quaternary Sci., Vol. 20(7–8) 759–776 (2005)
440 ka and 850 ka respectively. Reducing  to ca. 0.3 m MaÀ1
(the maximum bound from Smith et al. (2005b) would bring
the model age of Peru-1 down to 511 ka. However, the excel-
lent agreement between the two model ages assuming  ¼ 0
suggests to us that erosion rates on the top surfaces of these
large boulders were vanishingly small, and that this is probably
the case for the younger moraine boulders as well.
At this point, we have only addressed the oldest two ages
obtained from the oldest moraine surface; however, the old sur-
faces present a wide array of model ages. The likely explana-
tions for the variability in the total distribution of CRN ages
on these old surfaces is due to either: (a) the surface being a
remnant of a now-eroded moraine complex deposited during
a single glacial maximum over a limited period of time; or (b)
the degraded surface being an intermixed remnant of a several
moraine crests deposited in this area at different times whose
initial morphology has been destroyed by erosion. Assuming
the former explanation, we would take as the age of this event
the model age of ca. 440 ka, the oldest boulder age from the
surface. The lower ages in this case would represent scatter
produced by progressive exhumation of the boulders during
the long history of degradation of the original moraine
structure.
If, however, there were several moraine crests deposited
in this area, then the variability in ages can be used to constrain
the timing of multiple advances. There is some support
in accepting this interpretation, as Putkonen and Swanson
(2003) find that the average CRN age range obtained on
boulders collected from individual moraines is up to ca. 40%
less than the maximum boulder age. That, however, is far smal-
ler than the range of ages we obtain from our old surface(s)
that span a range up to ca. 85% lower than the maximum
age (Table 3). Plotting the probability density of the set of ages
from these older degraded moraines produces three separate
groupings of data: one at ca. 125 ka, a second at ca. 225,
and the third at ca. 440 (Fig. 10). Here we have taken the zero
erosion model age and used the maximum age in each of these
groupings as an estimate of the minimum deposition age for
the moraine (Putkonen and Swanson, 2003). At face value,
these ages are roughly correlative with Marine Isotope Stages
6, 8 and 12. A further hint that these ages might in fact represent
separate advances comes from other records of ancient tropical
glaciations. It is interesting that the ages of the old glaciations of
East Africa (Shanahan and Zreda, 2000) show groupings of ages
(350–420 ka and 255–285 ka) similar to the old distributions
present here.
Thus, while we are aware that any interpretation of these age
spectra is speculative, we favour the second interpretation. This
is based primarily on the large gap in ages between the group of
younger ( 250 ka) and older (! 400 ka) ages, rather than the
continuous span of ages expected if the boulders were being
progressively exhumed as the moraine degrades (Hallet and
Putkonen, 1994). However, we cannot distinguish with confi-
dence which interpretation of the age scatter is correct, and we
acknowledge that poor constraints on the boulder erosion rate
and the topographic diffusivity limits the accuracy of these
model ages.
While the moraine ages we report here likely still have a
degree of inaccuracy this is not due to a limitation in the tech-
nique of measuring cosmogenic radionuclide concentration. In
fact, as we are now recognising more and more ancient land-
forms, be they old glacial moraines or hyper-arid deserts
(Dunai et al., 2005). We have come to the point where we
are limited more by our understanding of the processes that
act on landforms since the time of exposure rather than our
analytical ability in the laboratory. In the case of dating old gla-
cial moraines, further insight into the actual age of deposition
can only come from integrated approaches that combine
detailed mapping, test sites where older landforms can be
dated by independent means, and dating efforts in combination
Figure 9 Probability density plot of model ages from the moraines of the last glacial cycle. The colours for the total PDF curves are the same as in
Fig. 8. The ages shown are the ages in the maxima of the PDFs; however, we suggest that the best estimate of the depositional age of the surface is given
by the maximum age within the distribution
TROPICAL ALPINE GLACIATION IN THE CORDILLERA BLANCA, PERU 771
Copyright ß 2005 John Wiley  Sons, Ltd. J. Quaternary Sci., Vol. 20(7–8) 759–776 (2005)
with rigorous testing of models such as that of proposed by
Putkonen and Swanson (2003).
Comparison to regional glacial and
climate records
The chronologies we propose here for the Laguna Baja and
Rurec moraines are consistent with data from elsewhere in
the central Andes. Smith et al. (2005a), using similar cosmo-
genic radionuclide measurements on moraines in valleys adja-
cent to Lake Junin in Peru and Lake Titicaca in Bolivia, estimate
glaciers reached their maximum extent (their Group C mor-
aines) in the last glacial cycle by around ca. 34 ka, and that
retreat from this maximum had initiated by ca. 21 ka. Within
measurement error, these ages are identical to the timing found
on our Rurec moraines. Our Rurec moraine ages and those of
Smith et al. (2005a) are consistent with independent palaeocli-
mate records from cores taken at Lake Junin and Lake Titicaca
that bracket the duration of the local last glacial maximum
(LLGM) to ca. 30 to ca. 20 ka, with deglaciation initiating
sometime between 22 and 19.5 ka (Seltzer et al., 2002). Smith
et al. (2005a) suggest that glaciers in west-facing Lake Junin
valleys retreated up-valley from their maximum and stabilised
at a new position (their Group B moraines) from ca. 20 to ca.
16 kyr BP. The lack of younger moraines and minimal fluvio-
glacial deposit accumulation up-valley of this position indi-
cated a rapid retreat from this position commencing around
ca. 16 kyr BP. Seltzer et al. (2002) also noted an increase in
organic carbon in Lake Junin sediments at around ca. 16 kyr BP,
also suggesting the onset of deglaciation at this time. The valley
position, ages and lack of moraines preserved up-valley of our
Laguna Baja moraines in the Cordillera Blanca are strikingly
similar, and suggest they are genetically and chronologically
linked to the Group B moraines identified by Smith et al.
(2005a).
Our data are therefore consistent with a multi-stage LGM
occurring synchronously throughout the central Andes, with
the maximum in glacial extent occurring from ca. 34 to ca.
21 ka, followed by up-valley retreat (or readvance following
more extensive retreat) to a new stillstand that was abandoned
around ca. 16 ka upon rapid retreat at the close of the last gla-
cial. More broadly, our ages for the Rurec moraines are consis-
tent with the timing of the maximum glacier extent (constrained
primarily from 14
C) in Colombia, Ecuador, northern and south-
ern Peru, Bolivia and Chile, suggesting a synchronous regional
glacial maximum (review in Gillespie and Molnar (1995)).
The onset of retreat from our Laguna Baja moraines at
ca. 16.5 kyr BP is broadly consistent with 14
C dates suggesting
retreat had begun at 16.8 cal. yr BP in the Cordillera Vilcanota–
Quelccaya region (Mercer and Palacios, 1977), by 16.2 k cal.
yr BP in the Lake Junin region and by 14.1 k cal. yr BP in the
Cordillera Oriental (Clapperton, 1993; Rodbell, 1993b).
Although glacial extent probably reflects both precipitation
and temperature, glacial levels in the Cordillera Blanca are sen-
sitive indicators of temperature (Lliboutry et al., 1977). There-
fore, palaeosnowlines can be used to estimate decreases in
mean annual temperature (see Rodbell, 1992). While snowline
depression can be strongly influenced by local factors such as
proximity to local moisture sources, the geometry of the catch-
ments and the local topography, there is no doubt that signifi-
cant regional snowline depression occurred during the last
glacial cycle in the Cordillera Blanca. Based on the present
atmospheric lapse rate of between 6 and 7.5
C kmÀ1
(Seltzer,
1990) and the snowline depression recorded in the moraine
record (moraines at 1.2 km below present terminus), we esti-
mate about an 8
C mean annual temperature difference
between the conditions during the LGM and present. While this
is only a rough estimate and may overestimate the actual regio-
nal equilibrium line altitude depression (Smith et al., 2005a), it
does indicate significant cooling in the tropics during the last
glacial and is consistent with estimates derived from geochem-
ical (Stute et al., 1995), isotopic (Thompson et al., 1995), gla-
cial (Rodbell, 1992) and palynological (Colinvaux et al., 1996;
Thouret et al., 1996) studies throughout the tropical Andes and
the Amazon basin.
Comparison with Northern Hemisphere
glacial records
Combined with other records of glaciation in South America,
our new dates allow comparison between the timing and
extent of glaciation in the tropics relative to higher latitudes,
Figure 10 Probability density plot of model ages from the Cojup moraines. The colours for the total PDF curve are the same as in Fig. 9
772 JOURNAL OF QUATERNARY SCIENCE
Copyright ß 2005 John Wiley  Sons, Ltd. J. Quaternary Sci., Vol. 20(7–8) 759–776 (2005)
and particularly to the Northern Hemisphere. Seltzer et al.
(2002) and Smith et al. (2005a) have suggested that the timing
of the maximum extent of glaciation during the LGM was ear-
lier in the tropical Andes than in the northern high latitudes.
Our ages from the Cordillera Blanca are consistent with the
interpretation of an early glacial maximum, as retreat from
maximum glacial extent was underway here by ca. 20.5 ka,
several thousand years before the classic last glacial maximum
as recorded in proxy records for global ice volume. Smith et al.
(2005a) argue that this difference in timing was produced by
glacier expansion associated with a regional increase in preci-
pitation and cooling temperatures occurring ca. 38 kyr BP, with
glaciers obtaining maximum extent around ca. 34 kyr BP and
retreating following warming around ca. 21 kyr BP.
Comparison of our ages with northern hemisphere climate
records indicates that this chronology may be global in scope.
Balco et al. (2002), in dating New England coastal moraines
with cosmogenic radionuclides, recognise a multi-staged last
glacial maximum for the southeastern margin of the Laurentide
ice sheet. The ice sheet appears to have reached its maximum
extent by at least 25 kyr BP at this location, and was in retreat
from this position by ca. 22 kyr BP (Balco et al., 2002). The old-
est CRN age obtained by Balco et al. (2002) on this moraine is
ca. 30 kyr BP, which is identical, within error, to the oldest age
of ca. 31 kyr BP we obtain on our Rurec moraines in the
Cordillera. The minimum limiting age at which maximum ice
extent was obtained at Junin was determined by using the
oldest CRN age from the Group C moraines of Smith et al.
(2005a), and we suggest that the ca. 30 kyr BP age of Balco
et al. (2002) could similarly be a minimum limiting age for
when maximum ice extent was reached by the Laurentide ice
sheet at that location. Given that Smith et al. (2005a) collected
and analysed a factor of three more samples than either Balco
et al. (2002) or our study, there exists a greater probability that
they sampled farther out on the upper tail of the boulder CRN
age distribution. Thus, the apparent asynchroneity in the onset
of maximum ice extent may simply reflect the collection of
more samples. Regardless, the dates of Balco et al. (2002)
suggest that, at most, the maximum extent of the Laurentide
ice sheet was reached only a few thousand years later (ca.
30 kyr BP vs. ca. 34 kyr BP) after it was reached in the tropical
Andes. In addition, Balco et al. (2002) suggest the maximum
possible age for the timing of retreat from the Laurentide term-
inal moraine is probably ca. 23 ka, with a minimum age of ca.
19 ka provided by dates on a younger moraine complex depos-
ited after retreat from the glacial maximum. Balco et al. (2002),
citing Lowell et al. (1999), note that the timing of retreat at
Martha’s Vineyard is nearly identical to the age of moraines
in Ohio that mark the furthest extent of Wisconsinan Lauren-
tide ice advance. Taken together, these dates suggest that the
southeastern and southern margin of the Laurentide ice sheet
reached and retreated from its maximum extent nearly syn-
chronously (within a few thousand years) with valley glaciers
in the tropical Andes and with the termination of Heinrich
event 2 (Balco et al., 2002).
The initiation of rapid retreat from our Laguna Baja moraines
and the Group B moraines of Smith et al. (2005a) at ca. 16 ka
also appears synchronous, within error, with the initiation of
rapid ice sheet and valley glacier retreat from terminal mor-
aines in North America. Porter and Swanson (1998) conclude
that the Puget Lobe of the Cordilleran Ice Sheet reached its
southern LGM limit at ca. 16 950 calendar yr BP, remained
there for ca. 100 yr, and then retreated rapidly. Cosmogenic
radionuclide dating on moraines suggest retreat from the last
major LGM stillstand moraines in the Wind River Range,
Wyoming (QPt1-FL of Gosse et al., 1995; Pinedale 1–3 of
Phillips et al., 1997) and in the Sierra Nevada, California (Tioga
3 of Phillips et al., 1996), also occurred at ca. 16 kyr BP. Gosse
et al. (1995) note that deglaciation following abandonment of
this stillstand was probably rapid. Phillips et al. (1997) suggest
that these moraine ages imply nearly synchronous climate for-
cing over western North American. These studies suggest that
the initiation of glacier retreat at the close of the last glacial
cycle occurred nearly simultaneously in western North Amer-
ica and the tropical Andes, and that the retreat was rapid in
both regions.
While our age data suggests two distinct LGM moraine
groups (ca. 24 ka and ca. 18 ka), it alone does not necessitate
two separate advances (e.g. the Laguna Baja moraines may
simply mark the recession from the Rurec moraines). However,
palynological and climatic and regional studies lend support
the idea of two distinct advances (Clapperton, 1993; Thouret
et al., 1996). The timing of the LGM advances in the Cordillera
Blanca matches (within error) Heinrich events 1 (ca. 16.5 ka)
and 2 (ca. 23.0 ka), is similar to the moraine chronologies in
temperate North and South America (Lowell et al., 1995;
Phillips et al., 1997), and changes in isotopic compositions
from marine records in the tropical Pacific and temperate
Atlantic basins (Bard et al., 1987, 1997; Linsley, 1996). Thus,
our new data suggest that this multiple event was a rapid,
global-scale climatic event, as supporting models of large
and high-frequency climate instability at the end of the at the
end of the last glacial cycle (Broecker and Denton, 1994;
Helmens et al., 1997).
Conclusions
The moraine history of the Cordillera Blanca is both more pro-
tracted and more complicated than had previously been recog-
nised. As in some locations in the western USA, for example
Phillips et al. (1997), there appears to be an absence of deposits
during isotope stage 4 age in the Cordillera Blanca. The isotope
stage 4 advances thus appear less significant in the Peruvian
Andes than those preceding and following. While our exposure
age estimate of ca. 440 ka for the Cojup moraines is based on
only two ages, together our data clearly demonstrate the exis-
tence of older Andean glaciations that pre-date the last intergla-
cial in the Cordillera Blanca. This conclusion is consistent with
those of numerous authors have postulated that older deposits
beyond the limits of the LLGM in Chile, Peru, and Ecuador
might indeed be associated with events that pre-date the last
interglacial. While studies of the older moraines in Peru and
Bolivia suggested they were probably deposited during the
cold stage of MIS 4 (Clapperton et al., 1997; Mercer, 1984;
Seltzer, 1990), workers in Colombia, Ecuador and Chile have
suggested that these older deposits were from the penultimate
glaciation most likely of marine stage 6 or 8 (Clapperton et al.,
1995; Heine, 1995). More recently, Kaplan et al. (2005) have
also found pre-last glacial deposits in the age range 300–650 ka
from southern Argentina. Thus, our evidence for an extensive
glacial advance at 400 ka, together with the existence of
structurally even older moraines, still undated, at lower eleva-
tions in the Cordillera Blanca, suggests that maximum tropical
alpine ice volumes occurred during previous glacials (MIS 12?)
and not at the close of the last glacial. Records of global cooling
as recorded in marine sediments suggest that older glacial
cycles (cf. MIS 6, 8, 12) were not significantly cooler that that
of MIS 2. However, globally, alpine moraines suggest that these
older glaciations had much more significant ice volumes.
While part of this apparent increase in moraine size in the past
might be due to imperfect preservation, this cannot explain the
TROPICAL ALPINE GLACIATION IN THE CORDILLERA BLANCA, PERU 773
Copyright ß 2005 John Wiley  Sons, Ltd. J. Quaternary Sci., Vol. 20(7–8) 759–776 (2005)

More Related Content

What's hot

Data mining and_visualization_of_earth_history_datasets_to_find_cause_effect_...
Data mining and_visualization_of_earth_history_datasets_to_find_cause_effect_...Data mining and_visualization_of_earth_history_datasets_to_find_cause_effect_...
Data mining and_visualization_of_earth_history_datasets_to_find_cause_effect_...Abdullah Khan Zehady
 
Stepped Pilo-Pleistocene climate variablity at Lake E
Stepped Pilo-Pleistocene climate variablity at Lake EStepped Pilo-Pleistocene climate variablity at Lake E
Stepped Pilo-Pleistocene climate variablity at Lake EUmassGeo
 
01 sub basalt-imaging
01 sub basalt-imaging01 sub basalt-imaging
01 sub basalt-imagingJoanna P
 
Saby et al., 2016
Saby et al., 2016Saby et al., 2016
Saby et al., 2016Marion Saby
 
Initial core descript teachers
Initial core descript teachersInitial core descript teachers
Initial core descript teachersUmassGeo
 
DUGG 2012 Bing Final low res
DUGG 2012 Bing Final low resDUGG 2012 Bing Final low res
DUGG 2012 Bing Final low resChristiane Alepuz
 
A REVIEW OF GROWTH FAULTS AND ROLLOVER ANTICLINES (A CASE STUDY OF NIGER DELTA)
A REVIEW OF GROWTH FAULTS AND ROLLOVER ANTICLINES (A CASE STUDY OF NIGER DELTA) A REVIEW OF GROWTH FAULTS AND ROLLOVER ANTICLINES (A CASE STUDY OF NIGER DELTA)
A REVIEW OF GROWTH FAULTS AND ROLLOVER ANTICLINES (A CASE STUDY OF NIGER DELTA) James Opemipo OLOMO
 
Paper2 justwan
Paper2 justwanPaper2 justwan
Paper2 justwaneisakti
 
Glacier Change and Human Vulnerability
Glacier Change and Human VulnerabilityGlacier Change and Human Vulnerability
Glacier Change and Human Vulnerabilityglacierchangeosu
 
OMONIYI_2008_B.TECH_PROJECT
OMONIYI_2008_B.TECH_PROJECTOMONIYI_2008_B.TECH_PROJECT
OMONIYI_2008_B.TECH_PROJECTOmoniyi Itamuko
 
Glacier changes and climate trends derived from multiple sources in the data ...
Glacier changes and climate trends derived from multiple sources in the data ...Glacier changes and climate trends derived from multiple sources in the data ...
Glacier changes and climate trends derived from multiple sources in the data ...InfoAndina CONDESAN
 
Delineation of Hydrocarbon Bearing Reservoirs from Surface Seismic and Well L...
Delineation of Hydrocarbon Bearing Reservoirs from Surface Seismic and Well L...Delineation of Hydrocarbon Bearing Reservoirs from Surface Seismic and Well L...
Delineation of Hydrocarbon Bearing Reservoirs from Surface Seismic and Well L...IOSR Journals
 
Deep-Sea Corals
Deep-Sea Corals Deep-Sea Corals
Deep-Sea Corals lmohon
 
radiometria
radiometriaradiometria
radiometriafpgc
 
AAG Poster Presentation
AAG Poster PresentationAAG Poster Presentation
AAG Poster Presentationlmohon
 
1009 2010 previous
1009 2010 previous1009 2010 previous
1009 2010 previousAngad Yadav
 

What's hot (20)

Data mining and_visualization_of_earth_history_datasets_to_find_cause_effect_...
Data mining and_visualization_of_earth_history_datasets_to_find_cause_effect_...Data mining and_visualization_of_earth_history_datasets_to_find_cause_effect_...
Data mining and_visualization_of_earth_history_datasets_to_find_cause_effect_...
 
Stepped Pilo-Pleistocene climate variablity at Lake E
Stepped Pilo-Pleistocene climate variablity at Lake EStepped Pilo-Pleistocene climate variablity at Lake E
Stepped Pilo-Pleistocene climate variablity at Lake E
 
Water Quality Report
Water Quality ReportWater Quality Report
Water Quality Report
 
01 sub basalt-imaging
01 sub basalt-imaging01 sub basalt-imaging
01 sub basalt-imaging
 
Saby et al., 2016
Saby et al., 2016Saby et al., 2016
Saby et al., 2016
 
Initial core descript teachers
Initial core descript teachersInitial core descript teachers
Initial core descript teachers
 
DUGG 2012 Bing Final low res
DUGG 2012 Bing Final low resDUGG 2012 Bing Final low res
DUGG 2012 Bing Final low res
 
A REVIEW OF GROWTH FAULTS AND ROLLOVER ANTICLINES (A CASE STUDY OF NIGER DELTA)
A REVIEW OF GROWTH FAULTS AND ROLLOVER ANTICLINES (A CASE STUDY OF NIGER DELTA) A REVIEW OF GROWTH FAULTS AND ROLLOVER ANTICLINES (A CASE STUDY OF NIGER DELTA)
A REVIEW OF GROWTH FAULTS AND ROLLOVER ANTICLINES (A CASE STUDY OF NIGER DELTA)
 
Paper2 justwan
Paper2 justwanPaper2 justwan
Paper2 justwan
 
Initial Core Descriptions
Initial Core DescriptionsInitial Core Descriptions
Initial Core Descriptions
 
Glacier Change and Human Vulnerability
Glacier Change and Human VulnerabilityGlacier Change and Human Vulnerability
Glacier Change and Human Vulnerability
 
OMONIYI_2008_B.TECH_PROJECT
OMONIYI_2008_B.TECH_PROJECTOMONIYI_2008_B.TECH_PROJECT
OMONIYI_2008_B.TECH_PROJECT
 
Glacier changes and climate trends derived from multiple sources in the data ...
Glacier changes and climate trends derived from multiple sources in the data ...Glacier changes and climate trends derived from multiple sources in the data ...
Glacier changes and climate trends derived from multiple sources in the data ...
 
Delineation of Hydrocarbon Bearing Reservoirs from Surface Seismic and Well L...
Delineation of Hydrocarbon Bearing Reservoirs from Surface Seismic and Well L...Delineation of Hydrocarbon Bearing Reservoirs from Surface Seismic and Well L...
Delineation of Hydrocarbon Bearing Reservoirs from Surface Seismic and Well L...
 
Malampaya work
Malampaya workMalampaya work
Malampaya work
 
Deep-Sea Corals
Deep-Sea Corals Deep-Sea Corals
Deep-Sea Corals
 
radiometria
radiometriaradiometria
radiometria
 
773 ijms-proof
773 ijms-proof773 ijms-proof
773 ijms-proof
 
AAG Poster Presentation
AAG Poster PresentationAAG Poster Presentation
AAG Poster Presentation
 
1009 2010 previous
1009 2010 previous1009 2010 previous
1009 2010 previous
 

Similar to The age and extent of tropical alpine glaciation in the cordillera blanca peru farber d.-2005

XHAB1_Kudela__Roberts_2003
XHAB1_Kudela__Roberts_2003XHAB1_Kudela__Roberts_2003
XHAB1_Kudela__Roberts_2003phyto
 
Cordani 10
Cordani 10Cordani 10
Cordani 10cematege
 
Speleothems Ppt
Speleothems PptSpeleothems Ppt
Speleothems Pptjmole
 
mantle diversity beneath the colombian andes.pdf
mantle diversity beneath the colombian andes.pdfmantle diversity beneath the colombian andes.pdf
mantle diversity beneath the colombian andes.pdfssuser515d94
 
Clark 1983 Occurrence and age of Tin mineralization .pdf
Clark 1983 Occurrence and age of Tin mineralization .pdfClark 1983 Occurrence and age of Tin mineralization .pdf
Clark 1983 Occurrence and age of Tin mineralization .pdfVictorValdivia20
 
Samec - Regression analysis of relations among main Quaternary environmental ...
Samec - Regression analysis of relations among main Quaternary environmental ...Samec - Regression analysis of relations among main Quaternary environmental ...
Samec - Regression analysis of relations among main Quaternary environmental ...swenney
 
WE1.L09 - AN OVERVIEW OF THE DESDYNI MISSION
WE1.L09 - AN OVERVIEW OF THE DESDYNI MISSIONWE1.L09 - AN OVERVIEW OF THE DESDYNI MISSION
WE1.L09 - AN OVERVIEW OF THE DESDYNI MISSIONgrssieee
 
GLOBAL FREEZING/GLOBAL COOLING.
GLOBAL FREEZING/GLOBAL COOLING.GLOBAL FREEZING/GLOBAL COOLING.
GLOBAL FREEZING/GLOBAL COOLING.Shaiza Awan
 
PAPER TECTONICA DE PLACAS
PAPER TECTONICA DE PLACASPAPER TECTONICA DE PLACAS
PAPER TECTONICA DE PLACASPablo Muñoz
 
Kim Cobb's Borneo stalagmite talk - AGU 2015
Kim Cobb's Borneo stalagmite talk - AGU 2015Kim Cobb's Borneo stalagmite talk - AGU 2015
Kim Cobb's Borneo stalagmite talk - AGU 2015Kim Cobb
 
Are we leading to the fourth glacial period? Global Freezing- A review
Are we leading to the fourth glacial period? Global Freezing- A reviewAre we leading to the fourth glacial period? Global Freezing- A review
Are we leading to the fourth glacial period? Global Freezing- A reviewShaiza Awan
 
Antarctic climate history and global climate changes
Antarctic climate history and global climate changesAntarctic climate history and global climate changes
Antarctic climate history and global climate changesPontus Lurcock
 
Bot deptlecture20110310(1)
Bot deptlecture20110310(1)Bot deptlecture20110310(1)
Bot deptlecture20110310(1)Edie Barbour
 
Rising Ocean Temps and Coral
Rising Ocean Temps and CoralRising Ocean Temps and Coral
Rising Ocean Temps and CoralMichelle Jones
 
Spatial–temporal changes in andean plateau climate and elevation from stable ...
Spatial–temporal changes in andean plateau climate and elevation from stable ...Spatial–temporal changes in andean plateau climate and elevation from stable ...
Spatial–temporal changes in andean plateau climate and elevation from stable ...herculanoalvarenga
 
Wathen 2011 Climatic Changer_Past 2,000 years
Wathen 2011 Climatic Changer_Past 2,000 yearsWathen 2011 Climatic Changer_Past 2,000 years
Wathen 2011 Climatic Changer_Past 2,000 yearsStephen Wathen
 

Similar to The age and extent of tropical alpine glaciation in the cordillera blanca peru farber d.-2005 (20)

RPuta_Thesis
RPuta_ThesisRPuta_Thesis
RPuta_Thesis
 
XHAB1_Kudela__Roberts_2003
XHAB1_Kudela__Roberts_2003XHAB1_Kudela__Roberts_2003
XHAB1_Kudela__Roberts_2003
 
Cordani 10
Cordani 10Cordani 10
Cordani 10
 
Speleothems Ppt
Speleothems PptSpeleothems Ppt
Speleothems Ppt
 
mantle diversity beneath the colombian andes.pdf
mantle diversity beneath the colombian andes.pdfmantle diversity beneath the colombian andes.pdf
mantle diversity beneath the colombian andes.pdf
 
Clark 1983 Occurrence and age of Tin mineralization .pdf
Clark 1983 Occurrence and age of Tin mineralization .pdfClark 1983 Occurrence and age of Tin mineralization .pdf
Clark 1983 Occurrence and age of Tin mineralization .pdf
 
Alvarenga et al. 2008
Alvarenga et al. 2008Alvarenga et al. 2008
Alvarenga et al. 2008
 
Samec - Regression analysis of relations among main Quaternary environmental ...
Samec - Regression analysis of relations among main Quaternary environmental ...Samec - Regression analysis of relations among main Quaternary environmental ...
Samec - Regression analysis of relations among main Quaternary environmental ...
 
WE1.L09 - AN OVERVIEW OF THE DESDYNI MISSION
WE1.L09 - AN OVERVIEW OF THE DESDYNI MISSIONWE1.L09 - AN OVERVIEW OF THE DESDYNI MISSION
WE1.L09 - AN OVERVIEW OF THE DESDYNI MISSION
 
Kerr et al., 2002
Kerr et al., 2002Kerr et al., 2002
Kerr et al., 2002
 
GLOBAL FREEZING/GLOBAL COOLING.
GLOBAL FREEZING/GLOBAL COOLING.GLOBAL FREEZING/GLOBAL COOLING.
GLOBAL FREEZING/GLOBAL COOLING.
 
PAPER TECTONICA DE PLACAS
PAPER TECTONICA DE PLACASPAPER TECTONICA DE PLACAS
PAPER TECTONICA DE PLACAS
 
Kim Cobb's Borneo stalagmite talk - AGU 2015
Kim Cobb's Borneo stalagmite talk - AGU 2015Kim Cobb's Borneo stalagmite talk - AGU 2015
Kim Cobb's Borneo stalagmite talk - AGU 2015
 
Are we leading to the fourth glacial period? Global Freezing- A review
Are we leading to the fourth glacial period? Global Freezing- A reviewAre we leading to the fourth glacial period? Global Freezing- A review
Are we leading to the fourth glacial period? Global Freezing- A review
 
Antarctic climate history and global climate changes
Antarctic climate history and global climate changesAntarctic climate history and global climate changes
Antarctic climate history and global climate changes
 
Bot deptlecture20110310(1)
Bot deptlecture20110310(1)Bot deptlecture20110310(1)
Bot deptlecture20110310(1)
 
Rising Ocean Temps and Coral
Rising Ocean Temps and CoralRising Ocean Temps and Coral
Rising Ocean Temps and Coral
 
Spatial–temporal changes in andean plateau climate and elevation from stable ...
Spatial–temporal changes in andean plateau climate and elevation from stable ...Spatial–temporal changes in andean plateau climate and elevation from stable ...
Spatial–temporal changes in andean plateau climate and elevation from stable ...
 
Wathen 2011 Climatic Changer_Past 2,000 years
Wathen 2011 Climatic Changer_Past 2,000 yearsWathen 2011 Climatic Changer_Past 2,000 years
Wathen 2011 Climatic Changer_Past 2,000 years
 
Singer et al 2018
Singer et al 2018Singer et al 2018
Singer et al 2018
 

Recently uploaded

Science lesson Moon for 4th quarter lesson
Science lesson Moon for 4th quarter lessonScience lesson Moon for 4th quarter lesson
Science lesson Moon for 4th quarter lessonJericReyAuditor
 
Blooming Together_ Growing a Community Garden Worksheet.docx
Blooming Together_ Growing a Community Garden Worksheet.docxBlooming Together_ Growing a Community Garden Worksheet.docx
Blooming Together_ Growing a Community Garden Worksheet.docxUnboundStockton
 
Hybridoma Technology ( Production , Purification , and Application )
Hybridoma Technology  ( Production , Purification , and Application  ) Hybridoma Technology  ( Production , Purification , and Application  )
Hybridoma Technology ( Production , Purification , and Application ) Sakshi Ghasle
 
Pharmacognosy Flower 3. Compositae 2023.pdf
Pharmacognosy Flower 3. Compositae 2023.pdfPharmacognosy Flower 3. Compositae 2023.pdf
Pharmacognosy Flower 3. Compositae 2023.pdfMahmoud M. Sallam
 
Presiding Officer Training module 2024 lok sabha elections
Presiding Officer Training module 2024 lok sabha electionsPresiding Officer Training module 2024 lok sabha elections
Presiding Officer Training module 2024 lok sabha electionsanshu789521
 
CARE OF CHILD IN INCUBATOR..........pptx
CARE OF CHILD IN INCUBATOR..........pptxCARE OF CHILD IN INCUBATOR..........pptx
CARE OF CHILD IN INCUBATOR..........pptxGaneshChakor2
 
Paris 2024 Olympic Geographies - an activity
Paris 2024 Olympic Geographies - an activityParis 2024 Olympic Geographies - an activity
Paris 2024 Olympic Geographies - an activityGeoBlogs
 
Painted Grey Ware.pptx, PGW Culture of India
Painted Grey Ware.pptx, PGW Culture of IndiaPainted Grey Ware.pptx, PGW Culture of India
Painted Grey Ware.pptx, PGW Culture of IndiaVirag Sontakke
 
_Math 4-Q4 Week 5.pptx Steps in Collecting Data
_Math 4-Q4 Week 5.pptx Steps in Collecting Data_Math 4-Q4 Week 5.pptx Steps in Collecting Data
_Math 4-Q4 Week 5.pptx Steps in Collecting DataJhengPantaleon
 
Science 7 - LAND and SEA BREEZE and its Characteristics
Science 7 - LAND and SEA BREEZE and its CharacteristicsScience 7 - LAND and SEA BREEZE and its Characteristics
Science 7 - LAND and SEA BREEZE and its CharacteristicsKarinaGenton
 
Biting mechanism of poisonous snakes.pdf
Biting mechanism of poisonous snakes.pdfBiting mechanism of poisonous snakes.pdf
Biting mechanism of poisonous snakes.pdfadityarao40181
 
EPANDING THE CONTENT OF AN OUTLINE using notes.pptx
EPANDING THE CONTENT OF AN OUTLINE using notes.pptxEPANDING THE CONTENT OF AN OUTLINE using notes.pptx
EPANDING THE CONTENT OF AN OUTLINE using notes.pptxRaymartEstabillo3
 
ENGLISH5 QUARTER4 MODULE1 WEEK1-3 How Visual and Multimedia Elements.pptx
ENGLISH5 QUARTER4 MODULE1 WEEK1-3 How Visual and Multimedia Elements.pptxENGLISH5 QUARTER4 MODULE1 WEEK1-3 How Visual and Multimedia Elements.pptx
ENGLISH5 QUARTER4 MODULE1 WEEK1-3 How Visual and Multimedia Elements.pptxAnaBeatriceAblay2
 
Solving Puzzles Benefits Everyone (English).pptx
Solving Puzzles Benefits Everyone (English).pptxSolving Puzzles Benefits Everyone (English).pptx
Solving Puzzles Benefits Everyone (English).pptxOH TEIK BIN
 
भारत-रोम व्यापार.pptx, Indo-Roman Trade,
भारत-रोम व्यापार.pptx, Indo-Roman Trade,भारत-रोम व्यापार.pptx, Indo-Roman Trade,
भारत-रोम व्यापार.pptx, Indo-Roman Trade,Virag Sontakke
 
Software Engineering Methodologies (overview)
Software Engineering Methodologies (overview)Software Engineering Methodologies (overview)
Software Engineering Methodologies (overview)eniolaolutunde
 
internship ppt on smartinternz platform as salesforce developer
internship ppt on smartinternz platform as salesforce developerinternship ppt on smartinternz platform as salesforce developer
internship ppt on smartinternz platform as salesforce developerunnathinaik
 
History Class XII Ch. 3 Kinship, Caste and Class (1).pptx
History Class XII Ch. 3 Kinship, Caste and Class (1).pptxHistory Class XII Ch. 3 Kinship, Caste and Class (1).pptx
History Class XII Ch. 3 Kinship, Caste and Class (1).pptxsocialsciencegdgrohi
 
Incoming and Outgoing Shipments in 1 STEP Using Odoo 17
Incoming and Outgoing Shipments in 1 STEP Using Odoo 17Incoming and Outgoing Shipments in 1 STEP Using Odoo 17
Incoming and Outgoing Shipments in 1 STEP Using Odoo 17Celine George
 
ECONOMIC CONTEXT - LONG FORM TV DRAMA - PPT
ECONOMIC CONTEXT - LONG FORM TV DRAMA - PPTECONOMIC CONTEXT - LONG FORM TV DRAMA - PPT
ECONOMIC CONTEXT - LONG FORM TV DRAMA - PPTiammrhaywood
 

Recently uploaded (20)

Science lesson Moon for 4th quarter lesson
Science lesson Moon for 4th quarter lessonScience lesson Moon for 4th quarter lesson
Science lesson Moon for 4th quarter lesson
 
Blooming Together_ Growing a Community Garden Worksheet.docx
Blooming Together_ Growing a Community Garden Worksheet.docxBlooming Together_ Growing a Community Garden Worksheet.docx
Blooming Together_ Growing a Community Garden Worksheet.docx
 
Hybridoma Technology ( Production , Purification , and Application )
Hybridoma Technology  ( Production , Purification , and Application  ) Hybridoma Technology  ( Production , Purification , and Application  )
Hybridoma Technology ( Production , Purification , and Application )
 
Pharmacognosy Flower 3. Compositae 2023.pdf
Pharmacognosy Flower 3. Compositae 2023.pdfPharmacognosy Flower 3. Compositae 2023.pdf
Pharmacognosy Flower 3. Compositae 2023.pdf
 
Presiding Officer Training module 2024 lok sabha elections
Presiding Officer Training module 2024 lok sabha electionsPresiding Officer Training module 2024 lok sabha elections
Presiding Officer Training module 2024 lok sabha elections
 
CARE OF CHILD IN INCUBATOR..........pptx
CARE OF CHILD IN INCUBATOR..........pptxCARE OF CHILD IN INCUBATOR..........pptx
CARE OF CHILD IN INCUBATOR..........pptx
 
Paris 2024 Olympic Geographies - an activity
Paris 2024 Olympic Geographies - an activityParis 2024 Olympic Geographies - an activity
Paris 2024 Olympic Geographies - an activity
 
Painted Grey Ware.pptx, PGW Culture of India
Painted Grey Ware.pptx, PGW Culture of IndiaPainted Grey Ware.pptx, PGW Culture of India
Painted Grey Ware.pptx, PGW Culture of India
 
_Math 4-Q4 Week 5.pptx Steps in Collecting Data
_Math 4-Q4 Week 5.pptx Steps in Collecting Data_Math 4-Q4 Week 5.pptx Steps in Collecting Data
_Math 4-Q4 Week 5.pptx Steps in Collecting Data
 
Science 7 - LAND and SEA BREEZE and its Characteristics
Science 7 - LAND and SEA BREEZE and its CharacteristicsScience 7 - LAND and SEA BREEZE and its Characteristics
Science 7 - LAND and SEA BREEZE and its Characteristics
 
Biting mechanism of poisonous snakes.pdf
Biting mechanism of poisonous snakes.pdfBiting mechanism of poisonous snakes.pdf
Biting mechanism of poisonous snakes.pdf
 
EPANDING THE CONTENT OF AN OUTLINE using notes.pptx
EPANDING THE CONTENT OF AN OUTLINE using notes.pptxEPANDING THE CONTENT OF AN OUTLINE using notes.pptx
EPANDING THE CONTENT OF AN OUTLINE using notes.pptx
 
ENGLISH5 QUARTER4 MODULE1 WEEK1-3 How Visual and Multimedia Elements.pptx
ENGLISH5 QUARTER4 MODULE1 WEEK1-3 How Visual and Multimedia Elements.pptxENGLISH5 QUARTER4 MODULE1 WEEK1-3 How Visual and Multimedia Elements.pptx
ENGLISH5 QUARTER4 MODULE1 WEEK1-3 How Visual and Multimedia Elements.pptx
 
Solving Puzzles Benefits Everyone (English).pptx
Solving Puzzles Benefits Everyone (English).pptxSolving Puzzles Benefits Everyone (English).pptx
Solving Puzzles Benefits Everyone (English).pptx
 
भारत-रोम व्यापार.pptx, Indo-Roman Trade,
भारत-रोम व्यापार.pptx, Indo-Roman Trade,भारत-रोम व्यापार.pptx, Indo-Roman Trade,
भारत-रोम व्यापार.pptx, Indo-Roman Trade,
 
Software Engineering Methodologies (overview)
Software Engineering Methodologies (overview)Software Engineering Methodologies (overview)
Software Engineering Methodologies (overview)
 
internship ppt on smartinternz platform as salesforce developer
internship ppt on smartinternz platform as salesforce developerinternship ppt on smartinternz platform as salesforce developer
internship ppt on smartinternz platform as salesforce developer
 
History Class XII Ch. 3 Kinship, Caste and Class (1).pptx
History Class XII Ch. 3 Kinship, Caste and Class (1).pptxHistory Class XII Ch. 3 Kinship, Caste and Class (1).pptx
History Class XII Ch. 3 Kinship, Caste and Class (1).pptx
 
Incoming and Outgoing Shipments in 1 STEP Using Odoo 17
Incoming and Outgoing Shipments in 1 STEP Using Odoo 17Incoming and Outgoing Shipments in 1 STEP Using Odoo 17
Incoming and Outgoing Shipments in 1 STEP Using Odoo 17
 
ECONOMIC CONTEXT - LONG FORM TV DRAMA - PPT
ECONOMIC CONTEXT - LONG FORM TV DRAMA - PPTECONOMIC CONTEXT - LONG FORM TV DRAMA - PPT
ECONOMIC CONTEXT - LONG FORM TV DRAMA - PPT
 

The age and extent of tropical alpine glaciation in the cordillera blanca peru farber d.-2005

  • 1. JOURNAL OF QUATERNARY SCIENCE (2005) 20(7–8) 759–776 Copyright ß 2005 John Wiley & Sons, Ltd. Published online in Wiley InterScience (www.interscience.wiley.com). DOI: 10.1002/jqs.994 The age and extent of tropical alpine glaciation in the Cordillera Blanca, Peru DANIEL L. FARBER,1,2 * GREGORY S. HANCOCK,3 ROBERT C. FINKEL1 and DONALD T. RODBELL4 1 University of California, Lawrence Livermore National Laboratory, Livermore, CA, USA 2 University of California, Santa Cruz, Santa Cruz, CA, USA 3 College of William and Mary, Williamsburg, VA, USA 4 Union College, Schenectady, New York, USA Farber, D. L., Hancock, G. S., Finkel, R. C. and Rodbell, D. T. 2005. The age and extent of tropical alpine glaciation in the Cordillera Blanca, Peru. J. Quaternary Sci., Vol. 20 pp. 759–776. ISSN 0267-8179. Received 17 October 2005; Accepted 18 October 2005 ABSTRACT: Based on new 10 Be data for moraines in the Cordillera Blanca of central Peru, we have calculated model ages of three sets of Pleistocene glacial moraines. In order of decreasing age, these are the Cojup, Rurec and Laguna Baja moraines. The oldest moraines occur at the lowest elevations and yield dates of >400 ka pre-dating the last interglacial and demonstrating that maximum ice volumes occurred during previous glacial periods, and not at the end of the last glacial. Our new data from the younger moraines indicate that the end of the last glacial cycle comprised two separate advances at ca. 29 ka and ca. 16.5 ka, each reflecting significant (>4 C) tropical of cooling at 10 S. These data combined with published records from the Laurentide ice sheet, indicate that climate instabilities associated with the close of the last glacial were likely global and synchronous in nature. Copyright ß 2005 John Wiley Sons, Ltd. KEYWORDS: palaeoclimate; tropical glaciation; geochronology; cosmogenic; radionuclides; Andes. Introduction High-resolution isotopic studies of ice cores (Dansgaard et al., 1993), sediments (Bond and Lotti, 1995; Broecker, 1994; Linsley, 1996) and corals (Fairbanks, 1989; Guilderson et al., 1994) have demonstrated that the last glacial period was a time of dramatic climate instability. The precise timing and the glo- bal distribution of climate fluctuations yield information about the dynamics of the ocean–atmosphere system that can contri- bute to understanding the causes of global climatic change (Broecker and Denton, 1994). However, most climate records are derived from mid- to high-latitude regions, and therefore the nature of climate change in the tropics and the degree to which the climate of the tropics mirrors that of temperate regions remains the subject of debate. Although moraines provide a detailed record that may be useful in developing records of local climate change (Gillespie and Molnar, 1995), obtaining accurate ages on depositional features such as moraines is often difficult. Recently, in-situ- produced cosmogenic radionuclides (CRN) have proved to be a powerful tool for precisely dating such deposits (e.g. Phillips et al., 1997). Here we use in-situ-production of 10 Be to date Pleistocene moraines of the western Cordillera Blanca in Peru in order to develop a detailed chronology of alpine glacier fluctuations in the southern tropics during the Quaternary. Because the low altitude limit of glaciers in this region is a sensitive function of temperature (Lliboutry et al., 1977), past glacier extent recorded by moraines can serve as an indicator of palaeotemperature fluctuations at this latitude. In addition, central Peru’s climate is strongly affected by global atmospheric patterns through the influence of the Southern Oscillation on the Amazon basin immediately to the east (Martin et al., 1993) while northern Peru is affected by fluctua- tions of the Intertropical Convergence Zone. Thus, the Pleisto- cene history of alpine glacier fluctuations in the Cordillera Blanca, Peru, can be used to address the timing of both global and regional climatic change. Detailed mapping by Clapperton (1972, 1981) delineated three Pleistocene moraine groups in the Cordillera Blanca: (1) relatively fresh lateral and terminal moraines marking the most recent extensive advance; (2) a set of older ‘pre-Wisconsinan’ moraines, and (3) a older set of highly diffused, discontinuous moraines. The classification was further refined by Rodbell (1993a) into four groups based on the height of rock weathering posts, soil development and 14 C dates. In order of increasing age, Rodbell (1993a) identified the Manachaque, Laguna Baja, Rurec and Cojup moraines. 14 C age constraints on these moraines were obtained from peat deposits in the Rio Negro drainage ca. 10 km south of our study area (Rodbell, 1993a). The minimum-limiting age of the Manachaque and Laguna Baja moraines is 15 860 Æ 290 cal. yr BP (recalculated from 13 280 Æ 190 yr BP in Rodbell (1993a) to calibrated 14 C ages in calendar years (cal. yr BP); Stuiver and Reimer, 1993). This age was obtained from organic material collected from peat in a lake sediment section exposed inside the oldest Manacha- que moraine. The minimum age of the Rurec moraines is * Correspondence to: Daniel L. Farber, University of California, Lawrence Liver- more National Laboratory, Livermore, California, USA; University of California, Santa Cruz, Santa Cruz, California, USA. E-mail: farber2@llnl.gov
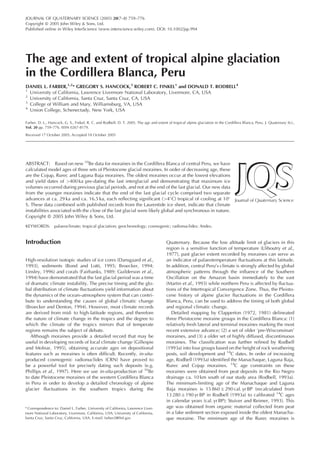
  • 2. derived from basal organic matter from sediment cores within bogs dammed behind Rurec moraines (Rodbell, 1993a). Two dates were obtained, one from the Rio Negro drainage (21 480 Æ 410 cal. yr BP), and the second from a drainage at the southern end of the range (ca. 30 km south of our field area) (ca. 24 ka cal. yr BP using the calibration of Kitagawa and van der Plicht (1998)). The degree to which these dates underesti- mate the true moraine age could not be determined by Rodbell (1993a, 1993b). In this paper, we report the results of direct dating of the LGM and older moraines in the central Andes using the CRN 10 Be. We seek to address the following questions using these dates. (1) What do moraine ages suggest about the precise timing of maximum glaciation in the tropical central Andes? (2) How synchronous were glacial advances in the central Andes with other regional and global glacial advances during the LGM? (3) What does this comparison suggest about the linkages between tropical climate events and those of higher latitudes? Recently, the application of CRN exposure age dating has greatly increased in a number of areas including burial dating of sediments, neotectonics, quantifying rates of soil production and palaeoclimatlogy (Chevalier et al., 2005; Heimsath et al., 1997, 1999; Smith et al., 2005). However, of these its application to palaeoclimatology remains at some level quite difficult. To be useful in comparing palaeoclimate records, CRN dating requires accuracies approaching Æ 5% to allow comparison with other records from different regions and calibrated over different timescales (i.e. 14 C, U/Th). This study presents one of relatively few attempts to quantitatively compare palaeoclimate records in the tropics to the higher lati- tudes. As the methods by which we determine CRN ages in this low-latitude setting are critical in assessing the accuracy of the comparison of our chronology to others, we start with a detailed discussion of the methodology we use to obtain expo- sure ages. Cosmogenic radionuclide dating methods Sample collection and processing We have determined the time of glacial retreat by measuring the concentration of 10 Be in quartz extracted from moraines classified as Laguna Baja, Rurec and Cojup deposits by Rodbell (1993a). Our samples were collected northeast of Huaraz from moraines emanating from the quebradas (valleys) of Llaca and Cojup and southeast of Huaraz from moraines extending out from the Quebrada Queshque (Fig. 1; Rodbell, 1993a). In both locations, moraines equivalent to the Laguna Baja, Rurec and Cojup deposits are well preserved, and are littered with gla- cially deposited boulders of granite and, in some cases, quart- zite, with boulder sizes ranging up to 1–4 m in diameter. As the only source for the granite and quarzite boulders is from within the Cordillera Blanca proper their presence in moraines ema- nating from the range indicates glacial transport to their current position. The proximity of our locations to the type-locale Figure 1 Location of the Cordillera Blanca. The landsat image shows the Cordillera Blanca and some of the major peaks. The city of Huaraz is shown in the centre of the image. Labelled are the areas referred to in the text. These include, from north to south, Quabradas and Llaca, Cojup, the Rio Negro drainage and Quebrada Queshque 760 JOURNAL OF QUATERNARY SCIENCE Copyright ß 2005 John Wiley Sons, Ltd. J. Quaternary Sci., Vol. 20(7–8) 759–776 (2005)
  • 3. where Rodbell (1993a) obtained minimum limiting ages for these moraines provides confidence in using the same classifi- cation of these moraines, and allows use of the same minimum limiting ages as derived by Rodbell (1993a). In order to reduce possible error arising from variable erosion histories or sedi- ment coverage, we collected large samples of ca. 2 kg of intact rock from the top 5 cm of large granitic and quartzite boulders (greater than ca. 1 m in diameter) located on stable slopes near moraine crests. Quartz was extracted from the samples follow- ing a modification of Kohl and Nishiizumi (1992). Isolation of 10 Be from quartz was followed by measurement of the ratios 10 Be/9 Be by accelerator mass spectrometry (AMS) at Lawrence Livermore National Laboratory. The sample characteristics and measured 10 Be concentrations are given in Tables 1–3. Table 1 Locations and analytical results for samples collected in Quebrada Rurec Samplea Size Latitude Longitude Altitude Scaling Depth/ 10 Be production [10Be] 10 Be 10 Be (m) (deg S) (deg W) (m) factorb topography rate [10Be] uncertainty exposure exposure correction (at gÀ1 yrÀ1 )c (105 at gÀ1 ) (105 at gÀ1 ) age (yr)d age error (yr) HU-41 1 9.651 77.361 4045 7.26 0.98 38.70 4.59 0.11 11 800 290 HU-43 0.5 9.651 77.361 4045 7.26 0.98 38.70 4.40 0.20 11 340 530 PE98RU-43a 1 9.651 77.361 4045 7.26 0.98 38.70 5.04 0.18 13 160 460 PE98RU-43b 1 9.651 77.361 4045 7.26 0.98 38.70 4.84 0.17 12 590 450 PE98RU-C41 1 9.651 77.361 4045 7.26 0.98 38.70 4.10 0.16 10 430 420 PE98RU-C42 1 9.651 77.361 4045 7.26 0.98 38.70 4.18 0.14 10 650 370 PE98RU-C44 0.5 9.653 77.365 4045 7.26 0.98 38.70 4.88 0.16 12 670 420 PE98RU-C45 1 9.652 77.365 4045 7.26 0.98 38.70 4.18 0.15 10 660 390 a All the boulders sampled on this surface were composed of quartzite. Samples of same number with ‘a’ and ‘b’ designations were split after quartz isolation from the sampled material. b Altitude and latitude corrections based on Stone (2000). c Assumes a sea-level, high-latitude production rate of 5.44 atoms 10 Be per gram of quartz per year. d Incorporates correction for magnetic field variation using palaeointensity data from Ohno and Hamano (1992), McElhinny and Senanayake (1982) and the SINT-800 record. Table 2 Locations and analytical results from Group 1 and 2 moraines, Quebradas Cojup and Llaca Samplea Latitude Longitude Altitude Scaling Depth/topography 10 Be [10Be] 10 Be 10 Be (deg S) (deg W) (m) factorb correction11 production rate [10Be] uncertainty exposure exposure (at gÀ1 yrÀ1 )c (105 at gÀ1 ) (105 at gÀ1 ) age (yr)d age error (yr) Group 1 (Laguna Baja) GV-22 9.831 77.306 4212 7.84 0.98 41.80 8.05 0.19 19 460 470 GV-23 9.831 77.306 4182 7.74 0.97 40.84 6.29 0.46 15 530 1140 GV-24 9.831 77.307 4157 7.65 0.98 40.78 5.92 0.14 14 690 350 K-13 9.488 77.474 3787 6.42 0.98 34.23 4.83 0.23 14 230 670 K-6a 9.478 77.468 3963 6.98 0.98 37.21 5.62 0.21 15 240 580 K-6b 9.478 77.468 3963 6.98 0.98 37.21 5.64 0.27 15 280 730 K-8a 9.477 77.468 4008 7.13 0.98 37.21 6.06 0.30 16 070 790 K-8b 9.477 77.468 4008 7.13 0.98 38.01 6.02 0.27 15 970 730 K-9 9.491 77.461 3782 6.4 0.98 38.01 5.06 0.28 14 940 830 P98GV-C19 9.830 77.304 4206 7.82 0.98 34.12 5.00 0.31 11 940 750 P98GV-C20 9.830 77.304 4206 7.82 0.98 41.69 5.43 0.14 13 080 340 P98GV-C21 9.830 77.304 4206 7.82 0.98 41.69 5.33 0.24 12 830 580 Group 2 (Rurec) HU-1 9.486 77.453 4016 7.15 0.96 37.34 7.14 0.21 19 240 580 HU-2 9.486 77.453 4002 7.11 0.96 37.13 6.74 0.16 18 280 430 HU-4 9.486 77.452 3984 7.05 0.96 36.82 6.96 0.17 19 050 470 K-1 9.485 77.464 3830 6.55 0.98 34.92 10.20 0.70 28 410 1900 K-10 9.493 77.461 3816 6.51 0.98 34.71 10.51 0.43 29 330 1200 K-2 9.484 77.471 3817 6.51 0.98 34.71 5.77 0.59 16 730 1700 K-3 9.486 77.480 3729 6.24 0.98 33.27 6.73 0.30 20 330 890 K-4 9.484 77.476 3848 6.61 0.98 35.24 6.52 0.31 18 620 890 K-5a 9.479 77.473 3885 6.73 0.98 35.88 8.65 0.41 23 610 720 K-5b 9.479 77.473 3885 6.73 0.98 35.88 8.53 0.26 23 920 1100 K-7 9.477 77.468 4008 7.13 0.98 38.01 6.41 0.29 16 980 780 Peru-18 9.492 77.460 3749 6.3 0.98 33.59 5.69 0.18 17 040 550 Peru-21 9.488 77.454 3840 6.58 0.98 35.08 6.84 0.26 19 600 740 a Samples of same number with ‘a’ and ‘b’ designations were split after quartz isolation from the sampled material. b Altitude and latitude corrections based on Stone (2000). c Assumes a modern instantaneous sea-level, high-latitude production rate of 5.44 atoms 10 Be per gram of quartz per year. d Incorporates correction for magnetic field variation using palaeointensity data from Ohno and Hamano (1992), McElhinny and Senanayake (1982) and the SINT-800 record. TROPICAL ALPINE GLACIATION IN THE CORDILLERA BLANCA, PERU 761 Copyright ß 2005 John Wiley Sons, Ltd. J. Quaternary Sci., Vol. 20(7–8) 759–776 (2005)
  • 4. Table3Locationandanalyticalresultsforpre-LastGlacialMaximummoraines,QuebradasCojupandQueshgue Samplea LatitudeLongitudeAltitudeScalingDepth/topography10 Beproduction[10Be][10Be]uncertainty10 Beexposureage10 Beexposureage10 Beexposureage10 Beexposureage (degS)(degW)(m)factorb correctionrate(atgÀ1 yrÀ1 )c (105 atgÀ1 )(105 atgÀ1 )(1mMaÀ1 )(yr)d error(yr)(0mMaÀ1 )(yr)e error(yr) K-12a9.49477.46338906.740.9835.9348.001.7813360050001185004400 K-12b9.49477.46338906.740.9835.9351.181.5014560043001259003700 PE-98–9819.82177.36740607.310.9838.97172.004.897824002400044130013000 PE-98–9829.82177.36740607.310.9838.9774.601.7820700050001755004200 Peru-19.50277.46336886.120.9832.63142.634.358698002500043850013000 Peru-109.50577.46636425.980.9831.8870.392.7823730094001993007900 Peru-129.49577.46437296.240.9833.2764.721.4721040048001796004100 Peru-139.49677.46437506.30.9833.5963.611.8320540059001742005000 Peru-169.49477.46338136.50.9834.6528.730.78859002300763202100 Peru-39.50477.46436886.120.9832.6380.390.9228530033002252002600 Peru-49.50477.46436886.120.9832.6357.991.6218620052001623004500 Peru-59.50577.46636425.980.9831.8861.680.7319730024001786002100 Peru-69.50577.46636425.980.9831.8830.191.05907803100881903100 Peru-79.50577.46636425.980.9831.8871.571.4824320050002031004200 Peru-89.50577.46636275.940.9831.6769.832.5523440086001993007300 Peru-99.50577.46636275.940.9831.6768.381.5822660052001951004500 a Samplesofsamenumberwith‘a’and‘b’designationsweresplitafterquartzisolationfromthesampledmaterial. b AltitudeandlatitudecorrectionsbasedonStone(2000). c Assumesamoderninstantaneoussea-level,high-latitudeproductionrateof5.44atoms10 Bepergramquartzperyear. d Assumesanerosionrateof1mMaÀ1 ,andincorporatescorrectionformagneticfieldvariationusingpalaeointensitydatafromOhnoandHamano(1992),McElhinnyandSenanayake(1982)andtheSINT-800record. e Assumesanerosionrateof0,andincorporatescorrectionformagneticfieldvariationusingpalaeointensitydatafromOhnoandHamano(1992),McElhinnyandSenanayake(1982)andtheSINT-800record. 762 JOURNAL OF QUATERNARY SCIENCE Copyright ß 2005 John Wiley Sons, Ltd. J. Quaternary Sci., Vol. 20(7–8) 759–776 (2005)
  • 5. Model age calculations Translating the 10 Be concentrations into model ages requires corrections for the horizon blockage (e.g. topographic shield- ing), sample thickness, latitude, altitude, palaeomagnetic field variations and local atmospheric effects. We have used a methodology developed by two of the authors (Farber and Finkel) in order to correct radionuclide production rates for these effects (Lal, 1991; Nishiizumi et al., 1989). Much of the physics behind the corrections has been treated in some detail in Gosse and Phillips (2001), but our calculations involve several new numerical routines that we describe in detail below. Horizon blockage Horizon blockage can be considered a modification factor to the production rate that is the ratio of the actual cosmic ray flux incident on a surface to the expected flux if the surface were horizontal and had full sky exposure (e.g. 2 steradians sky exposure). To calculate this factor we numerically integrate over the entire exposure geometry of the sample. We treat two types of horizon blockage in our model: (1) horizon shield- ing arising from a dipping sample surface (i.e. self-shielding) and (2) shielding due to topography blocking the horizon. To account for self-shielding due to dip, we assume that the sam- ple was taken from an infinite half-space (Fig. 2) with strike (azimuth measured from north) s and dip (angle below the hor- izon) d (here the direction of dip is defined as s þ ð=2ÞÞ. Thus, the horizon due to the plane is given by: ¼ tanÀ1 tan dð Þsin À s þ ð Þð Þ½ Š 8 s þ s þ 2 ¼ 0 8 s s þ ð1Þ where is the apparent horizon in the azimuth direction (measured from north). For the topographic shielding, we mea- sure the azimuth and angle above the horizontal to all signifi- cant elevation maxima and minima in the topography surrounding the sample site. Using this data, we create a syn- thetic horizon by calculating the elevation angle measured from the horizontal, ðÞ, at 1 increments by interpolating between the field measurements of the topography surrounding the sample site. The incident cosmic ray flux through any sur- face is a strong function of and is only weakly dependent on azimuth angle, . Thus, for our calculations, we ignore the small east–west asymmetry in the cosmic ray flux. The depen- dence of cosmic ray flux on elevation angle arises due to the variation in atmospheric depth through which incoming radia- tion must pass. The atmospheric depth is greatest for neutrons travelling along trajectories near the horizontal and smallest in the zenith direction. The actual angular distribution of cosmic radiation is given by F ð Þ ¼ F0 sin2:3 ð2Þ where F is the intensity of the cosmic radiation at the elevation angle (measured from the horizontal) and F0 is the maximum intensity (at the zenith) (Lal, 1958; Nishiizumi et al., 1989). Because this exponent is derived from a fit to experimental data collected with fixed aperture cosmic ray telescopes, the actual flux at any elevation must be corrected with an additional cos term to account for the decrease in the solid angle as the zenith is approached. Figure 2 Diagram showing the geometry of the shielding calculations. Â and are the azimuth and elevation angles respectively. The plane is recorded as a strike and a dip (labelled ) is described numerically by the normal vector P(s,d). f (Â,) is the direction vector for the cosmic ray flux. É() is the elevation angle of the topography in the direction TROPICAL ALPINE GLACIATION IN THE CORDILLERA BLANCA, PERU 763 Copyright ß 2005 John Wiley Sons, Ltd. J. Quaternary Sci., Vol. 20(7–8) 759–776 (2005)
  • 6. One additional effect arises because the cosmic-ray flux impinging on a horizontal surface from inclinations less than =2 (i.e., the zenith) will be distributed over a larger surface area. When calculating the cosmic-ray flux through a unit sur- face area, this foreshortening factor is given by the cosine of the angle between the normal to the plane and the vector defining the cosmic ray flux. In the general case of a dipping plane, the pole to this surface is given by the vector P s; dð Þ ¼ sin sð Þ sin dð Þ; Àcos sð Þ sin dð Þ; cos dð Þð Þ ð3Þ and the vector defining the cosmic ray flux is f ; ð Þ ¼ cos cos; cos sin; sinð Þ ð4Þ The total foreshortening factor is given by Pðs; dÞ f ð; Þ. The total cosmic ray flux though the unit surface is given as Âf ð; ðÞÞ ¼ X2 ¼0 X=2 ¼maxð; ðÞÞ FðÞ sinðÞP s; dð Þ f ð; Þ d d ð5Þ The Equation (5) summation is performed numerically on the synthetic horizon determined from field data at 1 increments, with the lower elevation limit at each value of being set equal to the greater of the values for the apparent dip angle and the angle to shielding topography, represented by maxð; ðÞ (Fig. 2). In the simple case of unshielded, 2 expo- sure on a horizontal surface, the cosmic ray flux though the unit surface is given as Â0ð; Þ ¼ X2 ¼0 X=2 ¼0 FðÞ sinðÞ d d ð6Þ The shielding factor S is then calculated, S ¼ Âf Â0 ð7Þ Depth correction Because CRN production declines as a function of depth due to the attenuation of the neutron flux with depth, we must take into account the sample thickness to arrive at an estimate for the average production rate for our samples. The depth- dependence of the cosmic ray flux is given by Fd ¼ Fd 0 exp Àmxð Þ ð8Þ where Fd is the flux at depth x (cm), Fd 0 is the flux at x ¼ 0, and m ¼ /Ã, where is the density (g cmÀ3 ) and à is attenuation length (g cmÀ2 ). Typically, a value close to 155 (g cmÀ2 ) is used for à in rocks near the surface where fast nucleon production dominates (see Gosse and Phillips, 2001). However, this is in fact an apparent value that is only appropriate for a vertical sec- tion on a horizontal surface with 2 exposure. For the numer- ical calculation performed here, one must determine the actual attenuation length along the path travelled by a cosmic ray. In order to determine the actual attenuation length for neu- trons travelling along a linear path in, we have performed simu- lations for full 2 exposure on a horizontal surface as a function of depth. These calculations yield a best-fit attenuation length of 205 g cmÀ2 (Fig. 3). The direct numerical approach taken here allows us to easily account for the affects on production at depth due to topographic shielding and surface dip. In gen- eral, increasing dip results in lowered production as a function Figure 3 The depth dependence of the radionuclide production. The dashed line is our numerical calculation using an attenuation length of 204 g cmÀ2 and the solid line is the analytical result using 155 g cmÀ2 764 JOURNAL OF QUATERNARY SCIENCE Copyright ß 2005 John Wiley Sons, Ltd. J. Quaternary Sci., Vol. 20(7–8) 759–776 (2005)
  • 7. of depth (Fig. 4). While these changes can be accounted for explicitly in an analytical approach (Gosse and Phillips, 2001, eq. 3.73), they fall out of the numerical calculations directly. To account for samples of finite thickness, we calculate Equation (7) at several depth intervals along a direction given by Pðs; dÞ and then calculate the mean of these values. We note that presently we are limited to calculations that assume a constant density over the sample thickness. Latitude and altitude scaling The production of CRN in a rock surface depends on both the altitude and the latitude, and therefore a site-specific produc- tion rate must be known to calculate a model age. Because there is little latitudinal variation in the production rate above a latitude of ca. 60 (Lal, 1991; Dunai, 2000), we commonly use a sea-level high-latitude production rate (SLHL) as a refer- ence and a set of latitude and altitude scaling factors to calcu- late the local production at any point on the globe. Calibration of the SLHL production rate of CRNs has typically come from measuring the radionuclide abundance in a surface of known age and calculating the production rate directly. In order to cal- culate the SLHL production rate from a site located at a latitude below 60 , a set of scaling factors must be used and thus the two previously independent models (the SLHL and the scaling factors) are necessarily linked in all future applications. This results in a unique SLHL for each different set of scaling factors. Recently, Stone (2000) has suggested the best-fit value to all the estimates of the SLHL value is 5.1 Æ 0.3 atoms gÀ1 yrÀ1 for 10 Be using a muon contribution based on the results of Heisinger et al. (1997). However, as our sites are at low latitudes and high altitudes, they represent areas that are far from the SLHL refer- ence and our model ages are thus quite sensitive to the SLHL and scaling factors used. Thus, we have also evaluated the model of Dunai (2000) together with the muon contribution from Heisinger et al. (1997) and a best-fit SLHL value of 4.99 atoms gÀ1 yrÀ1 (J. Stone, pers. comm., 2002). Our calcula- tions utilise a spallation fraction of the total nuclide production at sea level of 0.97. For scaling the muon production we have assumed that the latitude effect is the same as in the case of spallation and scale for altitude using an attenuation length of 247 (g cmÀ2 ). Corrections for variations in the geomagnetic field We correct for the variations in palaeomagnetic intensity using the palaeomagnetic correction schemes from Nishiizumi et al. (1989), with modifications to the original method in order to treat sites near the equator. This treatment is essentially the same as that proposed by Dunai (2001). We use the palaeo- magnetic records from Guyodo and Valet (1999) and McEl- hinny and Senanayake (1982), and the Holocene magnetic pole positions from Ohno and Hamano (1992). Essentially, Nishiizumi et al. (1989) generate a time series record of effec- tive palaeolatitudes from the palaeomagnetic records using the relationship coseffpalaeolat ¼ M M0 1=4 cosmagcolat ð9Þ where leffpalaeolat is the effective palaeolatitude, M is the geo- magnetic dipole moment at time t, M0 is the present-day geo- magnetic dipole moment and llat the geographic latitude for Figure 4 The depth-dependence of the radionuclide production as a function of dip. The subsurface production is shown in 10 intervals from 1 to 81 as determined from numerical simulations. Here an attenuation length of 205 g cmÀ2 was used in all the calculations TROPICAL ALPINE GLACIATION IN THE CORDILLERA BLANCA, PERU 765 Copyright ß 2005 John Wiley Sons, Ltd. J. Quaternary Sci., Vol. 20(7–8) 759–776 (2005)
  • 8. the sample site at time t. For times younger than 10 kyr, we use the palaeomagnetic colatitude instead of the geographic lati- tude. The palaeomagnetic colatitude (lmagcolat) is calculated using the spherical trigonometric law of cosines for sides giving cosmagcolat ¼ cosb cosc þ sinb sinc cosA ð10Þ where b is latitude of the palaeopole, c is latitude of the sample site and A is the difference between the longitude of the palaeo- pole and the longitude of the sample site. From this time series of effective palaeolatitudes, one can derive a time series of effective palaeo-production rates using a set of latitude and alti- tude scaling factors. While this is straightforward for sites at latitudes greater than ca. 15 , nearer to the equator the record of the geomagnetic field as a function of time indicates that there were periods of higher geomagnetic field than at present, some of which would imply negative effective latitudes. In order to avoid this diffi- culty for all past time intervals where the palaeomagnetic records generate negative values of the effective palaeolati- tudes, we take the following approach. We transform the scal- ing factors to functions of vertical threshold rigidity using Pc ¼ M 4r2 e cos4 l ð11Þ from Sandstro¨m (1965) where M is the dipole moment and re is the radius of the Earth and ll is the latitude. We note that this equation only holds for a dipole and thus neglects any higher- order terms in the spherical harmonic expansion of the Earth’s magnetic field. However, this simplification is not necessarily detrimental. In fact, past palaeomagnetic records of the Earth’s magnetic field are typically stacked records from sites around the globe and thus tend to average out the higher-order terms and more closely represent an average dipole. Today, except in special locations (see Dunai, 2001), the best representation we have of the palaeomagnetic field is a dipole. Equation (11) can easily be transformed to give the threshold rigidity for a past time using a normalised palaeomagnetic record using the relation PcðtÞ ¼ P0 MðtÞ M0 cos4 l ð12Þ where P0 is the modern threshold rigidity at the magnetic equa- tor, M0 is the modern dipole moment and t is time. Using this function and our transformed scaling factors we can extrapo- late scaling factors to threshold rigidities above modern thresh- old rigidity at the magnetic equator. Performing this calculation for all the time intervals in the past where the palaeomagnetic records generate negative effective palaeolatitudes we con- struct a time series of production rates at the sample site. This sequence is then used to generate a time series of nuclides pro- duced in the time interval represented by each palaeomagnetic observation PðtÞÁtà where t* is the interval of time correspond- ing to P(t). We then calculate time series of nuclide remaining at the present from time t using Np 0; tð Þ ¼ P tð ÞÁtà exp À þ ð Þtð Þ ð13Þ where l is the decay constant for 10 Be and is the steady-state erosion rate in centimetres per year. From this age-weighted time series, we calculate the cumulative radionuclide abun- dance present today for all ages and finally interpolate into this time series to calculate the final calibrated age. We have tested the stability of this numerical procedure on a synthetic time ser- ies with no fluctuations in the intensity of the magnetic field and calculate values to within ca. 3% of the analytical result. One important note here concerns the SLHL production rate used in conjunction with the palaeomagnetic corrections. The SLHL production rates derived from geologic calibration sites may or may not have added corrections for palaeomagnetic field variations over the time of exposure. For instance, if we use our algorithm with the Stone (2000) SLHL production of 5.1 Æ 0.3 atoms gÀ1 yrÀ1 for 10 Be and apply it to the raw data from the Sierra Nevada calibration sites of Nishiizumi et al. (1989) we will not recover the correct exposure time. Thus, in order to use this type of palaeomagnetic correction, we must determine the instantaneous modern SLHL production rate. We define the instantaneous modern SLHL production rate as the value that gives the correct exposure ages of the geologic calibration sites after correcting for fluctuations in the geomag- netic field over time. To this end, we have used the data set of Nishiizumi et al. (1989) and the deglaciation age of Clark and Gillespie (1997) to calculate the instantaneous modern SLHL production rate for use with our palaeomagnetic correction algorithm. We have chosen this dataset as it is of high quality and has undergone many subsequent tests in this area, and is at a latitude where the effects of changes in field strength are quite strong. The best-fit values are 5.44 10 Be atoms gÀ1 yrÀ1 for the correction factors of either Lal (1991) or Stone (2000) or 5.29 10 Be atoms gÀ1 yrÀ1 for the correction factors of Dunai (2001). These values are 5% and 6% respectively higher than the values used in the non-magnetic corrected scheme and reproduce the uncorrected sample ages to better than 2%. For the data presented here, we have used the Stone (2000) for- mulation of the production rates and a modern instantaneous production rate of 5.44 10 Be atoms gÀ1 yrÀ1 for calculations of CRN model age. While the palaeomagnetic records continue to be revised with continued research, there is no doubt that changes in the magnetic field over the period of exposure of most samples have effected the production of CRNs. Thus, we feel it war- ranted to make a reasonable attempt to account for these changes. These corrections have now become a somewhat standard procedure (Shanahan and Zreda, 2000; Dunai, 2001; Balco et al., 2002; Barrows et al., 2002; Desilets and Zreda, 2003) and while we are sure that changes in the state on knowledge of the palaeomagnetic records will effect the absolute value of the ages we calculate, using the records and algorithms we present here puts the reported ages on a common basis with a number of other laboratories around the world. Corrections for local atmospheric effects The altitude scaling factors of Lal (1991) are limited because they are fitted as a function of altitude incorporating a standard atmosphere. Subsequent efforts in deriving scaling factors have instead been based on atmospheric depth (Dunai, 2001; Desilets and Zreda, 2003). Although these incorporate a stan- dard atmosphere model in the published equations, they are not limited to these values. Stone (2000) pointed out that long-term deviations from the standard atmospheric air pres- sure by 20–40 hPa over Antarctica results in an underestima- tion of the production rate and thus an overestimate of the age of Antarctic samples. So, one must take account of such effects elsewhere on the planet. The atmospheric conditions above the central Andes are influenced by the hyper-arid coastal desert, which has a strong but seasonally varying atmo- spheric inversion. Figure 5 shows atmospheric data from sta- tions in the Andean highlands together with the standard atmosphere model (Johnson, 1976), illustrating that the Andean stations deviate significantly from the standard atmospheric model. The best fit to the Andean data gives a model with a 766 JOURNAL OF QUATERNARY SCIENCE Copyright ß 2005 John Wiley Sons, Ltd. J. Quaternary Sci., Vol. 20(7–8) 759–776 (2005)
  • 9. mean sea-level pressure of 1012.8 mbar, an adiabatic lapse rate of 6.5 mK mÀ1 and a mean sea level temperature of 301.73 K. The effect of the inversion is to raise the air tempera- ture with increasing elevation to the top of the inversion layer at between ca. 800 and 1500 m; from this level and above, the central Andean atmosphere can be modelled with a relatively standard adiabat. Thus, to model the high central Andes (above the elevation effected by the coastal inversion which is ca. 1500 m) the best-fit model uses sea-level temperature, which is effectively the extrapolated value of the measured high- elevation temperature versus pressure curve. This value (301.73 K) can then be used with one of the commonly used equations such as that adopted by the International Civil Aviation Organization (ICAO) (Dunai, 2001) p zð Þ ¼ p0 1 À
  • 11. 0 ð14Þ where p(z) is the pressure at altitude h, p0 is the pressure at sea,
  • 12. 0 the adiabatic lapse rate, T0 the sea-level temperature (in kelvins), g0 the standard sea-level gravitational acceleration (9.80665 m sÀ2 ) and, Rd the gas constant (287.05 J kgÀ1 KÀ1 ). It is possible to have tong-term variations in the atmospheric conditions due to global climate fluctuations or tectonic effects. However, the regional effects that give rise to the differ- ences between the central Andean atmosphere and the stan- dard model arise from a combination of factors including high insolation, a topographic barrier and abnormally cold water off the coast. These regional climatic factors have been long lived (Alpers and Brimhall, 1988; Dunai et al., 2005) and thus it is likely that our model is applicable for at least the Quaternary. Validation of the model age calculations We validate the model age calculations using a nearby location with a well-documented chronology based on 14 C dating. First, we briefly review the chronology presented by Rodbell and Seltzer (2000) for Glacial Lake Breque, located approximately 20 km south of our sample locations, and present our new CRN data in order to test the validity of our model ages. Within the Rio Negro drainage (Fig. 1), exposures of Late Pleistocene sediments record a geologic history of glacial deposition followed by lacustrine sedimentation later capped by glacio-fluvial outwash. The most distal portions of the sec- tion contain peat beds that are interbedded with horizontally laminated silt and clay. Radiocarbon dates on two of the peat beds provide maximum-limiting age constraints for the deposi- tion of the massive gravel that is seen throughout much of the eastern part of Glacial Lake Breque. Bulk peat below the gravel yielded a radiocarbon age of 13 280 Æ 190 14 C yr BP and macrofossils higher in the peat section yet still below the gravel yielded an accelerator mass spectrometry (AMS) radiocarbon age of 11 280 Æ 110 14 C yr BP. Deposition of the gravel thus Figure 5 Air pressure versus altitude for sites in the central Andes. The standard atmosphere is calculated assuming a sea-level pressure of 1013.25mbar, an adiabatic lapse rate of 6.5 mKmÀ1 and a sea-level temperature of 288.15 K. The upper curve is our best-fit to the Andean data and is calculated using sea-level pressure of 1012.8mbar, an adiabatic lapse rate of 6.5mKmÀ1 and a sea-level temperature of 301.73 K. Note that all the sea-level sites are well described by the standard sea-level pressure but the high altitudes deviate from the standard model. This suggests that the high-altitude sites can be fitted with a non-standard sea-level temperature. We note, however, that this model is only good for sites above seasonal inversion level TROPICAL ALPINE GLACIATION IN THE CORDILLERA BLANCA, PERU 767 Copyright ß 2005 John Wiley Sons, Ltd. J. Quaternary Sci., Vol. 20(7–8) 759–776 (2005)
  • 13. occurred after ca. 11 300 14 C yr BP. Minimum limiting ages are provided from lake cores taken up-valley of the moraine mark- ing the up-valley margin of the palaeolake basin. Plant macro- fossils from the base of a ca. 6 m deep bog, ca. 1.5 km up-valley from the palaeolake basin, yielded an AMS radiocarbon age of 10 990 Æ 60 14 C yr BP (Rodbell and Seltzer, 2000). These data led Rodbell and Seltzer (2000) to propose the fol- lowing geologic history of the site. The glacier reached the confluence of the Rio Negro and Quebrada Rurec valleys ca. 18 000 14 C yr BP (Rodbell, 1993b). It then retreated at least 3 km from this position and deposited the late glacial moraine prior to ca. 13 300 14 C yr BP. The ice front then retreated at least several kilometres up-valley, allowing the formation of Glacial Lake Breque behind the late glacial moraine. A glacial readvance culminated between 11 280 and 10 990 14 C yr BP or between 13 250 and 13 071 cal. yr BP. The tight chronology presented by Rodbell and Seltzer (2000) led us to sample the late glacial moraine that dammed the lake for CRN analysis. The moraine (Fig. 6) is well pre- served with steep sides and little evidence of significant post- deposition denudation. The moraine crest is strewn with boulders; however, the typical size is ca. 1 m in diameter with a few in the 2 m range. Within the upper Rio Negro drainage, the crystalline bedrock of the Cordillera Blanca is composed predominantly of the Jurassic Chicama formation with few exposures of the Miocene granitoid batholith (McNulty et al., 1998). The boulders along the moraine are almost solely gra- phite-bearing quartzite probably derived from the metamor- phosed Chicama schists near the contact with the batholith. Figure 7 shows the distribution of boulder ages (Table 1) we calculate from samples taken along the ridge crest. Applying the model discussed above and using the latitude and altitude scaling factors of Lal (1991) as recast by Stone (2000), we cal- culate an apparent mean age of 12.1 þ 1 kyr BP. Using the lati- tude and altitude scaling factors of Dunai (2000) we calculate an apparent mean age of 11.2 Æ 0.9 kyr BP. If we take the age of ca. 13.1 cal. kyr BP as a reasonable time for moraine exposure than our model ages are too young by 8% and 14% respec- tively. However, it is likely that at least some post-deposition denudation of the moraine ridge crest did occur prior to stabi- lisation with vegetation cover. If so, then we might expect exhumation of young boulders not long after exposure of the moraine. The relatively small size of the boulders on this mor- aine suggests this scenario is plausible. Furthermore, recent theoretical work (Masarik and Wieler, 2003) has suggested that boulder size may effect the production efficiency at the boulder surface. These models suggest boulders on the order of 1 m in diameter may have a production rate ca. 5% lower relative to that on a semi-infinite half-space. Thus, a more reasonable model might be given by something approaching the maxi- mum apparent age. Considering the oldest ages obtained from the moraine, we are in almost perfect agreement with the 14 C age control. While this strategy is suggested by Putkonen and Swanson (2003), a more conservative approach might be to remove the three young ‘outliers’ in the distribution. In this case, using the altitude and latitude scaling factors of Stone (2000) and Dunai (2000), we calculate apparent mean ages 12.7 Æ 0.8 and 11.8 Æ 0.7 kyr BP, respectively, which are within 5% and 10% of the assumed true value. In either case, at this locality, 9.6 S, 77.4 W, 3940 m, the scaling factors pro- posed by Stone (2000), while yielding apparently low model ages, reproduce 14 C moraine chronology to better than ca. 10% and probably to ca. 5%. The scaling factors of Dunai (2000) yield low model ages, ca. 6% below the ages calculated with Stone (2000). We note that while these conclusions are important for the high central Andes, they are in not indicative of the global accuracy of either set of scaling factors. For this type of general conclusion, tests similar to ours must be done elsewhere. Based on our ability to reproduce accurate CRN ages of the Breque moraine, we suggest that the model ages presented here are appropriate and probably accurate to better than ca. 10% with respect the calibrated 14 C timescale. Discussion Moraine ages The CRN ages we obtain in Quebradas Cojup, Llaca and Ques- hgue suggests moraine crests represent several distinct glacier stillstands and/or advances during the last glacial cycle. The Figure 6 Photograph of the late glacial Breque moraine in the Rio Negro drainage. The moraine crest is well preserved, showing little post-deposition degradation. Boulders along the ridge are typically smaller that those found along the moraines associated with the larger advances of the Last Glacial Maximum (high ridge in the background at 1 o’clock). The sedimentary deposits of the late glacial lake Breque can be seen in the exposures along Rio Negro below the breach of the Breque moraine 768 JOURNAL OF QUATERNARY SCIENCE Copyright ß 2005 John Wiley Sons, Ltd. J. Quaternary Sci., Vol. 20(7–8) 759–776 (2005)
  • 14. ages along individual moraine crests are quite uniform (Table 2, Fig. 8) and clearly indicate that there are at least two generations of isotope stage 2 deposits. The younger LGM ages range from ca. 16 to 18 ka (the Laguna Baja mor- aines, Table 2), with an average age of ca. 16.6 ka. The older LGM ages range from ca. 20 to 30 ka (the Rurec moraines, Table 2), with an average age of ca. 23.4 ka. Plotting of prob- ability density curves following Lowell (1995) suggests an age of 15.4 ka and 19.1 ka for the Laguna Baja and Rurec moraines, respectively (Fig. 9). These moraine ages are stratigraphically consistent with minimum limiting 14 C ages of Rodbell (1993a) at Quebrada Cojup, who suggest minimum ages of ca. 13.5 ka for the Laguna Baja and ca. 19.7 ka for the Rurec mor- aines based on samples extracted from lacustrine deposits directly up-valley. The older ages of Rurec and the age scatter of the ages on the Rurec moraines could be associated with greater boulder inheritance rather than a chronologically dis- tinct advance (Anderson et al., 1996). However, our Laguna Baja moraines ages show relatively little age scatter, and recon- ciling the older age and variability on Rurec moraines by inheritance would require distinctly different boulder transport scenarios for the material in the Laguna Baja and Rurec mor- aines, which seems unlikely given their proximity, identical source area, and similarity in age. Furthermore, Putkonen and Swanson (2003) argue that less than 3% of all moraine boulders should show inheritance and of these only 85% would give ages older than the true deposition age. We there- fore suggest that the Laguna Baja and Rurec moraine exposure ages are consistent with two distinct and separate glacial advances. Based on the lack of moraines of similar preservation and morphology down-valley of the Rurec moraines, the Rurec moraine represents the maximum extent of the last glacial cycle LGM in this area. Given the measured range of boulder ages on the Rurec moraines and our the assumption that inheri- tance is insignificant, we use the oldest age measured from this surface as this should provide the best representation of the actual deposition age. Based on these data, we suggest that gla- ciers emanating from the western Cordillera Blanca advanced to this maximum position by ca. 29 ka at the latest (sample K-10), and persisted at this position until retreat initiating at ca. 20.5 ka. Furthermore, we interpret the Laguna Baja moraines as being deposited either during a hiatus in this retreat or a separate readvance that culminated at ca. 16.5 ka. Retreat from this second LGM maxima was apparently rapid, as no major moraine complexes are preserved for several kilometres up-valley of the Laguna Baja moraines. The ages obtained from the stratigraphically older moraines at Quebradas Cojup and Queshgue (the Cojup moraines of Rodbell (1993a)) are significantly older than the Laguna Baja and Rurec moraines, ranging from ca. 120 to ca. 440 ka, assuming no erosion of the boulder surfaces (Table 3). For these old apparent ages, incorporating the effects of both denudation of the original moraine surface as well as boulder disintegration (boulder erosion) produce significant changes in boulder age (Table 3). At each of the two locations, all samples were col- lected from a single but highly degraded moraine surface, with samples collected from up to ca. 300 m apart. An important note here is that the two oldest ages come from valleys sepa- rated by tens of kilometres and from boulders of different lithol- ogies. Peru-1 comes from the Cojup drainage and is composed of Miocene granodiorite from the batholith core, and PE-98- 981 comes from the Queshgue valley and is a striated and polished quartzite boulder. Interestingly, both these samples come from the largest (3 m) boulders left on their respective moraine surface. In the case of the Queshgue moraine there were only 2 large (1 m) boulders left on the entire surface (PE-98-981, PE-98-982) with the remaining material being of cobble size. Clearly, the preservation of striations and polish Figure 7 10 Be model ages from boulders along the Breque moraine. Filled circles are calculated with the latitude and altitude scaling factors of Stone (2000), the filled squares are calculated using the latitude and altitude scaling factors of Dunai (2000). The band shows the deposition age as deter- mined by Rodbell and Seltzer (2000). While both sets of scaling factors a mean age that is 10–14% younger that the deposition age of the moraine, the oldest ages closely match the 14 C chronology. This suggests post deposition exhumation of younger boulders and indicates that the best estimate for the deposition age is given by the oldest boulders on the surface TROPICAL ALPINE GLACIATION IN THE CORDILLERA BLANCA, PERU 769 Copyright ß 2005 John Wiley Sons, Ltd. J. Quaternary Sci., Vol. 20(7–8) 759–776 (2005)
  • 15. on PE-98-981 (this is also the case for PE-98-982) is evidence of no significant erosion of the boulder surface since deposition or exhumation. It also suggests, that this boulder was transported at the base of the ice and plausibly underwent significant ero- sion during transport to the present location. Both these lines of evidence as well as the large size (which precludes nuclide build-up on all but the original outer surface of the material as it was positioned in place on the outcrop) argue against any inherited radionuclide in this sample. The presence of stria- tions on the PE-98-981 boulder surface may indicate a short duration of subaerial weathering, implying recent exhumation from the moraine. However, we suggest this is not the case, as (1) the quartzite lithology probably weathers exceptionally slowly in this high-altitude, arid environment; and (2) the lack of any other significant boulders other than PE-98-982 on this surface implies boulders are not being progressively exhumed from the moraine subsurface. Thus, while we cannot rule out these minimum ages, it is plausible that these oldest ages (Peru-1, PE-98-981) closely represent a deposition age. We consider the effects on model age that erosion of the boulder surfaces may have had. Using the 10 Be abundance from the boulder with the highest nuclide abundance (PE-98- 981), and making the assumption that the sampled surface was in secular equilibrium with respect to 10 Be concentration, we can put an upper bound on the boulder surface erosion rate from the relation ¼ 1 P N À Ã ð15Þ where is the boulder surface erosion rate. We calculate a maximum possible boulder erosion rate of ca. 1 m MaÀ1 . In Table 3, we use this rate to calculate boulder model ages on the older moraines. Incorporating erosion produces model ages that extend back past 850 ka. However, we previously stated that sample PE-98-981 (the oldest boulder from Quebrada Queshgue) clearly had no significant erosion of the surface since exposure. Thus, we argue the best choice for the model age of this sample is 441 ka, which uses zero erosion of the boulder surface. However, assuming Peru-1 (the oldest boulder from Quebrada Cojup) underwent erosion of 1 m MaÀ1 yields an age of ca. 850 ka. Given that both of these boulders are simi- lar in size, the largest boulders on morphologically and stratigraphically similar moraines, contain similar 10 Be con- centrations, and differ only in lithology leads us to one of two possible scenarios: (1) that neither of these two oldest boulders have undergone significant erosion ( ¼ 0) since expo- sure, giving model ages of 441 ka and 438 ka; or (2) that PE-98- 981 had no erosion and Peru-1 did erode, giving model ages of Figure 8 Quebrada Cojup moraines. Schematic map of the moraines in the area surrounding Quebrada’s Cojup and Llaca. In red are the Laguna Baja moraines dated in this work, in orange the Rurec moraines and in blue are the older pre-last glacial surfaces of the Cojup moraines (Rodbell, 1993a). The photograph is a view looking northeast of Quebrada Cojup in the foreground with Quebrada Llaca in the background. The photograph shows the large Rurec moraine with remnants of the highly denuded Cojup moraine in the lower foreground. Note the generally large size (3 m) of the granitoid boulders on these surfaces in stark contrast to those on the late glacial surfaces (Fig. 6) 770 JOURNAL OF QUATERNARY SCIENCE Copyright ß 2005 John Wiley Sons, Ltd. J. Quaternary Sci., Vol. 20(7–8) 759–776 (2005)
  • 16. 440 ka and 850 ka respectively. Reducing to ca. 0.3 m MaÀ1 (the maximum bound from Smith et al. (2005b) would bring the model age of Peru-1 down to 511 ka. However, the excel- lent agreement between the two model ages assuming ¼ 0 suggests to us that erosion rates on the top surfaces of these large boulders were vanishingly small, and that this is probably the case for the younger moraine boulders as well. At this point, we have only addressed the oldest two ages obtained from the oldest moraine surface; however, the old sur- faces present a wide array of model ages. The likely explana- tions for the variability in the total distribution of CRN ages on these old surfaces is due to either: (a) the surface being a remnant of a now-eroded moraine complex deposited during a single glacial maximum over a limited period of time; or (b) the degraded surface being an intermixed remnant of a several moraine crests deposited in this area at different times whose initial morphology has been destroyed by erosion. Assuming the former explanation, we would take as the age of this event the model age of ca. 440 ka, the oldest boulder age from the surface. The lower ages in this case would represent scatter produced by progressive exhumation of the boulders during the long history of degradation of the original moraine structure. If, however, there were several moraine crests deposited in this area, then the variability in ages can be used to constrain the timing of multiple advances. There is some support in accepting this interpretation, as Putkonen and Swanson (2003) find that the average CRN age range obtained on boulders collected from individual moraines is up to ca. 40% less than the maximum boulder age. That, however, is far smal- ler than the range of ages we obtain from our old surface(s) that span a range up to ca. 85% lower than the maximum age (Table 3). Plotting the probability density of the set of ages from these older degraded moraines produces three separate groupings of data: one at ca. 125 ka, a second at ca. 225, and the third at ca. 440 (Fig. 10). Here we have taken the zero erosion model age and used the maximum age in each of these groupings as an estimate of the minimum deposition age for the moraine (Putkonen and Swanson, 2003). At face value, these ages are roughly correlative with Marine Isotope Stages 6, 8 and 12. A further hint that these ages might in fact represent separate advances comes from other records of ancient tropical glaciations. It is interesting that the ages of the old glaciations of East Africa (Shanahan and Zreda, 2000) show groupings of ages (350–420 ka and 255–285 ka) similar to the old distributions present here. Thus, while we are aware that any interpretation of these age spectra is speculative, we favour the second interpretation. This is based primarily on the large gap in ages between the group of younger ( 250 ka) and older (! 400 ka) ages, rather than the continuous span of ages expected if the boulders were being progressively exhumed as the moraine degrades (Hallet and Putkonen, 1994). However, we cannot distinguish with confi- dence which interpretation of the age scatter is correct, and we acknowledge that poor constraints on the boulder erosion rate and the topographic diffusivity limits the accuracy of these model ages. While the moraine ages we report here likely still have a degree of inaccuracy this is not due to a limitation in the tech- nique of measuring cosmogenic radionuclide concentration. In fact, as we are now recognising more and more ancient land- forms, be they old glacial moraines or hyper-arid deserts (Dunai et al., 2005). We have come to the point where we are limited more by our understanding of the processes that act on landforms since the time of exposure rather than our analytical ability in the laboratory. In the case of dating old gla- cial moraines, further insight into the actual age of deposition can only come from integrated approaches that combine detailed mapping, test sites where older landforms can be dated by independent means, and dating efforts in combination Figure 9 Probability density plot of model ages from the moraines of the last glacial cycle. The colours for the total PDF curves are the same as in Fig. 8. The ages shown are the ages in the maxima of the PDFs; however, we suggest that the best estimate of the depositional age of the surface is given by the maximum age within the distribution TROPICAL ALPINE GLACIATION IN THE CORDILLERA BLANCA, PERU 771 Copyright ß 2005 John Wiley Sons, Ltd. J. Quaternary Sci., Vol. 20(7–8) 759–776 (2005)
  • 17. with rigorous testing of models such as that of proposed by Putkonen and Swanson (2003). Comparison to regional glacial and climate records The chronologies we propose here for the Laguna Baja and Rurec moraines are consistent with data from elsewhere in the central Andes. Smith et al. (2005a), using similar cosmo- genic radionuclide measurements on moraines in valleys adja- cent to Lake Junin in Peru and Lake Titicaca in Bolivia, estimate glaciers reached their maximum extent (their Group C mor- aines) in the last glacial cycle by around ca. 34 ka, and that retreat from this maximum had initiated by ca. 21 ka. Within measurement error, these ages are identical to the timing found on our Rurec moraines. Our Rurec moraine ages and those of Smith et al. (2005a) are consistent with independent palaeocli- mate records from cores taken at Lake Junin and Lake Titicaca that bracket the duration of the local last glacial maximum (LLGM) to ca. 30 to ca. 20 ka, with deglaciation initiating sometime between 22 and 19.5 ka (Seltzer et al., 2002). Smith et al. (2005a) suggest that glaciers in west-facing Lake Junin valleys retreated up-valley from their maximum and stabilised at a new position (their Group B moraines) from ca. 20 to ca. 16 kyr BP. The lack of younger moraines and minimal fluvio- glacial deposit accumulation up-valley of this position indi- cated a rapid retreat from this position commencing around ca. 16 kyr BP. Seltzer et al. (2002) also noted an increase in organic carbon in Lake Junin sediments at around ca. 16 kyr BP, also suggesting the onset of deglaciation at this time. The valley position, ages and lack of moraines preserved up-valley of our Laguna Baja moraines in the Cordillera Blanca are strikingly similar, and suggest they are genetically and chronologically linked to the Group B moraines identified by Smith et al. (2005a). Our data are therefore consistent with a multi-stage LGM occurring synchronously throughout the central Andes, with the maximum in glacial extent occurring from ca. 34 to ca. 21 ka, followed by up-valley retreat (or readvance following more extensive retreat) to a new stillstand that was abandoned around ca. 16 ka upon rapid retreat at the close of the last gla- cial. More broadly, our ages for the Rurec moraines are consis- tent with the timing of the maximum glacier extent (constrained primarily from 14 C) in Colombia, Ecuador, northern and south- ern Peru, Bolivia and Chile, suggesting a synchronous regional glacial maximum (review in Gillespie and Molnar (1995)). The onset of retreat from our Laguna Baja moraines at ca. 16.5 kyr BP is broadly consistent with 14 C dates suggesting retreat had begun at 16.8 cal. yr BP in the Cordillera Vilcanota– Quelccaya region (Mercer and Palacios, 1977), by 16.2 k cal. yr BP in the Lake Junin region and by 14.1 k cal. yr BP in the Cordillera Oriental (Clapperton, 1993; Rodbell, 1993b). Although glacial extent probably reflects both precipitation and temperature, glacial levels in the Cordillera Blanca are sen- sitive indicators of temperature (Lliboutry et al., 1977). There- fore, palaeosnowlines can be used to estimate decreases in mean annual temperature (see Rodbell, 1992). While snowline depression can be strongly influenced by local factors such as proximity to local moisture sources, the geometry of the catch- ments and the local topography, there is no doubt that signifi- cant regional snowline depression occurred during the last glacial cycle in the Cordillera Blanca. Based on the present atmospheric lapse rate of between 6 and 7.5 C kmÀ1 (Seltzer, 1990) and the snowline depression recorded in the moraine record (moraines at 1.2 km below present terminus), we esti- mate about an 8 C mean annual temperature difference between the conditions during the LGM and present. While this is only a rough estimate and may overestimate the actual regio- nal equilibrium line altitude depression (Smith et al., 2005a), it does indicate significant cooling in the tropics during the last glacial and is consistent with estimates derived from geochem- ical (Stute et al., 1995), isotopic (Thompson et al., 1995), gla- cial (Rodbell, 1992) and palynological (Colinvaux et al., 1996; Thouret et al., 1996) studies throughout the tropical Andes and the Amazon basin. Comparison with Northern Hemisphere glacial records Combined with other records of glaciation in South America, our new dates allow comparison between the timing and extent of glaciation in the tropics relative to higher latitudes, Figure 10 Probability density plot of model ages from the Cojup moraines. The colours for the total PDF curve are the same as in Fig. 9 772 JOURNAL OF QUATERNARY SCIENCE Copyright ß 2005 John Wiley Sons, Ltd. J. Quaternary Sci., Vol. 20(7–8) 759–776 (2005)
  • 18. and particularly to the Northern Hemisphere. Seltzer et al. (2002) and Smith et al. (2005a) have suggested that the timing of the maximum extent of glaciation during the LGM was ear- lier in the tropical Andes than in the northern high latitudes. Our ages from the Cordillera Blanca are consistent with the interpretation of an early glacial maximum, as retreat from maximum glacial extent was underway here by ca. 20.5 ka, several thousand years before the classic last glacial maximum as recorded in proxy records for global ice volume. Smith et al. (2005a) argue that this difference in timing was produced by glacier expansion associated with a regional increase in preci- pitation and cooling temperatures occurring ca. 38 kyr BP, with glaciers obtaining maximum extent around ca. 34 kyr BP and retreating following warming around ca. 21 kyr BP. Comparison of our ages with northern hemisphere climate records indicates that this chronology may be global in scope. Balco et al. (2002), in dating New England coastal moraines with cosmogenic radionuclides, recognise a multi-staged last glacial maximum for the southeastern margin of the Laurentide ice sheet. The ice sheet appears to have reached its maximum extent by at least 25 kyr BP at this location, and was in retreat from this position by ca. 22 kyr BP (Balco et al., 2002). The old- est CRN age obtained by Balco et al. (2002) on this moraine is ca. 30 kyr BP, which is identical, within error, to the oldest age of ca. 31 kyr BP we obtain on our Rurec moraines in the Cordillera. The minimum limiting age at which maximum ice extent was obtained at Junin was determined by using the oldest CRN age from the Group C moraines of Smith et al. (2005a), and we suggest that the ca. 30 kyr BP age of Balco et al. (2002) could similarly be a minimum limiting age for when maximum ice extent was reached by the Laurentide ice sheet at that location. Given that Smith et al. (2005a) collected and analysed a factor of three more samples than either Balco et al. (2002) or our study, there exists a greater probability that they sampled farther out on the upper tail of the boulder CRN age distribution. Thus, the apparent asynchroneity in the onset of maximum ice extent may simply reflect the collection of more samples. Regardless, the dates of Balco et al. (2002) suggest that, at most, the maximum extent of the Laurentide ice sheet was reached only a few thousand years later (ca. 30 kyr BP vs. ca. 34 kyr BP) after it was reached in the tropical Andes. In addition, Balco et al. (2002) suggest the maximum possible age for the timing of retreat from the Laurentide term- inal moraine is probably ca. 23 ka, with a minimum age of ca. 19 ka provided by dates on a younger moraine complex depos- ited after retreat from the glacial maximum. Balco et al. (2002), citing Lowell et al. (1999), note that the timing of retreat at Martha’s Vineyard is nearly identical to the age of moraines in Ohio that mark the furthest extent of Wisconsinan Lauren- tide ice advance. Taken together, these dates suggest that the southeastern and southern margin of the Laurentide ice sheet reached and retreated from its maximum extent nearly syn- chronously (within a few thousand years) with valley glaciers in the tropical Andes and with the termination of Heinrich event 2 (Balco et al., 2002). The initiation of rapid retreat from our Laguna Baja moraines and the Group B moraines of Smith et al. (2005a) at ca. 16 ka also appears synchronous, within error, with the initiation of rapid ice sheet and valley glacier retreat from terminal mor- aines in North America. Porter and Swanson (1998) conclude that the Puget Lobe of the Cordilleran Ice Sheet reached its southern LGM limit at ca. 16 950 calendar yr BP, remained there for ca. 100 yr, and then retreated rapidly. Cosmogenic radionuclide dating on moraines suggest retreat from the last major LGM stillstand moraines in the Wind River Range, Wyoming (QPt1-FL of Gosse et al., 1995; Pinedale 1–3 of Phillips et al., 1997) and in the Sierra Nevada, California (Tioga 3 of Phillips et al., 1996), also occurred at ca. 16 kyr BP. Gosse et al. (1995) note that deglaciation following abandonment of this stillstand was probably rapid. Phillips et al. (1997) suggest that these moraine ages imply nearly synchronous climate for- cing over western North American. These studies suggest that the initiation of glacier retreat at the close of the last glacial cycle occurred nearly simultaneously in western North Amer- ica and the tropical Andes, and that the retreat was rapid in both regions. While our age data suggests two distinct LGM moraine groups (ca. 24 ka and ca. 18 ka), it alone does not necessitate two separate advances (e.g. the Laguna Baja moraines may simply mark the recession from the Rurec moraines). However, palynological and climatic and regional studies lend support the idea of two distinct advances (Clapperton, 1993; Thouret et al., 1996). The timing of the LGM advances in the Cordillera Blanca matches (within error) Heinrich events 1 (ca. 16.5 ka) and 2 (ca. 23.0 ka), is similar to the moraine chronologies in temperate North and South America (Lowell et al., 1995; Phillips et al., 1997), and changes in isotopic compositions from marine records in the tropical Pacific and temperate Atlantic basins (Bard et al., 1987, 1997; Linsley, 1996). Thus, our new data suggest that this multiple event was a rapid, global-scale climatic event, as supporting models of large and high-frequency climate instability at the end of the at the end of the last glacial cycle (Broecker and Denton, 1994; Helmens et al., 1997). Conclusions The moraine history of the Cordillera Blanca is both more pro- tracted and more complicated than had previously been recog- nised. As in some locations in the western USA, for example Phillips et al. (1997), there appears to be an absence of deposits during isotope stage 4 age in the Cordillera Blanca. The isotope stage 4 advances thus appear less significant in the Peruvian Andes than those preceding and following. While our exposure age estimate of ca. 440 ka for the Cojup moraines is based on only two ages, together our data clearly demonstrate the exis- tence of older Andean glaciations that pre-date the last intergla- cial in the Cordillera Blanca. This conclusion is consistent with those of numerous authors have postulated that older deposits beyond the limits of the LLGM in Chile, Peru, and Ecuador might indeed be associated with events that pre-date the last interglacial. While studies of the older moraines in Peru and Bolivia suggested they were probably deposited during the cold stage of MIS 4 (Clapperton et al., 1997; Mercer, 1984; Seltzer, 1990), workers in Colombia, Ecuador and Chile have suggested that these older deposits were from the penultimate glaciation most likely of marine stage 6 or 8 (Clapperton et al., 1995; Heine, 1995). More recently, Kaplan et al. (2005) have also found pre-last glacial deposits in the age range 300–650 ka from southern Argentina. Thus, our evidence for an extensive glacial advance at 400 ka, together with the existence of structurally even older moraines, still undated, at lower eleva- tions in the Cordillera Blanca, suggests that maximum tropical alpine ice volumes occurred during previous glacials (MIS 12?) and not at the close of the last glacial. Records of global cooling as recorded in marine sediments suggest that older glacial cycles (cf. MIS 6, 8, 12) were not significantly cooler that that of MIS 2. However, globally, alpine moraines suggest that these older glaciations had much more significant ice volumes. While part of this apparent increase in moraine size in the past might be due to imperfect preservation, this cannot explain the TROPICAL ALPINE GLACIATION IN THE CORDILLERA BLANCA, PERU 773 Copyright ß 2005 John Wiley Sons, Ltd. J. Quaternary Sci., Vol. 20(7–8) 759–776 (2005)
  • 19. entire trend. Thus, it appears that alpine glaciers are very sen- sitive indicators and integrators of local to regional climate pat- terns and the effect of glacial cycles on the regional climates has changed over time. Our data, together with other records of moraines from around the globe, suggest that the terminal lobes of continental ice sheets as well as mountain glaciers were moving in concert with each other but not necessarily with records of global ice volume. Thus, the apparent asynchronous timing of the LGM in the tropics proposed by Smith et al. (2005a) may be more a reflection of either the time constants of the response of the proxy records or manifestations of a response to different cli- mate forcings (i.e. moisture versus temperature). In either case the large number of records of the timing of moraine deposition from around the globe is at least beginning to hint at underlying physical differences in the proxy climate records. The high degree of continuity between records of alpine moraine deposition on the high northern and southern latitudes as well as in the tropics indicates that the likely cause of these high- frequency climatic reversals is linked to changes in the dynamics of the ocean–atmosphere system, and not to forcing due to variations in the Earth’s orbit. However, recent models of climatic teleconnections between the northern Atlantic and Pacific basins (Mikolajewicz et al., 1997) do not explain the coupling between the northern and southern hemispheres implied by our tropical moraine record and that of Lowell et al. (1995). Coupling between the northern Atlantic and tropical South American climates may occur via changes in the trade-wind strength linked to North Atlantic sea surface temperatures (Overpeck et al., 1989). Indeed, this model accounts for both the fluctuations in alpine glaciers we mea- sure, as well as changes in biological productivity during the last deglaciation observed in sediment cores from the tropical Atlantic basin (Hughen et al., 1996). Thus, our new data demonstrates the applicability of expo- sure age dating on tropical moraines and indicates that climate instability at the end of the last glacial was global. Confirmation of these results by future studies should lead to both a much clearer understanding of the past history of tropical glaciers and icecaps, and the teleconnections of global climate provid- ing a firmer basis for assessing the magnitude and timing of future climate change. Finally, the high degree of coherence between the chronol- ogy presented here and those of Smith et al. (2005a, 2005b) illustrates that we are now in a position to accurately map palaeoice extent and equilibrium altitude level depression and thus make meaningful inferences about the about the nature of regional climate and topographic effects in the con- text of global climate change. Acknowledgements We thank INGEMMET for support during the course of the fieldwork, especially Victor Torres, Oscar Palacios and the ever-helpful Teodoro Enrique. Numerous people joined us during this fieldwork and while any errors in the manuscript are solely the responsibility of the authors, we are sure many of the ideas presented in this work greatly benefited from observations and conversations with Brian Mark, Geoff Seltzer, Sarah Hall, Anne Sophie-Meriaux, Jacquie Smith, Robert Anderson, Brendan McNulty and Megan DeSmedt who completed an undergraduate senior thesis on a portion of this work while at William and Mary. The manuscript benefited signifi- cantly from a thorough review by Lewis Owen. This work was sup- ported by IGPP-Livermore (D.L.F.), the US NSF EAR 9802825 (D.L.F.), EAR 0126309 (D.L.F.), EAR9418886 (D.R.), Jeffress Memorial Trust Grant J-161(G.S.H.), and a College of William and Mary Summer Faculty Research Grant (G.S.H.). Lastly, we are all greatly indebted to work of Geoff Seltzer, but more importantly, for his support, inspiration and encouragement for us to pursue chronologic studies of Andean glaciations and their relationship with global climate change. References Alpers CN, Brimhall GH. 1988. Middle Miocene climatic change in the Atacama Desert, northern Chile: evidence from supergene minerali- zation at La Escondia. Geological Society of America Bulletin 100: 1640–1656. Anderson RS, Repka JL, Dick GS. 1996. Explicit treatment of inheri- tance in dating depositional surfaces using in situ Be-10 and Al-26. Geology 24: 47–51. Balco G, Stone JOH, Porter SC, Caffee MW. 2002. Cosmogenic- nuclide ages for New England coastal moraines, Martha’s Vineyard and Cape Cod, Massachusetts, USA. Quaternary Science Reviews 21: 2127–2135. Bard E, Arnold M, Maurice P, Duprat J, Moyes J, Duplessy J-C. 1987. Retreat velocity of the North American polar front during the last deglaciation determined by 14 C accelerator mass spectrometry. Nature 328: 791–794. Bard E, Rostek F, Sonzogni C. 1997. Interhemispheric synchrony of the last degalciation inferred from alkenone paleothermometry. Nature 385: 707–710. Barrows TT, Stone JO, Fifield LK, Cresswell RG. 2002. The timing of the last glacial maximum in Australia: ice sheets and sea level of the last glacial maximum. Quaternary Science Reviews 21: 159–173. Bond GC, Lotti R. 1995. Iceberg discharges into the North Atlantic on millennial timescales during the last glaciation. Science 267: 1005– 1010. Broecker WS. 1994. Massive iceberg discharges as triggers for global climate change. Nature 372: 421–424. Broecker WS, Denton GH. 1994. The role of ocean-atmosphere reor- ganizations in glacial cycles. Quaternary Science Reviews 9: 305– 341. Chevalier ML, Ryerson FJ, Tapponnier P, Finkel RC, Van der Woerd J, Li HB, Liu Q. 2005. Slip-rate measurements on the Karakorum Fault may imply secular variations in fault motion. Science 307: 411–414. Clapperton CM. 1972. The Pleistocene moraine stages of west-central Peru. Journal of Glaciology 11: 255–263. Clapperton CM. 1981. Quaternary glaciations in the Cordillera Blanca, Peru, and the Cordillera Real, Bolivia. Memoria del Primer Semi- nario Sobre el cuaternario de Colombia Bogota, Agosto 25 al 29 de 1980: Revista Centro Iteramericano de Fotointertretacion C.I.A.F 6: 93–111. Clapperton CM. 1993. Glacier readvances in the Andes at 12,500– 10,000 yr BB: implications for mechanism of Late-glacial climatic change. Journal of Quaternary Science 58: 197–215. Clapperton CM, Sugden DE, Kaufman DS, McCulloch RD. 1995. The last glaciation in Central Magellan Strait, southernmost Chile. Qua- ternary Research 44: 133–144. Clapperton CM, Hall M, Mothes P, Hole MJ, Still JW, Helmens KF, Kuhry P, Gemmell AMD. 1997. A Younger Dryas icecap in the Equa- torial Andes. Quaternary Research 47: 13–28. Clark DH, Gillespie AR. 1997. Timing and significance of late-glacial and Holocene cirque glaciation in the Sierra Nevada, California. Quaternary International 38–9: 21–38. Colinvaux PA, Oliveira PE, Moreno JE, Miller MC, Bush MB. 1996. A long pollen record from lowland Amazonia: forest and cooling in glacial times. Science 274: 85–88. Dansgaard W, Johnsen SJ, Clausen HB, Dahl-Jensen DS, Gundestrup N, Hammer CU, Hvidberg CS, Steffensen JP, Sveinsbjornsdottir AE, Jouzel J, Bond G. 1993. Evidence for general instability of past cli- mate from a 250 kyr ice-core record. Nature 364 218–220. Desilets D, Zreda M. 2003. Spatial and temporal distribution of second- ary cosmic-ray nucleon intensities and applications to in situ cosmo- genic dating. Earth and Planetary Science Letters 206: 21–42. Dunai TJ. 2000. Scaling factors for production rates of in situ produced cosmogenic nuclides: a critical reevaluation. Earth and Planetary Science Letters 176: 157–169. 774 JOURNAL OF QUATERNARY SCIENCE Copyright ß 2005 John Wiley Sons, Ltd. J. Quaternary Sci., Vol. 20(7–8) 759–776 (2005)
  • 20. Dunai TJ. 2001. Infuence of secular variation of the geomagnetic field on production rates of in situ produced cosmogenic nuclides. Earth and Planetary Science Letters 193: 197–212. Dunai TJ, Lopez GAG, Juez-Larre J. 2005. Oligocene–Miocene age of aridity in the Atacama Desert revealed by exposure dating of erosion- sensitive landforms. Geology 33: 321–324. Fairbanks RG. 1989. A 17,000-year glacio-eustatic sea level record: Influence of glacial melting rates on the Younger Dryas event and deep-ocean circulation. Nature 342: 637–642. Gillespie A, Molnar P. 1995. Asynchronous maximum advances of mountain and continental glaciers. Reviews of Geophysics 33: 311–364. Gosse JC, Phillips FM. 2001. Terrestrial in situ cosmogenic nuclides: theory and application: Quaternary Science Reviews 20(14): 1475–1560. Gosse JC, Klein J, Evenson EB, Lawn B, Middleton R. 1995. Beryllium- 10 dating of the duration and retreat of the last Pinedale glacial sequence. Science 268: 1329–1333. Guilderson TP, Fairbanks RG, Rubenstone JL. 1994. Tropical tempera- ture variations since 20,000 years ago: modulating interhemispheric climate change. Science 263: 663–665. Guyodo Y, Valet J-P. 1999. Global changes in intensity of the Earth’s magnetic field during the past 800 kyr. Nature 399: 249–252. Hallet B, Putkonen J. 1994. Surface dating of dynamic landforms: young boulders on aging moraines. Science 265: 937–940. Heimsath AM, Dietrich WE, Nishiizumi K, Finkel RC. 1997. The soil production function and landscape equilibrium. Nature 388: 358–361. Heimsath AM, Dietrich WE, Nishiizumi K, Finkel RC. 1999. Cosmo- genic nuclides, topography, and the spatial variation of soil depth. Geomorphology 27: 151–172. Heine JT. 1995. Late Quaternary glacier advances in the Ecuadorian Andes: a preliminary report. In Quaternary of South America and Antarctic Peninsula, Vol. 9, Rabassa J, Salemme M (eds). Balkema: Rotterdam; 1–22. Heisinger B, Niedermayer M, Hartmann JF, Korschinek G, Nolte E, Morteani G, Neumaier S, Petitjean C, Kubik P, Synal A, Ivy-Ochs S. 1997. In-situ production of radionuclides at great depths. Nuclear Instruments and Methods in Physics Research B 123: 341–346. Helmens KF, Rutter NW, Kuhry P. 1997. Glacier fluctuations in the eastern Andes of Colombia (South America) during the last 45,000 radiocarbon years. Quaternary International 38/39: 39–48. Hughen KA, Overpeck JT, Peterson LC, Trumbore S. 1996. Rapid cli- mate changes in the tropical Atlantic region during the last deglacia- tion. Nature 380: 51–54. Johnson AM. 1976. Climate of Peru´, Bolivia and Ecuador. In Climates of Central And South America: World Survey of Climatology, Vol. 12, Schwerdtfeger W (ed.). Elsevier: New York; 147–200. Kaplan MR, Douglass DC, Singer BS, Caffee MW. 2005. Cosmogenic nuclide chronology of pre-last glacial maximum moraines at Lago Buenos Aires, 46 degrees S, Argentina. Quaternary Research 63: 301–315. Kitagawa H, vander Plicht J. 1998. Atmospheric radiocarbon calibra- tion to 45,000 yr B.P. Late glacial fluctuations and cosmogenic iso- tope production. Science 279: 1187–1190. Kohl CP, Nishiizumi K. 1992. Chemical isolation of quartz for measure- ment of in situ produced cosmogenic radionuclides. Geochimica et Cosmochimica Acta 56: 3583–3587. Lal D. 1958. Investigations of nuclear reactions produced by cosmic rays, PhD thesis, Tata Institute of Fundamental Research, Bombay. Lal D. 1991. Cosmic ray labeling of erosion surfaces: in situ nuclide production rates and erosion models. Earth and Planetary Science Letters 104: 424–439. Linsley BK. 1996. Oxygen-isotope record of sea-level and climate variations in the Sula Sea over the past 150,000 years. Nature 380: 234–237. Lliboutry L, Arnao BM, Scheider B. 1977. Glaciological problems set by the control of dangerous lakes in the Cordillera Blanca, Peru. III. Study of moraines and mass balances at Safuna. Journal of Glaciology 18: 275–290. Lowell TV. 1995. The application of radiocarbon age estimates to the dating of glacial sequences; an example from the Miami Sublobe, Ohio, U.S.A. Quaternary Science Reviews 14: 85–99. Lowell TV, Heusser CJ, Anderson BG, Moreno PI, Hauser A, Heusser LE, Schlu¨chter C, Marchant DR, Denton GH. 1995. Interhemispheric correlation of Late Pleistocene glacial events. Science 269: 1541–1549. Lowell TV, Hayward RK, Denton GH. 1999. Role of climate oscilla- tions in determining ice-margin position: hypothesis, examples, and implications. In Glacial Processes Past and Present, Mickelson DM, Attig JW (eds). Geological Society of America Special Paper 337, Geological Society of America: Boulder, CO; 193–203. Martin L, Fournier M, Mourguiart P, Sifeddine A, Turcq B, Absy ML, Flexor JM. 1993. Southern Oscillation signal in South American paleoclimatic data of the last 7000 years. Quaternary Research 39: 338–346. Masarik J, Wieler R. 2003. Production rates of cosmogenic nuclides in boulders. Earth and Planetary Science Letters 216: 201–208. McElhinny MW, Senanayake WE. 1982. Variations in the geomagnetic dipole 1: the past 50,000 years. Journal of Geomagnetism and Geoe- lectricity 34: 39–51. McNulty BA, Farber DL, Wallace GS, Lopez R, Palacios O. 1998. Role of plate kinematics and plate-slip-vector partitioning in continental magmatic arcs; evidence from the Cordillera Blanca, Peru. Geology (Boulder) 26: 827–830. Mercer JH. 1983. Cenozoic glaciation in the southern hemisphere. Annual Reviews of Earth and Planetary Sciences 11: 99–132. Mercer JH. 1984. Late Cainozoic glacial variation in South America south of the Equator. In Late Cainozoic Paleoclimates of the Southern Hemisphere, Vogel JC (ed.). A. A. Balkema: Rotterdam; 45–58. Mercer JH, Palacios O. 1977. Radiocarbon dating of the last glaciation in Peru. Geology 5: 600–604. Mikolajewicz U, Crowley TJ, Schiller A, Voss R. 1997. Modelling tele- connections between the North Atlantic and North Pacific during the Younger Dryas. Nature 387: 384–387. Nishiizumi K, Winterer EL, Kohl CP, Klein J, Middleton R, Lal D, Arnold JR. 1989. Cosmic ray production rates of 10 Be and 26 Al in quartz from glacially polished rocks. Journal of Geophysical Research 94: 17 907–17 915. Ohno M, Hamano Y. 1992. Geomagnetic poles over the last 10,000 years. Geophysical Research Letters 19: 1715–1718. Overpeck JT, Peterson LC, Kipp N, Imbrie J, Rind D. 1989. Climate change in the circum-north Atlantic region during the last deglacia- tion. Nature 338: 553–557. Phillips FM, Zreda MG, Benson LV, Plummer MA, Elmore D, Sharma P. 1996. Chronology for fluctuations in late Pleistocene Sierra Nevada glaciers and lakes. Science 274: 749–751. Phillips FM, Zreda MG, Gosse J, Evenson EB, Hall RD, Chadwick OA, Sharma P. 1997. Cosmogenic 36 Cl and 10 Be ages of Quaternary gla- cial and fluvial deposits of the Wind River Range, Wyoming. Geolo- gical Society of America Bulletin 109: 1453–1463. Porter SC, Swanson TW. 1998. Radiocarbon age constraints on rates of advance and retreat of the Puget Lobe of the Cordilleran ice sheet during the last glaciation. Quaternary Research (New York) 50: 205–213. Putkonen J, Swanson T. 2003. Accuracy of cosmogenic ages for moraines. Quaternary Research (New York) 59: 255–261. Rodbell DT. 1992. Late Pleistocene equilibrium-line altitude reconstructions in the northern Peruvian Andes. Boreas 21: 43–52. Rodbell DT. 1993a. Subdivisions of late Pleistocene moraines in the Cordillera Blanca, Peru, based on rock-weathering features, soils and radiocarbon dates. Quaternary Research 39: 133–142. Rodbell DT. 1993b. The timing of the last deglaciation in the Cordillera Oriental, northern Peru, based on glacial geology and lake sedimen- tology. Geological Society of America Bulletin 105: 923–924. Rodbell DT, Seltzer GO. 2000. Rapid ice margin fluctuations during the Younger Dryas in the tropical Andes. Quaternary Research (New York) 54: 328–338. Sandstro¨m AE. 1965. Cosmic Ray Physics. Wiley: New York. Seltzer GO. 1990. Recent glacial history and paleoclimate of the Peruvian-Bolivian Andes. Quaternary Science Reviews 9: 137–152. Seltzer GO, Rodbell DT, Baker PA, Fritz SC, Tapia PM, Rowe HD, Dunbar RB. 2002. Early warming of tropical South America at the last glacial-interglacial transition. Science 296: 1685–1686. TROPICAL ALPINE GLACIATION IN THE CORDILLERA BLANCA, PERU 775 Copyright ß 2005 John Wiley Sons, Ltd. J. Quaternary Sci., Vol. 20(7–8) 759–776 (2005)
  • 21. Shanahan TM, Zreda M. 2000. Chronology of quaternary glaciations in East Africa. Earth and Planetary Science Letters 77: 23–42. Smith JA, Seltzer GO, Farber DL, Rodbell DT, Finkel RC. 2005a. Early local last glacial maximum in the tropical Andes. Science 308: 678–681. Smith JA, Finkel RC, Farber DL, Rodbell DT, Seltzer GO. 2005b. Moraine preservation and boulder erosion in the tropical Andes: interpreting old surface exposure ages in glaciated valleys. Journal of Quaternary Science 20: 735–758. Stone JOH. 2000. Air pressure and cosmogenic isotope production. Journal of Geophysical Research 105: 23753–23759. Stuiver M, Reimer PJ. 1993. Extended 14 C data base and revised CALIB 3.0 14 C age calibration program. Radiocarbon 35: 215–230. Stute M, Forster M, Frischkorn H, Serejo A, Clark JF, Schlosser P, Broecker WS, Bonani G. 1995. Cooling of tropical Brazil (5 C) during the last glacial maximum. Science 269: 379–383. Thompson LG, Mosley-Thompson E, Davis ME, Lin P-n, Henderson KA, Cole-Dai J, Bolzan JF, Liu K-b. 1995. Late glacial stage and Holocene tropical ice core records from Huascaran, Peru´. Science 2698: 46–50. Thouret J, Hammen TVd, Salomons B, Juvigne E. 1996. Paleoenviron- mental changes and glacial stages of the last 50,000 years in the Cordillera Central, Columbia. Quaternary Research 46: 1–18. 776 JOURNAL OF QUATERNARY SCIENCE Copyright ß 2005 John Wiley Sons, Ltd. J. Quaternary Sci., Vol. 20(7–8) 759–776 (2005)