Sun TV can be bought for target of Rs430 for the mid- to long-term according to Firstcall
•
0 likes•243 views

Sun TV Network reported financial results for Q3 FY15 with net profit of Rs. 2141.30 million, up 15.25% YoY. Revenue rose 8.68% YoY to Rs. 5524.40 million. EPS was Rs. 5.43. Operating profit grew 16.49% YoY. The company declared an interim dividend of Rs. 6.75 per share. Revenue from DTH was up 18% YoY and advertising revenue grew 7% YoY. The document provides an analysis of Sun TV Network's financial performance and outlook, recommending the stock as a buy.

Recommended
Recommended
More Related Content
What's hot
What's hot (19)
Similar to Sun TV can be bought for target of Rs430 for the mid- to long-term according to Firstcall
Similar to Sun TV can be bought for target of Rs430 for the mid- to long-term according to Firstcall (20)
More from IndiaNotes.com
More from IndiaNotes.com (20)
Recently uploaded
Recently uploaded (20)
Sun TV can be bought for target of Rs430 for the mid- to long-term according to Firstcall
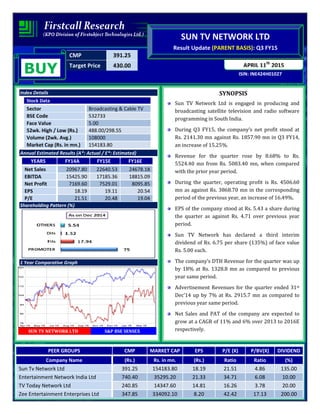
- 1. CMP 391.25 Target Price 430.00 ISIN: INE424H01027 APRIL 11th 2015 SUN TV NETWORK LTD Result Update (PARENT BASIS): Q3 FY15 BUY Index Details Stock Data Sector Broadcasting & Cable TV BSE Code 532733 Face Value 5.00 52wk. High / Low (Rs.) 488.00/298.55 Volume (2wk. Avg.) 108000 Market Cap (Rs. in mn.) 154183.80 Annual Estimated Results (A*: Actual / E*: Estimated) YEARS FY14A FY15E FY16E Net Sales 20967.80 22640.53 24678.18 EBITDA 15425.90 17185.36 18815.09 Net Profit 7169.60 7529.01 8095.85 EPS 18.19 19.11 20.54 P/E 21.51 20.48 19.04 Shareholding Pattern (%) 1 Year Comparative Graph SUN TV NETWORK LTD S&P BSE SENSEX SYNOPSIS Sun TV Network Ltd is engaged in producing and broadcasting satellite television and radio software programming in South India. During Q3 FY15, the company’s net profit stood at Rs. 2141.30 mn against Rs. 1857.90 mn in Q3 FY14, an increase of 15.25%. Revenue for the quarter rose by 8.68% to Rs. 5524.40 mn from Rs. 5083.40 mn, when compared with the prior year period. During the quarter, operating profit is Rs. 4506.60 mn as against Rs. 3868.70 mn in the corresponding period of the previous year, an increase of 16.49%. EPS of the company stood at Rs. 5.43 a share during the quarter as against Rs. 4.71 over previous year period. Sun TV Network has declared a third interim dividend of Rs. 6.75 per share (135%) of face value Rs. 5.00 each. The company’s DTH Revenue for the quarter was up by 18% at Rs. 1328.8 mn as compared to previous year same period. Advertisement Revenues for the quarter ended 31st Dec’14 up by 7% at Rs. 2915.7 mn as compared to previous year same period. Net Sales and PAT of the company are expected to grow at a CAGR of 11% and 6% over 2013 to 2016E respectively. PEER GROUPS CMP MARKET CAP EPS P/E (X) P/BV(X) DIVIDEND Company Name (Rs.) Rs. in mn. (Rs.) Ratio Ratio (%) Sun Tv Network Ltd 391.25 154183.80 18.19 21.51 4.86 135.00 Entertainment Network India Ltd 740.40 35295.20 21.33 34.71 6.08 10.00 TV Today Network Ltd 240.85 14347.60 14.81 16.26 3.78 20.00 Zee Entertainment Enterprises Ltd 347.85 334092.10 8.20 42.42 17.13 200.00
- 2. QUARTERLY HIGHLIGHTS (PARENT BASIS) Results Updates- Q3 FY15 Sun TV Network Ltd (Sun TV) was incorporated in 1985 and is engaged in producing and broadcasting satellite television and radio software programming has reported its financial results for the quarter ended 31 Dec, 2014. The company’s net profit stood at Rs. 2141.30 million against Rs. 1857.90 million in the corresponding quarter ending of previous year, an increase of 15.25%. Revenue for the quarter rose by 8.68% to Rs. 5524.40 million from Rs. 5083.40 million, when compared with the prior year period. Reported earnings per share of the company stood at Rs. 5.43 a share during the quarter as against Rs. 4.71 over previous year period. Profit before interest, depreciation and tax is Rs. 4506.60 million as against Rs. 3868.70 million in the corresponding period of the previous year. Break up of Expenditure Months Dec-14 Dec-13 % Change Net Sales 5524.40 5083.40 8.68 PAT 2141.30 1857.90 15.25 EPS 5.43 4.71 15.25 EBITDA 4506.60 3868.70 16.49 Break up of Expenditure (Rs in millions) Q3 FY15 Q3 FY14 % CHNG Cost of Revenues 420.20 526.80 -20% Employee Remuneration & Benefit 556.90 494.20 13% Other Expenses 266.60 342.20 -22% Depreciation & Amortization 1254.10 1060.60 18%
- 3. Latest Updates • Sun TV Network Ltd has declared a third interim dividend of Rs. 6.75 per share (135%) of face value Rs. 5.00 each. • The company’s DTH Revenue for the quarter was up by 18% at Rs. 1328.8 mn as compared to previous year same period. • Advertisement Revenues for the quarter ended 31st Dec’14 up by 7% at Rs. 2915.7 mn as compared to previous year same period. COMPANY PROFILE Sun TV Network Limited (Sun TV) was incorporated in 1985 and is based in Chennai, India. The company is engaged in producing and broadcasting satellite television and radio software programming in the regional languages of South India. The company operates in a single segment Broadcasting. The Company operating satellite television channels across four languages of Tamil, Telugu, Kannada and Malayalam. Sun TV Network Limited, India's largest media Conglomerate has power packed Thirty Three TV Channels with the reach of more than 95 million households in India. Sun TV Network's channels can be Viewed in 27 countries including U.S.A, Canada, Europe, Singapore, Malaysia, Srilanka, South Africa, Australia and New Zealand. The company provides entertainment in various genres of general entertainment, news, music, action, life, movies, kids, and comedy. In addition, the company undertakes production and distribution of movies in the Tamil language; provides airline services under the Spice Jet brand; and operates Indian Premier League franchise under the Sun Risers Hyderabad name. Further, it offers direct to home satellite television services under the Sun Direct and Sun Direct HD brands. Products TELEVISION CHANNELS: In 4 different languages • Tamil • Telugu • Kannada • Malayalam PRINT MEDIA • News Papers • Magazines
- 4. RADIO STATIONS Services • Sun Direct It offers direct to home satellite television services under the Sun Direct and Sun Direct HD brands. Sun Direct uses the latest MPEG-4 based technology to increase broadcast capacity. Sun Direct confirms to provide next-generation services in fast-growing and emerging markets quickly and efficiently. • 45 FM Radio Stations across India Sun Group's forayed into FM radio. The top slot is a result of a carefully planned thoroughly enjoyable, round- the-clock, wholesome entertainment-oriented package and there is a substantial localization of content to retain the regional flavor. • Sun Risers Hyderabad During the year, the Company successfully bid for the Indian Premier League (IPL) Franchise offered by the Board of Control for Cricket in India (BCCI).
- 5. FINANCIAL HIGHLIGHT (PARENT BASIS) (A*- Actual, E* -Estimations & Rs. In Millions) Balance Sheet as at March 31, 2013 -2016E FY13A FY14A FY15E FY16E SOURCES OF FUNDS Shareholder's Funds Share Capital 1970.40 1970.40 1970.40 1970.40 Reserves and Surplus 26958.10 29747.60 34507.22 38164.98 1. Sub Total - Net worth 28928.50 31718.00 36477.62 40135.38 Non Current Liabilities Deferred Tax Liabilities 284.40 259.70 246.72 236.85 Other Long term Liabilities 41.70 35.20 39.42 42.58 Long term Provisions 17.20 8.80 43.45 52.14 2. Sub Total - Non Current Liabilities 343.30 303.70 329.59 331.56 Current Liabilities Trade Payables 291.90 317.80 457.63 549.16 Other Current Liabilities 1441.30 1353.20 2097.46 2475.00 Short Term Provisions 936.30 1093.20 437.28 393.55 3. Sub Total - Current Liabilities 2669.50 2764.20 2992.37 3417.71 Total Liabilities (1+2+3) 31941.30 34785.90 39799.58 43884.65 APPLICATION OF FUNDS Non-Current Assets Fixed Assets Tangible assets 8232.30 7706.10 8091.41 8495.98 Intangible assets 3992.50 4712.30 4853.67 5047.82 Capital Work in Progress 4.20 4.00 4.40 4.84 a) Sub Total -Fixed Assets 12229.00 12422.40 12949.47 13548.63 b) Non-current investments 4623.80 4623.80 4854.99 5146.29 c) Long Term loans and advances 3843.70 2417.20 2538.06 2639.58 1. Sub Total - Non Current Assets 20696.50 19463.40 20342.52 21334.50 Current Assets Current Investment 54.60 2142.70 2785.51 3286.90 Inventories 5.00 5.70 5.42 5.96 Trade receivables 5353.00 5744.60 6374.07 6947.74 Cash and Bank Balances 3886.30 5621.00 8150.45 9862.04 Short-terms loans & advances 1177.50 1017.80 916.03 1016.78 Other current assets 768.40 790.70 1225.59 1430.73 2. Sub Total - Current Assets 11244.80 15322.50 19457.06 22550.15 Total Assets (1+2) 31941.30 34785.90 39799.58 43884.65
- 6. Annual Profit & Loss Statement for the period of 2013 to 2016E Value(Rs.in.mn) FY13A FY14A FY15E FY16E Description 15m 12m 12m 12m Net Sales 18176.20 20967.80 22640.53 24678.18 Other Income 550.20 792.10 859.51 911.08 Total Income 18726.40 21759.90 23500.04 25589.26 Expenditure -4407.30 -6334.00 -6314.68 -6774.16 Operating Profit 14319.10 15425.90 17185.36 18815.09 Interest -47.90 -45.40 -34.59 -31.13 Gross profit 14271.20 15380.50 17150.76 18783.96 Depreciation -4131.80 -4533.40 -5810.91 -6682.54 Profit Before Tax 10139.40 10847.10 11339.86 12101.42 Tax -3306.00 -3677.50 -3810.85 -4005.57 Net Profit 6833.40 7169.60 7529.01 8095.85 Equity capital 1970.40 1970.40 1970.40 1970.40 Reserves 26958.10 29747.60 34507.22 38164.98 Face value 5.00 5.00 5.00 5.00 EPS 17.34 18.19 19.11 20.54 Quarterly Profit & Loss Statement for the period of 30th June, 2014 to 31st Mar, 2015E Value(Rs.in.mn) 30-Jun-14 30-Sep-14 31-Dec-14 31-Mar-15E Description 3m 3m 3m 3m Net sales 6335.80 5090.20 5524.40 5690.13 Other income 197.00 222.00 225.90 214.61 Total Income 6532.80 5312.20 5750.30 5904.74 Expenditure -2658.60 -1132.10 -1243.70 -1280.28 Operating profit 3874.20 4180.10 4506.60 4624.46 Interest -8.10 -4.60 -12.30 -9.59 Gross profit 3866.10 4175.50 4494.30 4614.86 Depreciation -1389.90 -1850.10 -1254.10 -1316.81 Profit Before Tax 2476.20 2325.40 3240.20 3298.06 Tax -819.80 -780.70 -1098.90 -1111.45 Net Profit 1656.40 1544.70 2141.30 2186.61 Equity capital 1970.40 1970.40 1970.40 1970.40 Face value 5.00 5.00 5.00 5.00 EPS 4.20 3.92 5.43 5.55
- 7. Ratio Analysis Particulars FY13A FY14A FY15E FY16E EPS (Rs.) 17.34 18.19 19.11 20.54 EBITDA Margin (%) 78.78% 73.57% 75.91% 76.24% PBT Margin (%) 55.78% 51.73% 50.09% 49.04% PAT Margin (%) 37.60% 34.19% 33.25% 32.81% P/E Ratio (x) 22.56 21.51 20.48 19.04 ROE (%) 23.62% 22.60% 20.64% 20.17% ROCE (%) 63.78% 62.93% 63.04% 63.53% EV/EBITDA (x) 10.49 9.49 8.34 7.50 Book Value (Rs.) 73.41 80.49 92.56 101.85 P/BV 5.33 4.86 4.23 3.84 Charts
- 8. OUTLOOK AND CONCLUSION At the current market price of Rs. 391.25, the stock P/E ratio is at 20.48 x FY15E and 19.04 x FY16E respectively. Earnings per share (EPS) of the company for the earnings for FY15E and FY16E are seen at Rs. 19.11 and Rs. 20.54 respectively. Net Sales and PAT of the company are expected to grow at a CAGR of 11% and 6% over 2013 to 2016E respectively. On the basis of EV/EBITDA, the stock trades at 8.34 x for FY15E and 7.50 x for FY16E. Price to Book Value of the stock is expected to be at 4.23 x and 3.84 x respectively for FY15E and FY16E. We recommend ‘BUY’ in this particular scrip with a target price of Rs. 430.00 for Medium to Long term investment. INDUSTRY OVERVIEW With 161 million television households in 2013, India stood as the third largest television market after the US and China. It also has one of the largest broadcasting industries in the world with approximately 800 satellite television channels, 245 FM channels and more than 100 operational community radio networks. The total subscriber base for the Indian television industry is expected to increase to 173 million by 2016 from 95 million in 2009. The market size of the Indian entertainment industry is anticipated to grow at a compound annual growth rate (CAGR) of 14.2 per cent in the period 2013-18 and reach US$ 29 billion by 2018. The entertainment industry is dominated by the television segment with 45 per cent of the market share, which is expected to reach 50 per cent by 2018. Television, print and films together accounted for 86 per cent of the market share in 2013. The Government of India has supported this sector's growth by taking various initiatives such as digitising the cable distribution sector to attract greater institutional funding, increasing foreign direct investment (FDI) limit from 74 per cent to 100 per cent in cable and DTH satellite platforms, and granting industry status to the film industry for easy access to institutional finance. The Indian media industry has tremendous scope in the gaming segment with the PC gaming segment, which was estimated at US$ 44.5 million in 2013, expected to touch US$ 112 million by 2018. Also, there is great potential for growth in the digital cable segment with the total subscription for DTH expected to increase to 75 million subscribers by 2018 from 37 million in 2013.
- 9. Disclaimer: This document is prepared by our research analysts and it does not constitute an offer or solicitation for the purchase or sale of any financial instrument or as an official confirmation of any transaction. The information contained herein is from publicly available data or other sources believed to be reliable but we do not represent that it is accurate or complete and it should not be relied on as such. Firstcall Research or any of its affiliates shall not be in any way responsible for any loss or damage that may arise to any person from any inadvertent error in the information contained in this report. Firstcall Research and/ or its affiliates and/or employees will not be liable for the recipients’ investment decision based on this document.
- 10. Firstcall India Equity Research: Email – info@firstobjectindia.com C.V.S.L.Kameswari Pharma & Diversified U. Janaki Rao Capital Goods B. Anil Kumar Auto, IT & FMCG M. Vinayak Rao Diversified G. Amarender Diversified Firstcall Research Provides Industry Research on all the Sectors and Equity Research on Major Companies forming part of Listed and Unlisted Segments For Further Details Contact: Tel.: 022-2527 2510/2527 6077 / 25276089 Telefax: 022-25276089 040-20000235 /20000233 E-mail: info@firstobjectindia.com www.firstcallresearch.com