Pressure Gradient Estimation Using Seismic Data In San Sai Oilfield, Fang Basin

The objective of this study is to predict formation pore pressure in San Sai oilfield of Fang basin, located in Chiang Mai Province, Northern Thailand, by using seismic data. The main activities in this study were: (1) required data collecting, including seismic travel time data, overburden pressure, and hydrostatic pressure data of San Sai oilfield, (2) normal compaction trend generating from p-wave transit time, and (3) formation pore pressure calculation by using the Eaton’s method of pressure prediction. Results from calculated pore pressures indicated that pore pressure gradient in the study area was in range between 0.436 and 0.452 psi/ft and the erroneous percentage of this method was in range between 1.42% and 4.09%. Thus the predicted formation pore pressure data that obtained from this study were acceptable and could be informatively supported the drilling plan of Fang basin in the future.

Recommended
Recommended
More Related Content
Similar to Pressure Gradient Estimation Using Seismic Data In San Sai Oilfield, Fang Basin
Similar to Pressure Gradient Estimation Using Seismic Data In San Sai Oilfield, Fang Basin (20)
More from International journal of scientific and technical research in engineering (IJSTRE)
More from International journal of scientific and technical research in engineering (IJSTRE) (20)
Recently uploaded
Recently uploaded (20)
Pressure Gradient Estimation Using Seismic Data In San Sai Oilfield, Fang Basin
- 1. International journal of scientific and technical research in engineering (IJSTRE) www.ijstre.com Volume 2 Issue 5 ǁ May 2017. Manuscript id. 656773271 www.ijstre.com Page 1 Pressure Gradient Estimation Using Seismic Data In San Sai Oilfield, Fang Basin Adisorn Sridej and Akkhapun Wannakomol School of Geotechnology, Institute of Engineering, Suranaree University of Technology, 111 University Avenue, Muang District, Nakhon Ratchasima 30000, Thailand. Email: Indycorporation007@Gmail.com Running head: Pressure gradient estimation using seismic data in San Sai oilfield, Fang basin Abstract: The objective of this study is to predict formation pore pressure in San Sai oilfield of Fang basin, located in Chiang Mai Province, Northern Thailand, by using seismic data. The main activities in this study were: (1) required data collecting, including seismic travel time data, overburden pressure, and hydrostatic pressure data of San Sai oilfield, (2) normal compaction trend generating from p-wave transit time, and (3) formation pore pressure calculation by using the Eaton’s method of pressure prediction. Results from calculated pore pressures indicated that pore pressure gradient in the study area was in range between 0.436 and 0.452 psi/ft and the erroneous percentage of this method was in range between 1.42% and 4.09%. Thus the predicted formation pore pressure data that obtained from this study were acceptable and could be informatively supported the drilling plan of Fang basin in the future. Keywords: Pore pressure gradient estimation, Seismic data, San Sai oilfield, Fang basin, Northern Thailand I. Introduction Pore pressure is defined as the fluid pressure in the pore space of the rock matrix. In a geologic setting with perfect communication between the pores, the pore pressure is the hydrostatic pressure due to the weight of the fluid (Fertl, 1976). Hydrostatic pressure is often referred to normal pressure conditions. Conditions that deviate from normal pressure are said to be either overpressured or underpressured, depending on whether the pore pressure is greater than or less than the normal pressure. The increasing weight of the overburden will tend to decrease the porosity, and hence the pore space (Bourgoyne Jr et al., 1986). However, if the formation is sealed, the fluid has nowhere to escape and starts to carry some of the weight of the overburden. The result is that the fluid pressure is increased. This process is often termed “undercompaction” or “compaction disequilibrium”, and is one of the major causes of abnormally high pore pressures (Dutta et al., 2002). The porosity is one of the key factors determining the velocity of a rock. Both theoretical considerations and experiments show that seismic velocities in general decrease with increasing porosity. Thus, undercompacted sediments tend to have lower velocities than compacted sediments (Pennebaker, 1968). Knowledge of the pore pressure in an area is important in drilling operation. In order to maintain a safe and controllable drilling, pore pressure must be defined or predicted accurately. Therefore, this study aimed to predict formation pore pressure of San Sai oil field, Fang Basin, Northern Thailand, by using its available seismic data which could be useful for its future drilling plan. II. Materials and Methods Materials Required data for the estimation of pore pressure consist of two major parts as for pore pressure calculation and for its accuracy checking. In the part of pore pressure calculation, seismic data from eight 2D seismic lines including Line S-2, Line S-3, Line F-89-031, Line F-1, Line F-2, Line F-3, Line F-89-038 and Line F-89-040, were collected and analyzed to obtain seismic travel time velocity for the pore pressure gradient calculation by using Microsoft Excel 2010. In the accuracy testing part, reference pressures which were recorded from Repeat Formation Testing (RFT) data of well FA-SS-37-08 and by calculation from pressure gradient of well FA-SS-37-07 were used as reference pressures to compare with calculated pore pressures of the previous part. All of required data for this study had been provided by Northern Petroleum Development Center, Defence Energy Department, Defence Industry & Energy Center, Ministry of Defence. Methods Estimation of pore pressure within study area had been conducted by using interpreted seismic velocities. Steps for pore pressure calculation in this research consisted normal compaction trend generating and pore pressure calculation respectively.
- 2. Pressure Gradient Estimation Using Seismic Data In San Sai Oilfield, Fang Basin Manuscript id. 656773271 www.ijstre.com Page 2 Normal Compaction Trend Generating Normal compaction trend can be generated by making a transit time – depth plot on semi-log paper. Then the normal compaction trend can be determined by drawing a straight line through the average of transit time values and their corresponding depths (Hottman and Johnson, 1965). Pore Pressure Calculation The pore pressure had been calculated from travel time and pore pressure relationship proposed by Ben Eaton (1972) as presented in Equation 1 O n ZZZpore t t PnOBOBP (1) where Ppore = Predicted pore pressure (psi) OB = Overburden pressure (psi) Pn = Normal pressure (psi) Z = Depth to point of measurement (ft) Δtn = The assumed normal sonic slowness at depth Z calculated from the Normal compaction trend line (µsec/ft) Δto = The observed (measured) sonic slowness at depth Z (µsec/ft) α = Pore Pressure transformation exponent variable with age/basin location (no unit) According to the theory, overburden pressure gradient and normal pressure gradient (hydrostatic pressure gradient) that used in this research were set conventionally as 1 psi/ft and 0.433 psi/ft respectively and the used pore pressure transformation exponent variable (α) as 0.3 (obtained from curve fitting between RFT and sonic log data of well FA-SS-37-08). Therefore, Equation 1 had been transformed to: 3.0 433.0)1(1 O n zzzzpore t t DDDP (2) where D = depth at interesting depth z (ft) α = 0.3 In this study, Equation 2 had been used to calculate the pore pressure throughout the study. Accuracy Testing In this part, calculated pore pressures derived from this study were tested for checking its accuracy by compared with the reference pressures which were recorded from RFT data of well FA-SS-37-08 and by calculation from pressure gradient of well FA-SS-37-07. The reference pressure was re-scaling by extrapolated it in to calculate pressure scale then the erroneous percentage had been calculated by Equation 3: 100 r rc P PP (3) where Pc is calculated pore pressure (psi) and Pr is reference pressure (psi). III. Results and Discussions In order to study the relationship among pore pressure, depth, and seismic wave travel time, these data were each other cross-plotted and some results could be summarized as follows: Normal Compaction Trend Lines Corresponding linear equations obtained from Normal compaction trend lines which had been used for normal sonic slowness (Δtn, µsec/ft) calculation are shown in Table 1. Pore Pressure Calculation Resulted pore pressures calculated from Line S-2 SPN 1560, Line S-3 SPN 1476, Line F-89-031 SPN 1257, Line F-1 SPN 1231, Line F-2 SPN 1227, Line F-3 SPN 1266, Line F-89-038 SPN 1127, and Line F-89- 040 SPN 1131 compared with pressure data from Repeat Formation Test (RFT) of well FA-SS-37-08 and from the pressure gradient of well FA-SS-37-07 (depth in between 2,238 and 4,625 ft) are shown in Figure 1 to Figure 8, and pore pressure gradient obtained from these seismic lines are also shown in Table 2, respectively.
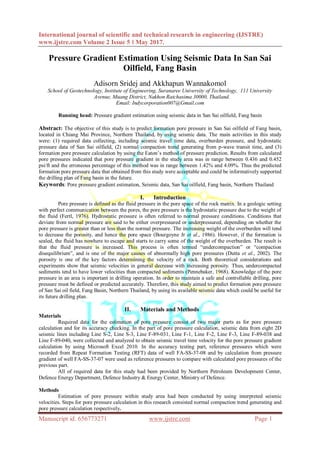
- 3. Pressure Gradient Estimation Using Seismic Data In San Sai Oilfield, Fang Basin Manuscript id. 656773271 www.ijstre.com Page 3 Figure 1. Pore pressure calculated from seismic line S-2 shot point number 1560 data
- 4. Pressure Gradient Estimation Using Seismic Data In San Sai Oilfield, Fang Basin Manuscript id. 656773271 www.ijstre.com Page 4 Figure 2. Pore pressure calculated from seismic line S-3 shot point number 1476 data
- 5. Pressure Gradient Estimation Using Seismic Data In San Sai Oilfield, Fang Basin Manuscript id. 656773271 www.ijstre.com Page 5 Figure 3. Pore pressure calculated from seismic line F-89-031 shot point number 1257 data
- 6. Pressure Gradient Estimation Using Seismic Data In San Sai Oilfield, Fang Basin Manuscript id. 656773271 www.ijstre.com Page 6 Figure 4. Pore pressure calculated from seismic line F-1 shot point number 1231 data
- 7. Pressure Gradient Estimation Using Seismic Data In San Sai Oilfield, Fang Basin Manuscript id. 656773271 www.ijstre.com Page 7 Figure 5. Pore pressure calculated from seismic line F-2 shot point number 1227 data
- 8. Pressure Gradient Estimation Using Seismic Data In San Sai Oilfield, Fang Basin Manuscript id. 656773271 www.ijstre.com Page 8 Figure 6. Pore pressure calculated from seismic line F-3 shot point number 1266 data
- 9. Pressure Gradient Estimation Using Seismic Data In San Sai Oilfield, Fang Basin Manuscript id. 656773271 www.ijstre.com Page 9 Figure 7. Pore pressure calculated from seismic line F-89-038 shot point number 1127 data
- 10. Pressure Gradient Estimation Using Seismic Data In San Sai Oilfield, Fang Basin Manuscript id. 656773271 www.ijstre.com Page 10 Figure 8. Pore pressure calculated from seismic line F-89-040 shot point number 1131 data Table 1.Corresponding linear equation obtained from each shot point which is used for normal sonic slowness (Δtn, µsec/ft) calculation Seismic Line Shot point number Equation S-2 1560 y = -15831ln(x) + 78569 S-3 1476 y = -9385ln(x) + 47490 F-89-031 1257 y = -9497ln(x) + 48286 F-1 1231 y = -9091ln(x) + 46502 F-2 1227 y = -12927ln(x) + 65184 F-3 1266 y = -10880ln(x) + 55103 F-89-038 1127 y = -7176ln(x) + 36769 F-89-040 1131 y = -8361ln(x) + 42873
- 11. Pressure Gradient Estimation Using Seismic Data In San Sai Oilfield, Fang Basin Manuscript id. 656773271 www.ijstre.com Page 11 Table 2.Pressure gradient obtained from each shot point calculated from its corresponding normal sonic slowness (Δtn, µsec/ft) Seismic Line Shot point number Pressure Gradient (psi/ft) S-2 1560 0.442 S-3 1476 0.452 F-89-031 1257 0.439 F-1 1231 0.438 F-2 1227 0.443 F-3 1266 0.441 F-89-038 1127 0.439 F-89-040 1131 0.436 Accuracy Testing The erroneous percentages of calculated pore pressures from each seismic line compared with reference pressure are shown in Table 3. Table 3.Average erroneous percentage of calculated pore pressure compared with its reference pressure IV. Conclusions and Recommendations Results from the estimation of pore pressure by using seismic data in San Sai oilfield, Fang basin from this study can be summarized as follows; 1) Formation pore pressure gradient of study area was in range between 0.436 and 0.452 psi/ft. This is nearly close to the theoretical normal pressure of 0.433 psi/ft. 2) The erroneous percentage of pore pressure calculated from this method in study area compared with pressure obtained from well FA-SS-37-08 was in range between 1.42% and 3.39% and compared with well FA-SS 37-07 was in range between 4.06% and 4.09%. In general, these values were acceptable. This may prove and assure that the estimation of pore pressure by using seismic data could be used confidently in San Sai oilfield. Dependability of this study is in range within depth between 1000 and 5000 ft. due to lacking of recorded pore pressure for the accuracy checking. Moreover, this relationship can also be applied to other oilfields which are located within Fang basin due to the similarity of their data source and geological characters. V. Acknowledgement The research work presented in this paper was supported by the Suranaree University of Technology. The permission of the Northern Petroleum Development Center, Defence Energy Department, Defence Industry & Energy Center, Ministry of Defence, to use required data for pore pressure estimation is also greatly appreciated. The authors would like to thank Assoc. Prof. Kriangkrai Trisarn and Dr. Chongpan Chonglakmani for their valuable suggestion and guidance. References [1.] Bourgoyne Jr, A.T., Millheim, K.K., Chenevert, M.E., and Young Jr, F.S. (1986). Formation pore pressure and fracture resistance. Applied Drilling Engineering, 2:246-299. [2.] Dutta, N.C., Mukerji, T., Prasad, M., and Dvorkin, J. (2002). Seismic detection and estimation of overpressures. CSEG Recorder, 27(7):34-73. Seismic Lines Shot point number Average erroneous percentage (%) FA-SS-37-08 FA-SS-37-07 S-2 1560 1.42 4.08 S-3 1476 3.23 4.06 F-89-031 1257 3.19 4.08 F-1 1231 3.39 4.08 F-2 1227 2.88 4.07 F-3 1266 2.95 4.08 F-89-038 1127 3.08 4.09 F-89-040 1131 3.15 4.08
- 12. Pressure Gradient Estimation Using Seismic Data In San Sai Oilfield, Fang Basin Manuscript id. 656773271 www.ijstre.com Page 12 [3.] Eaton, B.A. (1972). The effect of overburden stress on geopressure prediction from well Logs. Journal of Petroleum Technology, 24(8):929-934. [4.] Fertl, W.H. (1976). Abnormal Formation Pressures. 2nd ed. Elsevier, Amsterdam, 382p. [5.] Hottman, C.E. and Johnson, R.K. (1965). Estimation of formation pressures from log-derived shale properties. GCAGS Transactions, 15:179-186. [6.] Pennebaker, E.S. (1968). An engineering interpretation of seismic data. Proceeding of the 43rd Annual Fall Meeting of Society of Petroleum Engineers; September 29-October 2, 1968; Houston, Texas, USA, SPE Paper no. 2165, 12p.