Goat Value Chain Analysis in Pastoral communities of Ethiopia
•
0 likes•164 views

Goat Value Chain Analysis in Pastoral communities of Ethiopia
Recommended

Recommended
More Related Content
More from Independent Science and Partnership Council of the CGIAR
More from Independent Science and Partnership Council of the CGIAR (20)
Recently uploaded
Recently uploaded (20)
Goat Value Chain Analysis in Pastoral communities of Ethiopia
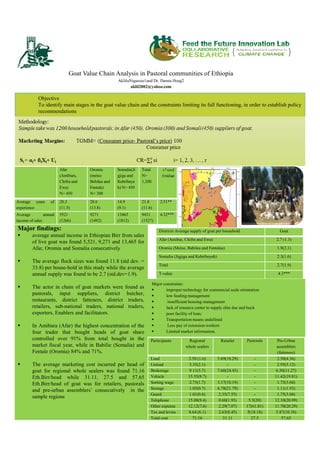
- 1. Goat Value Chain Analysis in Pastoral communities of Ethiopia AkliluNigussie1and Dr. Danna Hoag2 aklil2002@yahoo.com Objective To identify main stages in the goat value chain and the constraints limiting its full functioning, in order to establish policy recommendations Major findings: average annual income in Ethiopian Birr from sales of live goat was found 5,521, 9,271 and 13,465 for Afar, Oromia and Somalia consecutively The average flock sizes was found 11.8 (std dev. = 33.8) per house-hold in this study while the average annual supply was found to be 2.7 (std.dev=1.9). The actor in chain of goat markets were found as pastorals, input suppliers, district butcher, restaurants, district fatteners, district traders, retailers, sub-national traders, national traders, exporters, Enablers and facilitators. In Amibara (Afar) the highest concentration of the four trader that bought heads of goat share controlled over 91% from total bought in the market fiscal year, while in Babilie (Somalia) and Fentale (Oromia) 84% and 71%. The average marketing cost incurred per head of goat for regional whole sealers was found 71.16 Eth.Birr/head while 31.11, 27.5 and 57.65 Eth.Birr/head of goat was for retailers, pastorals and pre-urban assemblers’ consecutively in the sample regions Afar (Amibara, Chifra and Ewa) N= 450 Oromia (meiso Bebilea and Fentale) N= 300 Somalia(Ji gjiga and Kebribeya h) N= 450 Total N= 1,200 Average years of experience 20.3 (11.5) 28.6 (13.8) 14.9 (9.1) 21.8 (11.6) 2.51** Average annual income of sales 5521 (1266) 9271 (1492) 13465 (1812) 9431 (1527) 4.32*** Participants Regional whole sealers Retailer Pastorals Pre-Urban assemblers (fatteners) Load 2.50 (1.6) 5.69(18.29) - 2.50(4.34) Unload 3.35(2.1) - - 2.95(5.12) Brokerage 9.11(5.7) 7.60(24.43) - 6.50(11.27) Vehicle 15.55(9.7) - - 11.42(19.81) Sorting wage 2.75(1.7) 3.17(10.19) - 1.75(3.04) Storage 1.05(0.7) 6.78(21.79) - 1.11(1.93) Guard 1.01(0.6) 2.35(7.55) - 1.75(3.04) Telephone 15.08(9.4) 0.60(1.93) 5.5(20) 12.10(20.99) Other expense 12.12(7.6) 2.29(7.07) 17(61.81) 11.70(20.29) Tax and levies 8.64 (6.1) 2.63(8.45) 5(18.18) 5.87(10.18) Total cost 71.16 31.11 27.5 57.65 Districts Average supply of goat per household Goat Afar (Amibar, Chifra and Ewa) 2.7 (1.3) Oromia (Meiso, Babilea and Fentalea) 1.9(2.1) Somalia (Jigjiga and Kebribeyah) 2.3(1.6) Total 2.7(1.9) T-value 4.3*** Major constraints: improper technology for commercial scale orientation low feeding management insufficient housing management lack of resource center to supply elite doe and buck poor facility of loan; Transportation means undefined Less pay of extension workers Limited market information.