
Recommended
Recommended
More Related Content
What's hot
What's hot (18)
Similar to Air Pollution Dispersion Study of Coastal Thermal Plant
Similar to Air Pollution Dispersion Study of Coastal Thermal Plant (20)
More from IRJESJOURNAL
More from IRJESJOURNAL (20)
Recently uploaded
Recently uploaded (20)
Air Pollution Dispersion Study of Coastal Thermal Plant
- 1. International Refereed Journal of Engineering and Science (IRJES) ISSN (Online) 2319-183X, (Print) 2319-1821 Volume 6, Issue 4 (April 2017), PP.46-55 www.irjes.com 46 | Page Air Pollution Dispersion Study in the Neighbourhood of Coastal Super Power Thermal Plant at Karikkuppam, Tamil Nadu A Case Study Chandrasekar.E1 , Rajendran.M2 , Bharath.P3 1, 2, 3 Department Of Civil Engineering, Annamalai University, Tamilnadu, India Abstract:- Dispersion of air pollutants in the coastal site due to thermal power plant and other various type of industries located in inland terrain is one of the major environmental pollution issue. Sulphur dioxide is the dominant air pollutant from thermal plants which are easily converted into sulphur trioxide, sulphuric acid and sulphur particles. This leads to the various environmental and health impacts to the humans. Dispersion model are the tool to predict the environmental conditions and the concentration in the downwind environment. Thus in this study, the Dispersion model was developed for the dispersion of sulphur dioxide concentration in the environment using Gaussian Plume Model. Keywords:- Air Pollutant; Dispersion; Sulphur Dioxide; Dispersion Models; Gaussian Plume Model I. INTRODUCTION In developing countries, the concentration of large number of industries in a smaller industrial estate area could pose serious threat to surrounding environment (ShaleenSingha and Amitpur,2002).One of such industrial estate, namely SIPCOT (State Industrial Promotion Corporation of Tamilnadu state, India) industrial park has established in 1984 near Cuddalore port town at present extent of 2605 acres. Within this smaller area thirty number of large to tiny industries of fluorides, agrochemical, pharmaceutical, paints, textiles and toxic poly vinyl chloride are under operational stage. Emission inventory and site specific air pollutant in association with regular National Ambient Air Quality (NAAQ) standard parameters prescribed by Central Pollution Control Board (CPCB, 2009) of India were monitored and well documented recently by (Ashok Kumar and Rajendran,2014). Further in the south of this SIPCOT, the large scale industries such as an oil refineries is under construction, one textile park, two coal burnt thermal power plant of each capacity of 1220 Mwh and 1990 Mwh are under proposal. One more coal fired Super thermal power plant (3600 Mwh) namely Infrastructure Leasing and Financial Services (IL&FS) limited company established around 14 km south at nearby coastal town of Portonovo partly being recently came to commercial operation. To meet out the India’s power demand forecasted by World Energy Council (WEC 2013) is 1500 Giga watts. Air pollution Dispersion Study in the Neighbourhood of Coastal super Power Thermal Plant at Karikkuppam,Tamilnadu-A Case Study. India’s energy scenario accounts 60 percent of total energy supply generated from coal fired thermal power plants are inevitable up to 2050 (WEC 2013) when compared to other sources.Further 7000 km shoreline in peninsular portion of India is facilitate to promote such power plants to avail the own coal reserve and also from abroad through its captive port and to use abandoned quantity of seawater for plant cooling purpose. An integrated sustainable approach in the heavy industrial cluster in a smaller areal extent has to be investigated and proper environment management planning guide lines has to be implemented. Sulphur Dioxide (SO2) is a dominant primary air pollutant has been emitted from coal burnt thermal power plant and resides in the lower atmosphere one to three days (Hidy G.M, 1994). Acute to chronic exposure of SO2 causes immediate bronchial constriction, increased pulmonary resistance and swelling of mucosal tissues (Coppock R.W and M.S.Mostrum, 1997). Chemical transformation of SO2 in to SO3, sulfuric acid and sulphate particles impacts on vegetation and properties. This paper aimed to assess the centerline downwind Ground Level Concentration (GLC) pattern of SO2 around 25 Km of IL&FS super thermal power plant and possible risk in the downwind environment are identified. Building up of downwind GLC of SO2 is modeled with the code of popular Standard Gaussian Plume (Sutton O.G, 1953) and plume reflection equations (Bierly and Hewson, 1963) under selected worst meteorological conditions.
- 2. Air Pollution Dispersion Study In The Neighbourhood Of Coastal Super Power….. www.irjes.com 47 | Page II. STUDY AREA AND PERIOD IL&FS super thermal power plant is located in the Eastern coastal village of Karikkuppam near Portonovo town of Cuddalore district, Tamilnadu state in the southern peninsular region of India. Power plant industrial infrastructure is geographically accommodated in between 110 51’to 110 53’ N latitude and 790 74’to790 71’E longitude. The elevation of power plant site is about 1.5 m to 2.0 m above Mean Sea Level (MSL) and the stacks were erected nearly 2km from the shoreline. Figure.1 depicted the exact location of the study area. Period of the study is carried out in the nocturnal hours of spring season during December 2014, January and February 2015. Air pollution Dispersion Study in the Neighbourhood of Coastal super Power Thermal Plant at Karikkuppam,Tamilnadu-Case Study. Fig.1 Location of the Study Area III. DATA Air quality modeling study requires micrometeorological and an emission data to predict the GLC for the study area. Micro meteorological data was mainly depends upon the climatic conditions whereas an emission data based on the Sulphur content of the coal has to be burnt. Micrometeorological observations and daily upper air radio sonde (RS) data measurements should be site specific for effective air quality modeling study. Ultimate coal analysis results also necessary where the modeling has to be performed. In absence of other data used in the model has been estimated with the proper algorithm. Air pollution Dispersion Study in the Neighbourhood of Coastal super Power Thermal Plant at Karikkuppam,Tamilnadu-A Case Study. IV. MICROMETEOROLOGICAL DATA The routine surface meteorological data wind speed, wind direction, temperature and humidity being measured with 5 minutes time resolution with an automated weather station by Tamilnadu Pollution Control Board (TNPCB) at State Industrial Promotion Corporation of Tamilnadu (SIPCOT) premises, Cuddaloreis located 4 km in the direction of NNW and site specific to study area are acquired for the study period. Upper air RS data of Chennai Meenampakkam airport at 00 GMT have been observed by Indian Meteorological Department were used to determine the nocturnal hourly mixing height by (Holzworth ,1972) methodology. An essential parameter hourly solar radiation is estimated by using (Kurt and Spokas, 2006) method. V. EMISSION DATA Mandatory input parameters to be given in the dispersion model are stack height, flues gas exit velocity, temperature, diameter are furnished in Rapid Cumulative Environmental Impact Assessment Report (RCEIA) 2012 by IL&FS company were presented in Table.1. As the RCEIA is concerned hourly imported Indonesian coal consumption under full capacity (3600MW) production is estimated as 2.226 MT/hour.
- 3. Air Pollution Dispersion Study In The Neighbourhood Of Coastal Super Power….. www.irjes.com 48 | Page Ultimate coal analysis sulphur content is well indicated with 0.13%. It is taken in to account to calculate SO2 emission rate through the five flues of the two stacks by mass balance approach and worked out 1236.682 g/sec. Table. 1 Physical Characteristics of Elevated Stack. Stack no. Flues Height (m) Exit Velocity (m/sec) Exit Temperature (k) Flue Diameter (m) Production (MW) I Twin-flues 275 20 398 7.5 2x600 II Three-flues 275 20 398 7.5 3x800 VI. AIR QUALITY MODEL The most popular steady state standard Gaussian Plume Model (Sutton O.G,1953) used for regulatory application in many countries in addition to that (Bierly and Hewson,1963) plume reflection model are also used in the research paper are properly detailed by (Turner,1994). Air pollution Dispersion Study in the Neighbourhood of Coastal super Power Thermal Plant at Karikkuppam,Tamilnadu- A Case Study. Assumptions of these models found in the literature are adopted. Standard GPM equation is given in Eq.[1] 2 z 2 2 z 2 2 y 2 zy 2 )zH( exp 2 )zH( exp 2 y exp u2 Q )H;z,y,x( (1) Bierly and Hewson plume reflection model equation is presented in Eq.[2] 2 2 2 2 4 1 2 2 2 2 2 2 2 2 2 2 2 2 exp 2 2 exp 2 2 exp 2 2 exp 2 exp 2 exp 5.0 exp 2 ;,, z i z i N N z i z i zzyzy NzHzNzHz NzHzNzHz zHzH x y x u Q Hzyx (2) Where, χ Air pollutant concentration in mass per volume, usually in gm-3 . x Downwind distance in m. y Crosswind distance in m. z Vertical Wind distance in m. Q Pollutant emission rate in mass per time, usually in gs-1 . u Wind speed at the point of release in ms-1 . σy and σz are horizontal and vertical dispersion parameters in m. π The mathematical constant pi equal to 3.1415926. H The effective height of the center line of the pollutant plume in m. Air pollution Dispersion Study in the Neighbourhood of Coastal super Power Thermal Plant at Karikkuppam,Tamilnadu- A Case Study. zi Mixing Height in m. N number of reflections (4Nos.) Horizontal σy and vertical dispersion σz parameters of (Pasquill.F, 1961) and (Gifford. G, 1960) of rural condition used by the many air quality modelers were adopted in the model equation. Wind speed at the point of release has obtained from wind profile power law using rural exponent values of (Irwin.J.H, 1979) at different atmospheric conditions beside the reference height of at 10m (u10) height routine observation. Addition of physical stack height and plume rise is termed effective height (H). Plume rise estimation at various stability classes has worked out by using Briggs (1971) methodology.
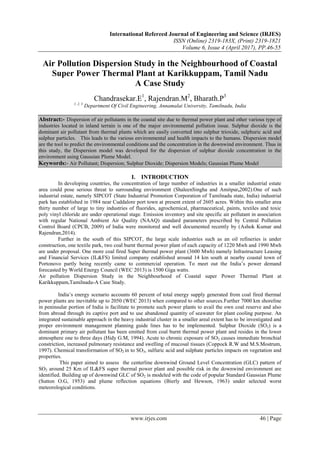
- 4. Air Pollution Dispersion Study In The Neighbourhood Of Coastal Super Power….. www.irjes.com 49 | Page VII. RESULTS AND DISCUSSION The prevailing hourly meteorological conditions during the study period in association with dispersion of SO2 in the study area considering wind speed and direction, Atmospheric stability, Mixing height and effective height and plume reflection are well investigated (Chandrasekaret al, 2016). Out of which only four hourly worst meteorological cases are selected during the study period because of high voluminous data and projection of all the results in this research paper is difficult. The dispersion model code is executed for the above said hourly worst meteorological conditions as mentioned in Table.2 Table. 2 Selected hourly Worst Meteorological Conditions Air pollution Dispersion Study in the Neighbourhood of Coastal super Power Thermal Plant at Karikkuppam,Tamilnadu- A Case Study. Fig.2 Downwind Centreline GLC Pattern on 09/12/2014 at 10.30 am Figure.2 depicts the worst meteorological condition for SO2 concentration on the study area and represented the downwind centerline of ground level concentration of sulphur dioxide (SO2). The worst SO2 concentration was recorded on 09 Dec 2014 at 10.30A.M in the study area. In this graphical representation the National Ambient Air Quality’s standard (NAAQ’s) 8 hours average of SO2 concentration is 80μg/m3 was plotted for the standard concentration. Bierly & Hewson reflected ground level concentration (GLC) was formed in hourly ground level concentration in μg/m3 Vs downwind distance in m. There was the Bierly & Hewson offered ground level concentration (GLC) is 160μg/m3 . Furthermore the standard Gaussian plume model (GPM) reflected ground level concentration was above 80μg/m3 . As per the plotted graph the Bierly & Hewson reflected ground level concentration (GLC) is maximum than the NAAQ’s standard and Gaussian plume model (GPM) reflected ground level concentration (GLC). This ground level concentration offered the stability class –A (Turner-1994). At the stack height wind speed, the sulphur dioxide (SO2) concentration is 1.26μg/m3 in associated with the 1788 m effective height and 1820 m mixing height. This is the maximum accumulation of SO2 concentration than the Gaussian plume model (GPM) reflected ground level concentration (GLC) in addition to that of NAAQ’s standard. 0 5000 10000 15000 20000 25000 0 20 40 60 80 100 120 140 160 180 NAAQS 8hrs Bierly & Hewson Reflected GLC Std. GPM Reflected GLC HourlyGroundLevelConcentration(g/m 3 ) Downwind Distance (m) Month & Year Date Time Pasquill Stability Class Wind Speed at Stack Height (us) (µg/m3 ) Effective Height (m) Mixing Height (m) December-2014 09 10.30 am A 1.26 1788 1820 January-2015 16 09.30 am B 1.68 1445 1450 February -2015 20 03.30 pm C 7.08 1648 1670 11 05.30 am D 1.91 1308 1390
- 5. Air Pollution Dispersion Study In The Neighbourhood Of Coastal Super Power….. www.irjes.com 50 | Page Air pollution Dispersion Study in the Neighbourhood of Coastal super Power Thermal Plant at Karikkuppam,Tamilnadu –A Case Study. Fig. 3 Downwind Centreline GLC Pattern on 16/01/2015 at 09.30 am Fig.3 illustrates the worst meteorological state for SO2 concentration on the study vicinity and represented the downwind centerline of ground level concentration of sulphur dioxide (SO2). The worst SO2 concentration was recorded on 16 Jan 2015 at 09.30A.M in the study region. In this graphical representation the National Ambient Air Quality’s standard (NAAQ’s) 8 hours average of SO2 concentration is 80μg/m3 was based as the standard concentration. Bierly & Hewson reflected ground level concentration (GLC) was created in hourly ground level concentration in μg/m3 Vs downwind distance in m. There was the Bierly & Hewson reflected ground level concentration (GLC) is 150μg/m3 . In addition to the standard Gaussian plume model (GPM) hourly reflected hourly ground level concentration was above 80μg/m3 . As per the plotted graph the Bierly & Hewson reflected ground level concentration (GLC) is maximum to the Gaussian plume model (GPM) reflected hourly ground level concentration (GLC), and below to the NAAQ’s standard. This ground level concentration allows the stability class –B (Turner-1994). At the stack height wind speed, the sulphur dioxide (SO2) concentration is 1.68μg/m3 in addition to 1445m effective height and 1450m mixing height. Air pollution Dispersion Study in the Neighbourhood of Coastal super Thermal Plant at Karikkuppam,Tamilnadu-A Case Study. Fig.4 Downwind Centreline GLC Pattern on 20/02/15 at 03.30 pm 0 3000 6000 9000 12000 15000 18000 21000 24000 27000 30000 0 2 4 6 8 10 12 14 HourlyGroundLevelConcentration(g/m 3 ) Bierly & Hewson Reflected GLC Std. GPM Reflected GLC Downwind Distance (m) 0 5000 10000 15000 20000 25000 0 20 40 60 80 100 120 140 160 180 NAAQS 8hrs HourlyGroundLevelConcentration(g/m 3 ) Bierly & Hewson Reflected GLC Std. GPM Reflected GLC Downwind Distance (m)
- 6. Air Pollution Dispersion Study In The Neighbourhood Of Coastal Super Power….. www.irjes.com 51 | Page Fig. 4 shows the worst meteorological condition for SO2 concentration on the study area and revealed the downwind centerline of ground level concentration of sulphur dioxide (SO2). The worst SO2 concentration was obtained on 15 Feb 2015 at 03.30 P.M in the study neighborhood. In this graphical representation the National Ambient Air Quality’s standard (NAAQ’s) 8 hours average of SO2 concentration is 80μg/m3 was based as the standard concentration. Bierly & Hewson reflected ground level concentration (GLC) was formed in μg/m3 Vs downwind distance in m. There was the Bierly & Hewson offered hourly ground level concentration (GLC) is above 11μg/m3 . And the standard Gaussian plume model (GPM) hourly reflected ground level concentration was above 6μg/m3 . As per the plotted graph the Bierly & Hewson reflected ground level concentration (GLC) is maximum to the Gaussian plume model (GPM) reflected hourly ground level concentration (GLC), and minimum to the NAAQ’s standard. This ground level concentration offered the stability class –C (Turner-1994). At the stack height wind speed, the sulphur dioxide (SO2) concentration is 7.08μg/m3 in associated with the 1648 m effective height and 1670 m mixing height. This is the maximum accumulation of SO2 concentration than the Gaussian plume model (GPM) reflected ground level concentration (GLC) in addition to minimum for NAAQ’s standard. Air pollution Dispersion Study in the Neighbourhood of Coastal super Thermal Plant at Karikkuppam,Tamilnadu-A Case Stdudy. Fig.5 Downwind Centreline GLC Pattern on 11/02/15 at 05.30 pm 0 5000 10000 15000 20000 25000 0 5 10 15 20 25 30 35 0 5000 10000 15000 20000 25000 0 5 10 15 20 25 30 35 Downwind Distance (m) Downwind Distance (m) Std. GPM Reflected GLC) Bierly & Hewson Reflected GLC HourlyGLC(g/m 3 ) HourlyGLC(g/m 3 ) 0 5000 10000 15000 20000 25000 0 20 40 60 80 100 120 140 160 180 NAAQS 8hrs HourlyGroundLevelConcentration(g/m 3 ) Bierly & Hewson Reflected GLC Std. GPM Reflected GLC Downwind Distance (m)
- 7. Air Pollution Dispersion Study In The Neighbourhood Of Coastal Super Power….. www.irjes.com 52 | Page Fig. 5depicts the most terrible meteorological condition for SO2 concentration on the study vicinity and represented the downwind centerline of ground level concentration of sulphur dioxide (SO2). The worst SO2 concentration was recorded on 11 Feb 2015 at 05.30A.M in the study region. In this graphical representation the National Ambient Air Quality’s standard (NAAQ’s) 8 hours average of SO2 concentration is 80μg/m3 was based as the standard concentration. Bierly & Hewson reflected ground level concentration (GLC) was formed in μg/m3 Vs downwind distance in m. Here the Bierly & Hewson offered hourly ground level concentration (GLC) was 30μg/m3 . Furthermore the standard Gaussian plume model (GPM) hourly reflected ground level concentration was 30μg/m3 . As per the plotted graph the Bierly & Hewson reflected ground level concentration (GLC) is equal to the Gaussian plume model (GPM) reflected hourly ground level concentration (GLC), and minimum to the NAAQ’s standard. This ground level concentration offered the stability class –D (Turner-1994). At the stack height wind speed, the sulphur dioxide (SO2) concentration is 1.91μg/m3 in associated with the 1308 m effective height and 1390 m mixing height. Air pollution Dispersion Study in the Neighbourhood of Coastal super Power Thermal Plant at Karikkuppam,Tamilnadu- A Case Study. Table. 3 Bierly and Hewson Reflected GLC and Standard GPM GLC Date Time Downwind Distances, x (km) 0≤5 6≤10 11≤15 16≤20 21≤25 Bierly and Hewson Reflected GLC 09/12/14 10.30 am 65 140 120 95 80 16/01/15 09.30 am 30 140 150 120 100 20/02/15 03.30 pm 0 0.71 2.15 6.10 9.95 11/02/15 05.30 pm 0.01 3.49 8.71 20 30 Standard GPM Reflected GLC 09/12/14 10.30 am 35 70 50 35 25 16/01/15 09.30 am 15 70 75 55 40 20/02/15 03.30 pm 0 0.4 1.21 3.29 5.28 11/02/15 05.30 pm 0.01 3.49 8.71 20 30 Table. 4 Wind Direction Over the sensitive area during the study period. Air pollution Dispersion Study in the Neighbourhood of Coastal super Power Thermal Plant at Karikuppam, Tamilnadu- A Case Study. Month Time (hr) Wind Direction NNE NNW E SSE December 2014 5.30 - 8.30 am 0 0 4.31 0 8.30 – 11.30 am 0 0 14.91 0 11.30 – 2.30 pm 0 0 42.86 0 2.30 – 5.30 pm 0 0 40.71 0.71 January 2015 5.30 - 8.30 am 0.83 0 0 0.83 8.30 – 11.30 am 0.85 0 12.71 0.85 11.30 – 2.30 pm 0 0 26.72 1.72 2.30 – 5.30 pm 0 0 22.76 4.14 February 2015 5.30 - 8.30 am 0 0 0 0 8.30 – 11.30 am 0 0 13.39 0.89 11.30 – 2.30 pm 0 0 0 0 2.30 – 5.30 pm 10.71 0 13.39 0.89
- 8. Air Pollution Dispersion Study In The Neighbourhood Of Coastal Super Power….. www.irjes.com 53 | Page Fig.6 Wind Rose-December 2014 Fig. 7 Wind Rose-January 2015
- 9. Air Pollution Dispersion Study In The Neighbourhood Of Coastal Super Power….. www.irjes.com 54 | Page Fig. 8 Wind Rose-February 2015 Air pollution Dispersion Study in the Neighbourhood of Coastal super Power Thermal Plant at Karikkuppam,Tamilnadu –A Case Study. VIII. AIR QUALITY MODEL ASSESSMENT Model code consisting of standard Gaussian Plume (Sutton, O.G. 1953) and Bierly and Hewson (1963) plume reflection equations have been executed for well defined four hourly worst meteorological conditions for each month of study period. The time stamp and concern input for running the model code is presented in Table.6.1. The predicted centerline downwind GLC pattern has been projected graphically for each hour from Figure. 6 to 8 in compliance with the status of NAAQ’s standard, India (CPCB 2009) of twenty hour SO2 concentration80 µg/m3 . Hourly Model assessment of centerline downwind GLC SO2 at different range up to 25 km are projected in Table.1. Higher hourly prediction 15 to 35µg/m3 and 30 to 85µg/m3 are obtained in the nearby source by standard GPM and Bierly and Hewson’s plume reflection model equation up to 5 km respectively. In 10-15 km zone 30 to 70µg/m3 and 40 to 160µg/m3 were assessed by both the model equation correspondingly. For 11 to 15 km distance is concerned 30 to 75µg/m3 and 70 to 150µg/m3 are estimated. At an interval of 16 to 20 km distance the theoretical estimated values are in the range of 35to 65µg/m3 and high in reflected concentration as 55 to 130µg/m3 . Better dilution are not calculated by both the equation even though at greater down distance in between 21 to 25 km distance, high hourly estimates are anticipated about 30 to 65µg/m3 by standard GPM and 45 to110 µg/m3 by reflection model respectively. If wind blows at one direction at least more than one hour, high significant downwind SO2 concentration will be possible more than that of NAAQ’s standard in the study area. Air pollution Dispersion Study in the Neighbourhood of Coastal super Power Thermal Plant at Karikkuppam, Tamilnadu-A Case Study. IX. CONCLUTION The weight of the wind from North-North-West (NNW) direction having the probability to develop high ground level concentration (GLC) of sulfur dioxide (SO2) in Pichavaram at 7 km. Here the mangroves which are extended from 7 km to 14 km in the NNW direction. The wind from South-South-East (SSE), there was the Small industries promotion corporation of Tamil Nadu (SIPCOT), Cuddalore from 7km to 17 km and gives the high Ground level concentration (GLC). In this direction the Cuddalore town affected at 24 km. The wind which is blowing from North-North-East (NNE) Chidambaram Natarajar temple at 15 km and the health resort of Rajah Muthaiya Medical College at 17 km may also has the possibility to get affect.
- 10. Air Pollution Dispersion Study In The Neighbourhood Of Coastal Super Power….. www.irjes.com 55 | Page As per the Bierly & Hewson reflected ground level concentration the sensitive area affected by above 160μg/m3 of SO2 ground level concentration in addition of Standard Gaussian Plume model (GPM) reflected ground level concentration of maximum of 80μg/m3 . But the National Ambient Air Quality Standard is adopted as 80μg/m3 . Now the SO2 ground level concentration is maximum than the NAAQ’s Standard, thence the more amount of sulfur dioxide ground level concentration generate the severe damage to this ecologically sensitive area. REFERENCES [1]. Ashok Kumar, D., and Rajendran, M.2014. Ambient Air Quality Study On Sipcot Cuddalore Tamilnadu in [2]. India, International Journal of Current Research,Vol.6, Isssue04, pp6247-6243. [3]. Briggs, G. A., 1971. Some recent analyses of plume rise observations. pp 1029-1032 in proceedings of the Second International Clean Air Congress (H. M. Englund and W. T. Berry, Eds.) Academic Press, New York. [4]. Bierly, E.W., and Hewson, E.W., (1963). Atmospheric Diffusion Studies Near a Lake Shore. Journal of Applied Meteorology, Vol.2, 390-396. [5]. Coppock, R.W.,and Mostrum M.S., 1997.Toxiology of oil field pollutants in cattle and other species pp45-114 [6]. Gifford F. A.,(1960). Atmospheric dispersion calculations using the generalized Gaussian plume model, Nuclear Safety, 2 (2) :56-59,67-68. [7]. HidyG.M.,(1994). Atmospheric sulfur and Nitrogen oxides Eastern North America Source receptor relationship, Academic Press Inc, San Diago 447p [8]. Holzworth,(1972).Mixing height, wind speed and potential for urban air pollution throughout the contiguous United States. AP-101, U.S Environmental Protection Agency, Research triangle park, NC.118pp. [9]. Irwin J.H, 1979. A theoretical variation of the wind profile power-law exponent as a function of surface roughness and stability, Atmospheric Environment, 13:pp 191-194. [10]. Pasquill F, (1961). The estimation of the dispersion of windborne material, Meteorology Magazine, 90 (1063): pp.33-49. [11]. Rapid Cumulative Environmental Impact Assessment Study, 2012. IL&FS Tamilnadupower company Limited [12]. Rajendran M,2006. Coastal Modeling for Air Pollutant Dispersion Ph.D thesis reported [13]. Sutton, O.G. 1953.Micrometeorology, McGraw-Hill Book company, INC, NewYork. [14]. Sankaran, D.,Murugappan.A., Kanakasabai.V.,and Rajendran.M., 2012.Meteorological Potential for Air Pollutants Dispersion In Urban and Rural Areas Along The East Coast Of Tamilnadu, International Journal of Engineering Science and Technology,Vol,4 No.06 pp 2552-2559. [15]. Shaleen Singha and AmitKapur. 2002.Industrial estate planning and management in India—an integrated approach towards industrial ecology, Journal of Environmental Management, Volume 66, Issue 1, , Pages 19–29. [16]. Turner, D.B. Workbook of Atmospheric Dispersion Estimate, Second edition, Lewis publishers, London. [17]. World Energy Council (2013), World Energy Scenarios: Composing energy futures to 2050.