
Recommended
Recommended
More Related Content
What's hot
What's hot (20)
Similar to A04550105
Similar to A04550105 (20)
More from IOSR-JEN
Recently uploaded
Recently uploaded (20)
A04550105
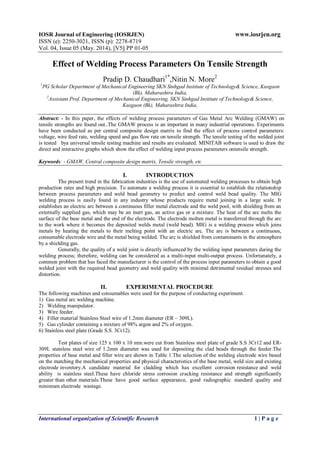
- 1. IOSR Journal of Engineering (IOSRJEN) www.iosrjen.org ISSN (e): 2250-3021, ISSN (p): 2278-8719 Vol. 04, Issue 05 (May. 2014), ||V5|| PP 01-05 International organization of Scientific Research 1 | P a g e Effect of Welding Process Parameters On Tensile Strength Pradip D. Chaudhari1* ,Nitin N. More2 1 PG Scholar Department of Mechanical Engineering SKN Sinhgad Institute of Technology& Science, Kusgaon (Bk), Maharashtra India, 2 Assistant Prof. Department of Mechanical Engineering, SKN Sinhgad Institute of Technology& Science, Kusgaon (Bk), Maharashtra India, Abstract: - In this paper, the effects of welding process parameters of Gas Metal Arc Welding (GMAW) on tensile strengths are found out..The GMAW process is an important in many industrial operations. Experiments have been conducted as per central composite design matrix to find the effect of process control parameters: voltage, wire feed rate, welding speed and gas flow rate on tensile strength. The tensile testing of the welded joint is tested bya universal tensile testing machine and results are evaluated. MINITAB software is used to draw the direct and interactive graphs which show the effect of welding input process parameters ontensile strength. Keywords: - GMAW, Central composite design matrix, Tensile strength, etc I. INTRODUCTION The present trend in the fabrication industries is the use of automated welding processes to obtain high production rates and high precision. To automate a welding process it is essential to establish the relationship between process parameters and weld bead geometry to predict and control weld bead quality. The MIG welding process is easily found in any industry whose products require metal joining in a large scale. It establishes an electric arc between a continuous filler metal electrode and the weld pool, with shielding from an externally supplied gas, which may be an inert gas, an active gas or a mixture. The heat of the arc melts the surface of the base metal and the end of the electrode. The electrode molten metal is transferred through the arc to the work where it becomes the deposited welds metal (weld bead). MIG is a welding process which joins metals by heating the metals to their melting point with an electric arc. The arc is between a continuous, consumable electrode wire and the metal being welded. The arc is shielded from contaminants in the atmosphere by a shielding gas. Generally, the quality of a weld joint is directly influenced by the welding input parameters during the welding process; therefore, welding can be considered as a multi-input multi-output process. Unfortunately, a common problem that has faced the manufacturer is the control of the process input parameters to obtain a good welded joint with the required bead geometry and weld quality with minimal detrimental residual stresses and distortion. II. EXPERIMENTAL PROCEDURE The following machines and consumables were used for the purpose of conducting experiment. 1) Gas metal arc welding machine. 2) Welding manipulator. 3) Wire feeder. 4) Filler material Stainless Steel wire of 1.2mm diameter (ER – 309L). 5) Gas cylinder containing a mixture of 98% argon and 2% of oxygen. 6) Stainless steel plate (Grade S.S. 3Cr12). Test plates of size 125 x 100 x 10 mm.were cut from Stainless steel plate of grade S.S 3Cr12 and ER- 309L stainless steel wire of 1.2mm diameter was used for depositing the clad beads through the feeder.The properties of base metal and filler wire are shown in Table 1.The selection of the welding electrode wire based on the matching the mechanical properties and physical characteristics of the base metal, weld size and existing electrode inventory.A candidate material for cladding which has excellent corrosion resistance and weld ability is stainless steel.These have chloride stress corrosion cracking resistance and strength significantly greater than other materials.These have good surface appearance, good radiographic standard quality and minimum electrode wastage.
- 2. Effect of Welding Process Parameters On Tensile Strength International organization of Scientific Research 2 | P a g e 2.1 CENTRAL COMPOSITE DESIGN (CCD) MATRIX In this work, the four process parameters of GMAW process each at five levels have been decided for welding AISI 3cr12 grade steel. These are very important controllable process parameters which will effects on weld bead and good appearance of weld bead. It is desirable to have five minimum levels of process parameters to reflect the true behavior of response parameters. The working ranges of the parameter are chosen by rough trials for a smooth appearance of weld bead. If the working ranges are smaller or larger the limits, then proper weld bead will not appear. The upper and lower limits of parameters are coded as +2 and -2 respectively. The coded values for intermediate ranges are calculated using the following equation: Xi = 2(2𝑥−(𝑋𝑚𝑎𝑥 + 𝑋𝑚𝑖𝑛 )) (𝑋𝑚𝑎𝑥 − 𝑋𝑚𝑖𝑛 ) Where Xi is the required coded value of parameter, X is any value of parameter from Xmin – Xmax. Xminis the lower limit of parameters and X is the upper limit parameters. The levels of the individual process parameters are given in table 2 The central composite design matrix for conducting the experiments consist of 28 sets of trials. This design matrix depend on number of input process (k)and comprises of four Centre points (equal to number of input process parameters) and eight star points (twice the number of input process parameters) and sixteen factorial designs (2K ), where 2 is the number of levels. The first 16 rows correspond to factorial portion, the row from 17 to 24 correspond to star point’s position and last 4 rows from 25 to 28 correspond to centrepoint’s position. Hence, final experimental design consist of 28 (i.e. 16+08+04= 28) trial and given in table 3. Table 3. Central composite design matrix Expt. No. Wire feed rate (F) Welding Speed (S) Welding Voltage (V) Gas flow rate (G) 1 -1 -1 -1 -1 2 -1 -1 -1 1 3 -1 -1 1 -1 4 -1 -1 1 1 5 -1 1 -1 -1 6 -1 1 -1 1 7 -1 1 1 -1 8 -1 1 1 1 9 1 -1 -1 -1 10 1 -1 -1 1 11 1 -1 1 -1 12 1 -1 1 1 13 1 1 -1 -1 14 1 1 -1 1 15 1 1 1 -1 16 1 1 1 1
- 3. Effect of Welding Process Parameters On Tensile Strength International organization of Scientific Research 3 | P a g e 17 -2 0 0 0 18 2 0 0 0 19 0 -2 0 0 20 0 2 0 0 21 0 0 -2 0 22 0 0 2 0 23 0 0 0 -2 24 0 0 0 2 25 0 0 0 0 26 0 0 0 0 27 0 0 0 0 28 0 0 0 0 III. EXPERIMENTAL RESULTS 3.1 Tensile Strength Measurement Tensile tests are used to determine the mechanical behaviour of material under statics, axial tensile or stretch loading. The tensile testing is carried out on twenty eight samples of AISI 3CR12 grade steels welded by GMAW process. The transverse tensile specimens are prepared as per ASTM E8 guidelines. Tensile tests are carried out in 600KN computer controlled universal testing machine (model No. TFUN-600).The cross- sectional area and pre-determined gauge length is measured before testing for each sample. The specimen is then loaded into a machine set up for tensile loads as per the ASME specification and placed in the proper grippers so that the tensile specimens undergo deformation. Once loaded, the machine can then be used to apply a steady, continues tensile load .With application of tensile load, specimens undergoes deformation and ductile fracture takes place at particular load and this values is recorded to calculate ultimate tensile strength of component. Table 4. Experimental results Sample No. Area (mm2 ) Gauge length(mm) Ultimate load(KN) Final length (mm) U.T.S. (MPa) % Elongation 1 194.00 60 86.50 76.50 445.88 27.50 2 195.94 60 88.50 75.40 451.67 25.67 3 196.02 60 88.00 77.20 448.95 28.67 4 197.00 60 89.50 76.90 454.31 28.17 5 196.95 60 92.00 74.90 467.12 24.83 6 196.95 60 92.50 78.60 469.66 31.00 7 195.94 60 91.50 78.40 466.98 30.67 8 198.90 60 90.00 78.20 452.49 30.33 9 198.97 60 91.00 76.90 457.36 28.17 10 198.90 60 90.50 76.20 455.00 27.00 11 196.95 60 88.50 76.10 449.35 26.83 12 195.84 60 89.50 75.90 457.01 26.50 13 198.97 60 92.00 76.30 462.38 27.17 14 199.92 60 91.50 76.80 457.68 28.00 15 200.94 60 91.00 76.40 452.87 27.33 16 195.94 60 91.50 77.10 466.98 28.50 17 196.95 60 91.00 77.00 462.05 28.33 18 197.96 60 89.50 76.60 452.11 27.67 19 197.96 60 90.50 76.40 457.16 27.33 20 198.90 60 90.00 76.30 452.49 27.17 21 199.92 60 89.50 75.80 447.68 26.33 22 198.97 60 88.50 75.40 444.79 25.67 23 199.92 60 89.50 75.90 447.687 26.50 24 197.96 60 90.00 76.10 454.64 26.83 25 197.88 60 91.00 76.30 459.87 27.17 26 198.97 60 92.50 76.80 464.89 28.00 27 200.94 60 91.50 77.20 455.36 28.67 28 198.90 60 92.00 77.60 462.54 29.33
- 4. Effect of Welding Process Parameters On Tensile Strength International organization of Scientific Research 4 | P a g e IV. RESULT AND CONCLUSION The effect of the four input process parameter on the responses of tensile strength is plotted. The effect of individual welding parameters and their Signification interaction on all the tensile strength are calculated quantitatively and analyzed. 4.1 Direct effect of process parameters on responses 4.1.1 Effects of process parameters on tensile strength (TS) From fig.1, it is observed that TS is directly proportional to S and G and inversely proportional to F and V. The increases in S and G increase the TS whereas the increase in F and V decrease in TS. Fig. 1 Effects of process parameters on tensile strength 4.2 Interaction effects of process parameters on responses 4.2.1 Interaction effect on wire feed rate and Gas flow rate on tensile strength (TS) Fig. 2 shows the interaction effect of F and G on TS. It is cleared from figure that the TS increase with increase in G for zero levels of F And TS increases with decrease in F for zero level of G. 2 0 450 460 -2 470 0 -2 2 TS (mpa) G(L/min) F(cm/min) Fig.2 Interaction surface plot of TS vs. F,G 4.2.2 Interaction effect on wire feed rate and welding speed on tensile strength (TS) Fig. 3 shows the interaction effect of F and S on TS. It is cleared from figure that the TS increase with increase in S for zero levels of F. And TS decreases with increase in F for zero level of S. 2 0 450 460 -2 470 0 -2 2 TS (mpa) S (cm/min) F(cm/min) Fig.3 Interaction surface plot of TS vs. F,S
- 5. Effect of Welding Process Parameters On Tensile Strength International organization of Scientific Research 5 | P a g e 4.2.3 Interaction effect on wire feed rate and voltage on tensile strength (TS) Fig. 4 shows the interaction effect of F and Von TS. It is cleared from figure that the TS decrease with increase in V for zero levels of F. Also TS decreases with increase in F for zero level of V. 2 0 450 460 -2 470 0 -2 2 TS (mpa) V(v) F(cm/min) Fig. 4 Interaction surface plot of TS vs. F,S V. CONCLUSION The effect of welding Input process parameters such as welding voltage, wire feed rate, welding speed and gas flow rate influences on mechanical properties i.e. tensile strength shows in the above graph. Minitab software is used for showing the proportionality between input parameters and tensile testing values in the above graph and interaction effects of process parameters on responses also shows in above graph. REFERENCES [1] D.V. Kiran, B. Basu, A. De; Influence of process variables on weld bead quality in two wire tandem submerged arc welding of HSLA steel, Journal of Material Processing Technology, (2012) 2041-2050. [2] I. Hajiannia, M. Shamanian, M. Kasiri; Microstructure and mechanical properties of AISI347 stainless steel/A335 low alloy steel dissimilar joint produced by gas tungsten arc welding, Material and Design, 50(2013) 566-573. [3] A. Kumar, P. Shailesh, S. Sundarrajan; Optimization of magnetic arc oscillation process parameters on mechanical properties of AA 5456 Alluminium alloy weldments, Material and Design, 29(2008) 1904- 1913. [4] P. Sathiya, M. K. Mishra, B. Shanmugarajan; Effect of shielding gases on microstructure and mechanical properties of super austenitic stainless steel by hybrid welding, Material and Design, 33(2012) 203-212. [5] A. N. Yemelyushin, A. B. Sychkov, V. P. Manin, M. A. Sheksheyev; Investigation of structure and mechanical properties of welded joints in steels of the K56 strength grade in different welding conditions, Welding International, 2013 66(1) 3-7. [6] A. Kumar, S. Sundarrajan; Selection of welding process parameters for the optimum Butt-Joint Strength of an Aluminium Alloy, Materials and Manufacturing Processes, 21(2006), 779-782. [7] P. K. Palani, N. Murugan; Prediction of delta ferrite content and effect of welding process parameters in claddings by FCAW, Materials and Manufacturing Processes, 21(2006) 431-438.