SlideShare a Scribd company logo
1 of 12
Download to read offline
International Journal of Scientific Research and Engineering Development-– Volume X Issue X, Year
Available at www.ijsred.com
ISSN : 2581-7175 ©IJSRED: All Rights are Reserved Page 1
Applications of Operations Research in Minimizing Emission
related Externalities of Power Plants
Pratik Doshi*, Nuti Thakkar**, Pranav Kapoor`, Pranav Thawani``, Prakhar Pandey```
*(
*(Student at NMIMS University, VL Mehta Road, Vile Parle, Mumbai
Email: pratikdoshi99@gmail.com)
** (Student at NMIMS University, VL Mehta Road, Vile Parle, Mumbai
Email: nutithakkar1259@gmail.com)
`(Student at NMIMS University, VL Mehta Road, Vile Parle, Mumbai
Email: pranav413k@gmail.com)
``(Student at NMIMS University, VL Mehta Road, Vile Parle, Mumbai
Email: pranavthawani@gmail.com)
```(Student at NMIMS University, VL Mehta Road, Vile Parle, Mumbai
Email: prakharpandey8@gmail.com)
----------------------------------------************************----------------------------------
Abstract:
Power generation is a leading contributor to air quality deterioration. This has led to the emergence of basic
air quality benchmarks that are supposed to be upheld by power companies. While these decisions are taken
keeping the health of the broad environment in mind, little is done to reduce or compensate for the damage
caused in the regions surrounding power plants. This research employs pollution measurement models and
combines them with Operations Research techniques to come up with solutions that make lives easier for
people living around power plants.
Keywords —Plume Dispersion, Optimizing Power Plant Locations, Minimizing Pollution
Concentration, Improving Health Standards, Simulation Techniques..
----------------------------------------************************----------------------------------
I. INTRODUCTION
“Recent years have witnessed growing concerns
about the harmful ramifications of industrial
development and urbanization in the form of climate
change and global warming (Rohit Nishant, 2012).
The findings of the International Panel on Climate
Change (IPCC), a body formed by the United
Nations (UN), suggest that greenhouse gases
(GHGs) are responsible for global
warming(National Geographic, 2019). A major
source of the GHGs emissions is caused by industrial
operations.
The increasing cognizance of adverse environmental
impact has resulted in organizational efforts targeted
at reducing harmful environmental impact. A recent
industry report indicates that IT infrastructure such
as data centres contributes to 2% of the annual GHGs
emissions (Computerworld, 2007) . This has resulted
in the emergence of green IT as a significant
component of a broad stream of initiatives focused
on improving environmental performance of
organizations.
The last three decades have seen a stream of research
on the impact of environmental performance and
regulations on an organization’s financial
RESEARCH ARTICLE OPEN ACCESS
International Journal of Scientific Research and Engineering Development-– Volume X Issue X, Year
Available at www.ijsred.com
ISSN : 2581-7175 ©IJSRED: All Rights are Reserved Page 2
performance. There have been two distinct views on
the possible direction of the relationship between
environmental performance and organizational
performance. The underlying argument is that the
drive towards better environmental performance
would be achieved by organizational research and
operations towards cutting down on emissions. One
of the important components of the environmental
performance of organizations is GHG emissions,
which refers to discharge of gases such as carbon
dioxide (CO2), methane (CH4), nitrous oxide (N2O)
and fluorinated gases. These gases trap heat in the
atmosphere and thus contribute to global warming
and climate change. The GHG emissions are
measured and tracked using a protocol developed by
the World Resources Institute (WRI) and the World
Business Council for Sustainable Development
(WBCSD) (The Greenhouse Gas Protocol Initiative
2011).
The emergence of environmental problems on global
forums have led to the development of the concept
of Emissions Trading. Given the externalities
associated with emissions, every company is
allocated limited emission rights. These rights cap
the emissions by the operations of individual
companies. Companies who have unused rights can
sell them to those who have exhausted their rights.
This provides a financial incentive for companies to
minimize their emissions.” 1
Various studies like
(Tim Laing, 2013) and (Xiting Gong, 2013) have
been conducted to assess the financial, business and
environmental implications of emissions trading and
carbon tax.
1
Content in quotes referred from (Rohit Nishant, 2012)
2
Content Referred from (The Guardian, n.d.), (Glick, n.d.),
(NASA Earth Observatory, n.d.) and (Wikipedia, n.d.)
II. OPERATIONS RESEARCH
Operations Research Techniques have played a
major role in optimizing operations. This area of
study has helped in developing strategies that save
time, money and energy. It has applications in
industries such as airlines, manufacturing, services,
military and government. Some business
applications of operations research include market
strategy planning, capital budgeting with the help of
Linear Programming (LP), manpower assignment,
machine assignment and space allocation with the
help of Assignment and Transportation Models.
(Javadi, 2011) published his findings on how
principles of operations research were being applied
in schools and academic institutions. (Rodolfo C.
Salazar, 1968) used simulations and stochastic linear
programming to compute expected returns from
portfolios of projects.
Operations Research Techniques such as simulation
models have been particularly useful in reducing
emissions and making key decisions whose ultimate
result is reduced environmental damage. Works such
as (Najam Khan, 2019) have dived deep into
software based simulation that is aimed at
minimizing coal transportation cost and electricity
transmission loss while keeping emissions under
regulatory standards. Other work in the areas of
energy and environment that have taken a
quantitative approach include (Dang Gu Chai, 2017).
III. OVERVIEW2
Through the course of time, pollution has
imperceptibly become one of the most hazardous
threats to the environment. As a result of negligence
towards strict regulations there has been a
International Journal of Scientific Research and Engineering Development-– Volume X Issue X, Year
Available at www.ijsred.com
ISSN : 2581-7175 ©IJSRED: All Rights are Reserved Page 3
detrimental impact on the environment. Around
700,000 premature deaths are caused due to toxic
emissions. To minimize the increasing impact there
have been multiple interventions in recent years by
many organizations/governments. In the timeline of
these interventions there are certain junctures which
have been important for the safeguarding of the
environmental condition. Some examples of these
are the Paris Convention, the United Nations
Framework Convention on Climate Change, the
Biological Diversity Convention and some local
movements such as the Chipko movement. These
movements have resulted in strict regulations and
colossal punishments for disregarding them. Various
studies have been conducted to study the
implications of countries individual emissions on a
global level. (Welsh, 1990) published the
implications of cross border air pollution in Western
Europe while keeping the cost element in min. There
has been an average implementation of 100 new laws
every year since 2009. Some of these rules include
legal limits on emission of greenhouse gasses and
pollutants and prohibition of use of environmentally
toxic materials (Eg: recent ban on one time use
plastic). In view of the future trajectory of each
country’s emission there have also been POAs (plans
of action) allocated to each country; These
movements have formed POAs to keep annual
global warming well under 2 °C. This has been done
to provide a guideline for countries to try and
maintain coherence between the actual emissions
and the predicted emissions. Although there have
been multiple treaties, conventions and other plans
the global temperature has been constantly rising by
approximately 0.2 degrees Celsius every decade.
Emission of particulate matter 2.5 (emissions of
compounds which are a concern for human health)
has increased over time in various countries. As a
result of the global warming, glaciers decrease in a
volume of 1.07 × 10⁶ km² every year;
The Kilimanjaro has melted over 80% (Glick, n.d.)
and parts of the Himalayas could disappear by 2035.
The warming and melting has also heightened the
sea by around 19cm and harmed a lot of animal life.
Non-compliant countries are having a huge impact
on the environment and global warming records have
been periodic and constant; Though the punishments
are strict it will be a hard task to prevent global
warming to increase global temperatures from 1.5°C
to 2°C.
With increase in Global Warming caused due to
emissions leading to stronger and frequent storms,
draughts and increased sea level, it became
imperative to find a solution leading to the invent of
Renewable Energy. The wide increase in renewable
energy - Solar Power, Wind Power, Hydro Power,
Ocean Energy, Geothermal Energy, Solar Thermal
Heating and Cooling and Biofuels; it has reduced
greenhouse gas as well as dust emission. It decreases
emission by 81%.
Not only that but models like Energy and R&D
Roadmaps and System like Prospective outlook on
Long Term Energy have helped minimise emission
and stimulate and analyse the economic perspective
of world’s energy sector.
International Journal of Scientific Research and Engineering Development-– Volume X Issue X, Year
Available at www.ijsred.com
ISSN : 2581-7175 ©IJSRED: All Rights are Reserved Page 4
Source: (NASA Earth Observatory, n.d.)
The figure above sheds light on the historical
temperature anomalies as calculated by different
research bodies. This can largely be attributed to
increasing emission levels across the globe. The
primary composition of these emissions is CO2, SO2,
NOx, Particulate Matter and varying amounts of
toxic metals lead and mercury. Extensive research on
the environmental and economic damage caused by
emissions has been conducted earlier and their
conclusions are exhibited in (Kenneth Gillingham,
2018).
IV. RESEARCH OBJECTIVES
The objective of this paper is to study existing
literature on Pollutant Dispersion and Pollutant
Exposure Minimizing Techniques and recommend
models that can optimize pollutant exposure using
constraints not used earlier (Example: Population
density of surrounding region) . The ultimate goal of
the study is to make these models flexible to
facilitate easy integration of different pollutant
concentration models.
V. METHODOLOGY
Work done by (Najam Khan, 2019) adopted a unique
approach of using computer simulations to solve the
complex problem of optimising cost while meeting
environmental emission standards for power plants.
The approach adopted in their research serves as
inspiration for this research paper. The model
proposed in this paper suggests that an existing
Plume Dispersion Model be used to calculate a
statistic that can represent the emission related
externality associated with setting up a power plant
at all possible locations on a 2-D plane surface and
optimizing the location of the power plant to
minimize the associated externalities. The model
also proposes that the population of the habitation
areas be taken into account to correctly estimate the
associated externality.
VI. LITERATURE REVIEW
This study employees the Gaussian Plume dispersion
Model to calculate the concentration of pollutants at
International Journal of Scientific Research and Engineering Development-– Volume X Issue X, Year
Available at www.ijsred.com
ISSN : 2581-7175 ©IJSRED: All Rights are Reserved Page 5
a particular location from the power plant. Numerous
other equations have been developed that help in
similar calculations under various conditions.
“Models like the METI LIS (A. Kouchi, 2004) and
AIST-ADMER were developed in Japan to study
industrial emissions. The National Institute of
Advanced Industrial Science and technology
developed the AIST-ADMER model that takes into
account metrological data and emission specific
characteristics to estimate the chemical
concentration of emissions in a particular area. The
METI LIS model was developed by the Japanese
Ministry of Economy, Trade and Industry to study
emissions under various environmental conditions. It
was used to calculate emissions using in Vietnam
(Nguyen Huu Huan, 2012). (Razi, 2012) used the
AIST-ADMER model to estimate regional
concentration and distribution of mercury in the
Honshu Island. Individual models to study
individual gases were also developed.” 3
(Hicham
Gourgue, 2015) developed models to study nitrous
oxide compounds emitted from boilers.
Apart from the models that try to estimate plume
dispersion, several scholars have worked on
equations that explain plume rise (Seema Awasthia,
2006). In this study, the effective height of the stack
was taking into account. The effective height of the
stack is a sum of the actual height of the chimney and
the natural rise in the emitted gases when they are
released. (F.W. Thomas, 1969) came up with the
results of a study involving major electricity
generation stations in England in 1963. Simulation
has been used in earlier research to optimize costs
(Zhijie Zhu, 2019).
This area of study is a unique blend of science and
operations research where the models are based on
the principals of science while their optimization is
3
Referenced from (Najam Khan, 2019)
achieved from principles of Operations research.
Therefore the literature surrounding this field also
seeks inspiration from both Scientists and
Operations Researchers.
VII. LOCATION OPTIMIZING MODEL
As Stated earlier, the model proposed in this paper
employs simulations. The volume of calculations
arising out of computing the concentration of
pollutants suggests that they be done through
software. For the purpose of this paper, a suitable
computer algorithm was developed whose results
have been displayed. (Figures 1-4)
Key Computations undertaken by the
Algorithm:
1. Concentration of Pollutants: The
concentration of pollution for every region is
calculated using the Gaussian Plume
Dispersion Model (Arya, 1999).
C =
𝑄
𝜋.𝑢.𝜎 𝑦. 𝜎 𝑧
.ⅇ
(
−𝐻2
2 (𝜎 𝑧)2)
.ⅇ
(
−𝑦2
2 (𝜎 𝑦)
2)
Where ‘C’ is the concentration in ug/m3
, ‘Q’
is the rate of emission of pollutants from the
plant in ug/sec, ‘u’ is the velocity of the wind
in m/sec at the height where the pollutants are
released in the air, sigma y is the horizontal
dispersion of plume particles from the central
line (absolute trajectory of plume), sigma z is
vertical dispersion of plume particles from
the central line, ‘H’ is the effective height of
the stack (chimney) that is emitting the
pollutants and ‘y’ is the Y coordinate of the
region. The model calculates the pollution
concentration at ground level for a location
International Journal of Scientific Research and Engineering Development-– Volume X Issue X, Year
Available at www.ijsred.com
ISSN : 2581-7175 ©IJSRED: All Rights are Reserved Page 6
with X and Y coordinates on a plane. The
coordinates of the location are expressed by
aligning the x-axis with the trajectory of the
prevalent wind.
It should be noted that:
• For every region, only the maximum
concentration of pollutants (worst air
quality) at ground level is taken into
account. The concentration of
pollutants is maximum when the
region falls on the trajectory of the
wind that is carrying the plume. Thus
the variable ‘y’ is set to 0 during the
calculations
• The pollutant concentration is
calculated at ground level. As a
result, the variable ‘z’ which appears
in the standard version of the
equation is ignored above. ‘z’
represents the height of the point
from the ground level (which in this
case is 0)
2. Weighted Average Exposure (WAE): A
weighted average (Investopedia, 2019) of the
concentration of pollutants across
surrounding areas of habitation, using the
population of those areas as weights is used
to represent the environmental externality
associated with setting up a factory at a
particular location.
WAE =
∑ 𝑐 𝑖 . 𝑃 𝑖
𝛴 𝑃 𝑖
Where ‘C‘ is the maximum possible
concentration of pollutants in region
‘i’ and ‘P’ is the population of that
region.
3. Simulations: The Weighted Average
Exposure (WAE) is calculated with reference
to every point on the 2D plane where setting
up a power plant is possible. The final step is
to select the location of the power plant that
has the minimum WAE.
Application of the Model: Illustration
Region
The Simulation procedure is applied to a 10 km x 10
km plot of land which has 20 inhabited regions with
varying population densities in each region. The
area under consideration is at sea level, dry and
largely devoid of any vegetation. This means there is
no need for any deforestation and the only
externality associated with setting up a power plant
in this region is the resultant pollutant emissions. The
20 inhabited regions are randomly dispersed in the
area. The environmental conditions are stable and
there is little experience of winds at ground level.
This is why the region does not experience dust
storms in spite of low green cover in the area.
The region is described keeping in mind the pre-
requisites of using the Gaussian Plume Dispersion
Model. As regions vary, the model may become less
accurate. It is therefore recommended to modify the
models when dealing with diverse environmental
and climatic conditions.
International Journal of Scientific Research and Engineering Development-– Volume X Issue X, Year
Available at www.ijsred.com
ISSN : 2581-7175 ©IJSRED: All Rights are Reserved Page 7
Figure 1: 2-D Plane representation
The region can be visualized with the help of the
above map. The map highlights the randomly
dispersed habitations (blue bubbles). The size of the
bubble highlights the relative population density of
that habitation as compared to the others. The area
under consideration is only 10 km x 10 km.
Power Plant
The power plant is proposed to have a stack
(chimney) height of approximately 100m and the
maximum height the plume is expected to rise to is
150m. The average wind speed at the effective height
of 150m is assumed to be 10m/sec. The boiler
exhaust system will consist of only one blower that
can effectively blow out plume at the rate of 500
g/sec.
Pollution Concentration and the Weighted Average
Exposure
The weighted average exposure to pollutants is
calculated for every possible point where the plant
can be set up. The following figure shows the
exposure to pollutants by all the inhabited regions
when the plant is placed at the coordinates (2,2).
-2
0
2
4
6
8
10
12
-2 0 2 4 6 8 10 12
2D Plane under Consideration (in km)
International Journal of Scientific Research and Engineering Development-– Volume X Issue X, Year
Available at www.ijsred.com
ISSN : 2581-7175 ©IJSRED: All Rights are Reserved Page 8
Figure 2: Exposure due to power plant at (2,2)
The power plant is marked by the small green circle.
The bubbles represent the habitations and their
relative size highlights the exposure to pollutants. In
order to arrive at the Weighted Average Exposure
(WAE), the average of the pollution concentration of
the habited areas is taken, using their respective
populations as weights. The WEA for the plant
location (2,2) turns out to be 9.48 ug/m3
. The WEA
for all the possible plant locations are calculated to
estimate the location-wise impact of the power plant.
It should be noted that there may be water bodies,
highways, habitations and government reserved
forests in the area under consideration. The location
of such structures must be excluded from the
simulation process as setting up a power plant is not
possible in those areas. The simulation process itself
operates on a degree of precision. It is possible to
achieve a degree of precision to the last metre.
The figure below summarizes the results of the
simulation algorithm developed.
International Journal of Scientific Research and Engineering Development-– Volume X Issue X, Year
Available at www.ijsred.com
ISSN : 2581-7175 ©IJSRED: All Rights are Reserved Page 9
Figure 3: Results of the simulation algorithm
The precision on the algorithm was set to 1km to
facilitate presentation of the results on a table. The
WAE values in each cell are expressed in ug/m3
. The
least WAE occurs in cell (0,0). This implies that
setting up the power plant at that location will result
in least externality. The empty cells represent the
inhabited areas. They are left empty because it is not
possible to place a power plant there. The optimum
value is 4.087 ug/m3
. The table also makes it easy to
analyse the externalities and allow the decision
maker to select the second or third best location if the
first is unavailable. Figure 4 depicts the scenario
when the power plant is placed at (0,0), which is the
optimal point. The size of the bubbles represent the
degree of concentration of pollutants. The larger the
bubbles, the greater is the exposure. It should be
noted that there is a striking difference
in the size of bubbles in Figure 2 and that in Figure
4. On an average, the bubbles are smaller in Figure
4, implying lower exposure levels on average in
Figure 4.
International Journal of Scientific Research and Engineering Development-– Volume X Issue X, Year
Available at www.ijsred.com
ISSN : 2581-7175 ©IJSRED: All Rights are Reserved Page 10
Figure 4: Exposure levels at optimized plant location
VIII. GENERALIZATION OF THE MODEL
The simulation procedure adopted in this study is
flexible. Plume Dispersion Models come with their
own set of assumptions and pre-requisites. One
model cannot be used in all types of environments
and geographies. However, it is possible to use this
simulation procedure along with other Plume
Dispersion Models.
A generalized process to be followed while using a
similar simulation procedure is summarized below.
1. Selecting the Plume Dispersion Model to
calculate the concentration of pollutants at
any given location relative to the location of
the power plant.
2. Assigning values to the constants used in the
calculation of pollutant concentration
depending upon various environmental and
territorial factors
3. Selecting a possible location where the plant
can be set up.
4. Developing/Selecting a statistic that can be
used to measure the externalities associated
with setting up a power plant at that location.
It should be noted that this statistic is the
variable, whose minimization will ultimately
determine the location of the power plant. It
should be designed in a way, such that it
fairly represents the pollutant concentration
across all the nearby areas occurring by
setting up the plant at that location (the one
selected in step 3)
5. Calculating the value of the statistic for every
possible location where the plant can be set-
up. In other words, repeating step 2 and 3 for
all possible locations.
6. Minimizing the statistic
International Journal of Scientific Research and Engineering Development-– Volume X Issue X, Year
Available at www.ijsred.com
ISSN : 2581-7175 ©IJSRED: All Rights are Reserved Page 11
IX. CONCLUSION
Pollutants in the environment due to emission
externalities has been a huge problem and the major
concern is to counter the confounded risk of
emission externalities leading to affecting of public
health as well as environmental damage. Here we
tried various interventions to reduce greenhouse
gases by finding an optimal location with the least
WAE. The goal here was to minimise public
exposure of harmful emissions. Using operational
and emission perspectives we came to a conclusion
for a best candidate location for the power plant.
X. LIMITATIONS
The study suffers from the limitations of correct
model selection. There are a lot of models that
explain Pollution dispersion under multiple
conditions. Variables such as wind velocity,
temperature of the atmosphere, temperature of the
emitted gases, wind direction, rate of gaseous
emission, humidity conditions, geographical terrain,
vegetative cover and many others affect the
concentration of pollutants. The sheer number of
variables makes the models complex and sometimes
less accurate. The Gaussian Plume distribution
model cannot be applied to emissions which have
high concentrations of gases that with other
constituents of the atmosphere. There can be no
decay, oxidation, combustion or any other process
that chemically changes the properties of the plume.
The occurrence of any of these reactions will result
into inaccurate estimation of pollutant concentration
through the Gaussian Dispersion model.
Furthermore, the accuracy of the estimates reduces
when there are a lot of barriers because a part of the
particulate matter settles on surfaces of trees,
buildings, mountains and even the ground.
Occurrences of natural events like rainfall
completely distorts the estimates. The chemical
properties of the plume and its temperature during
emissions determines how high it rises. This has a
considerable impact on concentration estimate.
Furthermore, the Gaussian Distribution model
assumes that winds carry the plume. The model fails
to estimate the impact of common gas dispersion
under very low wind conditions.
These limitations can however be overcome by
careful selection of the model to calculate plume
dispersion. The problems that arise out of conducting
simulations is that they can never be done without a
software.
REFERENCES
A. Kouchi, K. O. (2004). Development of a low-rise industrial
source dispersion model (METI-LIS model).
International Journal of Environment and Pollution,
325-338.
Arya, S. P. (1999). Air Pollution Meteorology and Dispersion.
New York: Oxford University Press.
Computerworld. (2007, December 03). Enterprises Struggle
with Under Used Datacentres. Retrieved from
techworld.com:
https://www.techworld.com/news/data/enterprises-
struggle-with-under-used-datacentres-10822/
Dang Gu Chai, P. F. (2017). Quantitative analysis on the
energy and environmental impact of the Korean
National Energy R&D Roadmap; Using Bottom up
energy system model.
F.W. Thomas, S. C. (1969). Plume Rise Estimates for electric
Generating Stations. Great Britain.
Glick, D. (n.d.). The Big Thaw. Retrieved from
nationalgeographic.com:
https://www.nationalgeographic.com/environment/gl
obal-warming/big-thaw/
Hicham Gourgue, A. A. (2015). Dispersion of the NOx
Emissions from Chimneys Around Industrial Area:
Case Study of the Company CIBEL II.
Materialstoday: Proceedings, 4689-4693.
Investopedia. (2019, 10 4). Retrieved from investopedia.com:
https://www.investopedia.com/terms/w/weightedaver
age.asp
Javadi, M. H. (2011). Application and roles of management
science tools and techniques to effective decision
making in the academic settings . Ishfahan: Elsevier
Ltd.
Kenneth Gillingham, J. H. (2018). Cost of reducing
greenhouse gas emissions. Journal of Economic
Perpspectives.
Najam Khan, E. K. (2019). Location Optimization of a Coal
Power Plant to Balance Costs against Plant’s
Emission Exposure. American Journal of operations
Research, 31-58.
NASA Earth Observatory. (n.d.). Retrieved from
earthobservatory.nasa.gov:
International Journal of Scientific Research and Engineering Development-– Volume X Issue X, Year
Available at www.ijsred.com
ISSN : 2581-7175 ©IJSRED: All Rights are Reserved Page 12
https://earthobservatory.nasa.gov/world-of-
change/DecadalTemp
National Geographic. (2019, January 17). Retrieved from
nationalgeographic.com:
https://www.nationalgeographic.com/environment/gl
obal-warming/global-warming-causes/
Nguyen Huu Huan, N. X. (2012). METI-LIS MODEL TO
ESTIMATE H2S EMISSION RATES FROM TO
LICH RIVER, VIETNAM . ARPN Journal of
Engineering and Applied Sciences, 1473-1479.
Razi, H. (2012, January). Modeling of atmospheric dispersion
of mercury from coal–fired power plants in Japan.
Athmospheric Pollution Research, pp. 226-237.
Rodolfo C. Salazar, S. K. (1968). A Simulation Model of
Capital Budgeting under Uncertainty. Informs.
Rohit Nishant, T. S. (2012). Does Environmental Performance
Affect Organizational Performance? Evidence from
Green IT Organizations. Thirty Third International
Conference on Information Systems. Orlando.
Seema Awasthia, M. K. (2006). General plume dispersion
model (GPDM) for point source emission. Delhi:
Springer.
The Guardian. (n.d.). Whats the target for Solcing Climate
Change. Retrieved from theguardian.com:
https://www.theguardian.com/environment/2011/nov
/14/climate-change-targets
Tim Laing, M. S. (2013). Assessing the effectiveness of the
EU. Grantham Research Institute on Climate Change
and the Environment. Retrieved from
https://pdfs.semanticscholar.org/7e47/e17c418a0aeae
20db4c8dd071f8ad020e6c2.pdf
Welsh, H. (1990). Cost-Effective Control Strategies for
Energy-Related Transboundaiy Air Pollution in
Western Europe. The Energy Journal, 87-104.
Wikipedia. (n.d.). Environmental Movement. Retrieved from
wikipedia.org:
https://en.wikipedia.org/wiki/Environmental_movem
ent
Xiting Gong, S. X. (2013, August). Optimal Production
Planning with Emissions Trading. Operations
Research.
Zhijie Zhu, X. L. (2019). Simulation Research on emission
control.

More Related Content

What's hot

Stakeholder Debate in Policy Implementation: An Evaluation of Bangladesh Leat...
Stakeholder Debate in Policy Implementation: An Evaluation of Bangladesh Leat...Stakeholder Debate in Policy Implementation: An Evaluation of Bangladesh Leat...
Stakeholder Debate in Policy Implementation: An Evaluation of Bangladesh Leat...Shahadat Hossain Shakil
 
Key messages from the AR5 WGI with focus on Saudi Arabia and the region
Key messages from the AR5 WGI with focus on Saudi Arabia and the regionKey messages from the AR5 WGI with focus on Saudi Arabia and the region
Key messages from the AR5 WGI with focus on Saudi Arabia and the regionJesbin Baidya
 
Mitigation in the context of the Paris Agreement
Mitigation in the context of the Paris AgreementMitigation in the context of the Paris Agreement
Mitigation in the context of the Paris AgreementJesbin Baidya
 
Emerging trends in green technology
Emerging trends in green technologyEmerging trends in green technology
Emerging trends in green technologyDeepak Gupta
 
Climate Variability: Integration of Renewable Energy into Present and Future ...
Climate Variability: Integration of Renewable Energy into Present and Future ...Climate Variability: Integration of Renewable Energy into Present and Future ...
Climate Variability: Integration of Renewable Energy into Present and Future ...AI Publications
 
MLA_Analysis of the potential of Anaerobic Digestion in developing countries
MLA_Analysis of the potential of Anaerobic Digestion in developing countriesMLA_Analysis of the potential of Anaerobic Digestion in developing countries
MLA_Analysis of the potential of Anaerobic Digestion in developing countriesMohamed Lahjibi
 
A global_outlook_of_economic_expansion_and_environmental_degradation-__an_emp...
A global_outlook_of_economic_expansion_and_environmental_degradation-__an_emp...A global_outlook_of_economic_expansion_and_environmental_degradation-__an_emp...
A global_outlook_of_economic_expansion_and_environmental_degradation-__an_emp...Marwadi University Rajkot
 
Climate change and business opportunities for consultancy and engineering
Climate change and business opportunities for consultancy and engineeringClimate change and business opportunities for consultancy and engineering
Climate change and business opportunities for consultancy and engineeringMedi Ambient. Generalitat de Catalunya
 
Assessment of the Extent to which Strategic Environmental Assessment (SEA) ca...
Assessment of the Extent to which Strategic Environmental Assessment (SEA) ca...Assessment of the Extent to which Strategic Environmental Assessment (SEA) ca...
Assessment of the Extent to which Strategic Environmental Assessment (SEA) ca...Shahadat Hossain Shakil
 
Role of sustainability indices in tall buildings
Role of sustainability indices in tall buildingsRole of sustainability indices in tall buildings
Role of sustainability indices in tall buildingssabnisajit
 
Ipcc initiative in climate change mitigation
Ipcc initiative in climate change mitigationIpcc initiative in climate change mitigation
Ipcc initiative in climate change mitigationParvati Tamrakar
 
Environmental and societal issues, energy conservation through better process...
Environmental and societal issues, energy conservation through better process...Environmental and societal issues, energy conservation through better process...
Environmental and societal issues, energy conservation through better process...Manish Gupta
 
IPCC key messages including from the Special Report on Global Warming of 1.5 ...
IPCC key messages including from the Special Report on Global Warming of 1.5 ...IPCC key messages including from the Special Report on Global Warming of 1.5 ...
IPCC key messages including from the Special Report on Global Warming of 1.5 ...ipcc-media
 
Chapter 4 - Key findings from Chapter 4
Chapter 4 - Key findings from Chapter 4Chapter 4 - Key findings from Chapter 4
Chapter 4 - Key findings from Chapter 4ipcc-media
 
Introduction to Climate Science
Introduction to Climate ScienceIntroduction to Climate Science
Introduction to Climate Scienceipcc-media
 
Environmental Impacts of COVID-19 Pandemic: PPT
Environmental Impacts of COVID-19 Pandemic: PPTEnvironmental Impacts of COVID-19 Pandemic: PPT
Environmental Impacts of COVID-19 Pandemic: PPTSeminar Links
 
The Socio-Economic and Environmental Impacts of the Implementation of Carbon ...
The Socio-Economic and Environmental Impacts of the Implementation of Carbon ...The Socio-Economic and Environmental Impacts of the Implementation of Carbon ...
The Socio-Economic and Environmental Impacts of the Implementation of Carbon ...paperpublications3
 
Community greening in pre and post climate change knowledge era in third worl...
Community greening in pre and post climate change knowledge era in third worl...Community greening in pre and post climate change knowledge era in third worl...
Community greening in pre and post climate change knowledge era in third worl...Alexander Decker
 
Module 10 - Section 1 Introduction: adaptation, mitigation & energy & climate...
Module 10 - Section 1 Introduction: adaptation, mitigation & energy & climate...Module 10 - Section 1 Introduction: adaptation, mitigation & energy & climate...
Module 10 - Section 1 Introduction: adaptation, mitigation & energy & climate...Richard Labelle
 

What's hot (20)

Stakeholder Debate in Policy Implementation: An Evaluation of Bangladesh Leat...
Stakeholder Debate in Policy Implementation: An Evaluation of Bangladesh Leat...Stakeholder Debate in Policy Implementation: An Evaluation of Bangladesh Leat...
Stakeholder Debate in Policy Implementation: An Evaluation of Bangladesh Leat...
 
Key messages from the AR5 WGI with focus on Saudi Arabia and the region
Key messages from the AR5 WGI with focus on Saudi Arabia and the regionKey messages from the AR5 WGI with focus on Saudi Arabia and the region
Key messages from the AR5 WGI with focus on Saudi Arabia and the region
 
Mitigation in the context of the Paris Agreement
Mitigation in the context of the Paris AgreementMitigation in the context of the Paris Agreement
Mitigation in the context of the Paris Agreement
 
Emerging trends in green technology
Emerging trends in green technologyEmerging trends in green technology
Emerging trends in green technology
 
Climate Variability: Integration of Renewable Energy into Present and Future ...
Climate Variability: Integration of Renewable Energy into Present and Future ...Climate Variability: Integration of Renewable Energy into Present and Future ...
Climate Variability: Integration of Renewable Energy into Present and Future ...
 
MLA_Analysis of the potential of Anaerobic Digestion in developing countries
MLA_Analysis of the potential of Anaerobic Digestion in developing countriesMLA_Analysis of the potential of Anaerobic Digestion in developing countries
MLA_Analysis of the potential of Anaerobic Digestion in developing countries
 
A global_outlook_of_economic_expansion_and_environmental_degradation-__an_emp...
A global_outlook_of_economic_expansion_and_environmental_degradation-__an_emp...A global_outlook_of_economic_expansion_and_environmental_degradation-__an_emp...
A global_outlook_of_economic_expansion_and_environmental_degradation-__an_emp...
 
Climate change and business opportunities for consultancy and engineering
Climate change and business opportunities for consultancy and engineeringClimate change and business opportunities for consultancy and engineering
Climate change and business opportunities for consultancy and engineering
 
Assessment of the Extent to which Strategic Environmental Assessment (SEA) ca...
Assessment of the Extent to which Strategic Environmental Assessment (SEA) ca...Assessment of the Extent to which Strategic Environmental Assessment (SEA) ca...
Assessment of the Extent to which Strategic Environmental Assessment (SEA) ca...
 
Ijertv10n1spl 18
Ijertv10n1spl 18Ijertv10n1spl 18
Ijertv10n1spl 18
 
Role of sustainability indices in tall buildings
Role of sustainability indices in tall buildingsRole of sustainability indices in tall buildings
Role of sustainability indices in tall buildings
 
Ipcc initiative in climate change mitigation
Ipcc initiative in climate change mitigationIpcc initiative in climate change mitigation
Ipcc initiative in climate change mitigation
 
Environmental and societal issues, energy conservation through better process...
Environmental and societal issues, energy conservation through better process...Environmental and societal issues, energy conservation through better process...
Environmental and societal issues, energy conservation through better process...
 
IPCC key messages including from the Special Report on Global Warming of 1.5 ...
IPCC key messages including from the Special Report on Global Warming of 1.5 ...IPCC key messages including from the Special Report on Global Warming of 1.5 ...
IPCC key messages including from the Special Report on Global Warming of 1.5 ...
 
Chapter 4 - Key findings from Chapter 4
Chapter 4 - Key findings from Chapter 4Chapter 4 - Key findings from Chapter 4
Chapter 4 - Key findings from Chapter 4
 
Introduction to Climate Science
Introduction to Climate ScienceIntroduction to Climate Science
Introduction to Climate Science
 
Environmental Impacts of COVID-19 Pandemic: PPT
Environmental Impacts of COVID-19 Pandemic: PPTEnvironmental Impacts of COVID-19 Pandemic: PPT
Environmental Impacts of COVID-19 Pandemic: PPT
 
The Socio-Economic and Environmental Impacts of the Implementation of Carbon ...
The Socio-Economic and Environmental Impacts of the Implementation of Carbon ...The Socio-Economic and Environmental Impacts of the Implementation of Carbon ...
The Socio-Economic and Environmental Impacts of the Implementation of Carbon ...
 
Community greening in pre and post climate change knowledge era in third worl...
Community greening in pre and post climate change knowledge era in third worl...Community greening in pre and post climate change knowledge era in third worl...
Community greening in pre and post climate change knowledge era in third worl...
 
Module 10 - Section 1 Introduction: adaptation, mitigation & energy & climate...
Module 10 - Section 1 Introduction: adaptation, mitigation & energy & climate...Module 10 - Section 1 Introduction: adaptation, mitigation & energy & climate...
Module 10 - Section 1 Introduction: adaptation, mitigation & energy & climate...
 

Similar to Applications of Operations Research in Minimizing Emission related Externalities of Power Plants

Running head ENVIRONMENTAL IMPACT OF THE AVIATION INDUSTRY .docx
Running head ENVIRONMENTAL IMPACT OF THE AVIATION INDUSTRY       .docxRunning head ENVIRONMENTAL IMPACT OF THE AVIATION INDUSTRY       .docx
Running head ENVIRONMENTAL IMPACT OF THE AVIATION INDUSTRY .docxtodd271
 
Monday, November 30, 2015 at 449 PM Page 1User Zhijing.docx
Monday, November 30, 2015 at 449 PM   Page 1User Zhijing.docxMonday, November 30, 2015 at 449 PM   Page 1User Zhijing.docx
Monday, November 30, 2015 at 449 PM Page 1User Zhijing.docxmoirarandell
 
Environmental Impact Assessment (Eia)
Environmental Impact Assessment (Eia)Environmental Impact Assessment (Eia)
Environmental Impact Assessment (Eia)Melissa Dudas
 
Carbon Footprint Assessment of Textile Industry
Carbon Footprint Assessment of Textile IndustryCarbon Footprint Assessment of Textile Industry
Carbon Footprint Assessment of Textile IndustryIRJET Journal
 
Navigating the World of Carbon Credits Strategies for Emissions Reduction and...
Navigating the World of Carbon Credits Strategies for Emissions Reduction and...Navigating the World of Carbon Credits Strategies for Emissions Reduction and...
Navigating the World of Carbon Credits Strategies for Emissions Reduction and...ijtsrd
 
Environmental Security Of The Mongolian Economy
Environmental Security Of The Mongolian EconomyEnvironmental Security Of The Mongolian Economy
Environmental Security Of The Mongolian EconomyKimberly Brooks
 
SIMULATION OF ATMOSPHERIC POLLUTANTS DISPERSION IN AN URBAN ENVIRONMENT
SIMULATION OF ATMOSPHERIC POLLUTANTS DISPERSION IN AN URBAN ENVIRONMENTSIMULATION OF ATMOSPHERIC POLLUTANTS DISPERSION IN AN URBAN ENVIRONMENT
SIMULATION OF ATMOSPHERIC POLLUTANTS DISPERSION IN AN URBAN ENVIRONMENTAM Publications
 
The impact of environmental accounting and reporting on sustainable developme...
The impact of environmental accounting and reporting on sustainable developme...The impact of environmental accounting and reporting on sustainable developme...
The impact of environmental accounting and reporting on sustainable developme...Alexander Decker
 
Green Technology
Green TechnologyGreen Technology
Green Technologyijtsrd
 
Anti-Pollution Innovation Strengths Indicators Based On US Patents
Anti-Pollution Innovation Strengths Indicators Based On US PatentsAnti-Pollution Innovation Strengths Indicators Based On US Patents
Anti-Pollution Innovation Strengths Indicators Based On US PatentsSandra Long
 
Traffic and Health
Traffic and HealthTraffic and Health
Traffic and HealthBill Pugsley
 
Environment Sustainability in the Age of Digital Revolution: A Review of the ...
Environment Sustainability in the Age of Digital Revolution: A Review of the ...Environment Sustainability in the Age of Digital Revolution: A Review of the ...
Environment Sustainability in the Age of Digital Revolution: A Review of the ...Arab Federation for Digital Economy
 
Fyp presentation
Fyp presentationFyp presentation
Fyp presentationAliKhan1127
 
Sustainabiity_Article_write_up
Sustainabiity_Article_write_upSustainabiity_Article_write_up
Sustainabiity_Article_write_upAnindita Moitra
 
An analysis of environmental impacts of various environmental aspects for ind...
An analysis of environmental impacts of various environmental aspects for ind...An analysis of environmental impacts of various environmental aspects for ind...
An analysis of environmental impacts of various environmental aspects for ind...eSAT Journals
 
An analysis of environmental impacts of various environmental aspects for ind...
An analysis of environmental impacts of various environmental aspects for ind...An analysis of environmental impacts of various environmental aspects for ind...
An analysis of environmental impacts of various environmental aspects for ind...eSAT Publishing House
 
Assessment of the Spatial Compliance and Negligence of Environmental Laws on ...
Assessment of the Spatial Compliance and Negligence of Environmental Laws on ...Assessment of the Spatial Compliance and Negligence of Environmental Laws on ...
Assessment of the Spatial Compliance and Negligence of Environmental Laws on ...AJSERJournal
 

Similar to Applications of Operations Research in Minimizing Emission related Externalities of Power Plants (20)

Running head ENVIRONMENTAL IMPACT OF THE AVIATION INDUSTRY .docx
Running head ENVIRONMENTAL IMPACT OF THE AVIATION INDUSTRY       .docxRunning head ENVIRONMENTAL IMPACT OF THE AVIATION INDUSTRY       .docx
Running head ENVIRONMENTAL IMPACT OF THE AVIATION INDUSTRY .docx
 
Monday, November 30, 2015 at 449 PM Page 1User Zhijing.docx
Monday, November 30, 2015 at 449 PM   Page 1User Zhijing.docxMonday, November 30, 2015 at 449 PM   Page 1User Zhijing.docx
Monday, November 30, 2015 at 449 PM Page 1User Zhijing.docx
 
Environmental Impact Assessment (Eia)
Environmental Impact Assessment (Eia)Environmental Impact Assessment (Eia)
Environmental Impact Assessment (Eia)
 
Hypothesis
HypothesisHypothesis
Hypothesis
 
Carbon Footprint Assessment of Textile Industry
Carbon Footprint Assessment of Textile IndustryCarbon Footprint Assessment of Textile Industry
Carbon Footprint Assessment of Textile Industry
 
Navigating the World of Carbon Credits Strategies for Emissions Reduction and...
Navigating the World of Carbon Credits Strategies for Emissions Reduction and...Navigating the World of Carbon Credits Strategies for Emissions Reduction and...
Navigating the World of Carbon Credits Strategies for Emissions Reduction and...
 
Environmental Security Of The Mongolian Economy
Environmental Security Of The Mongolian EconomyEnvironmental Security Of The Mongolian Economy
Environmental Security Of The Mongolian Economy
 
SIMULATION OF ATMOSPHERIC POLLUTANTS DISPERSION IN AN URBAN ENVIRONMENT
SIMULATION OF ATMOSPHERIC POLLUTANTS DISPERSION IN AN URBAN ENVIRONMENTSIMULATION OF ATMOSPHERIC POLLUTANTS DISPERSION IN AN URBAN ENVIRONMENT
SIMULATION OF ATMOSPHERIC POLLUTANTS DISPERSION IN AN URBAN ENVIRONMENT
 
The impact of environmental accounting and reporting on sustainable developme...
The impact of environmental accounting and reporting on sustainable developme...The impact of environmental accounting and reporting on sustainable developme...
The impact of environmental accounting and reporting on sustainable developme...
 
Green Technology
Green TechnologyGreen Technology
Green Technology
 
Anti-Pollution Innovation Strengths Indicators Based On US Patents
Anti-Pollution Innovation Strengths Indicators Based On US PatentsAnti-Pollution Innovation Strengths Indicators Based On US Patents
Anti-Pollution Innovation Strengths Indicators Based On US Patents
 
Traffic and Health
Traffic and HealthTraffic and Health
Traffic and Health
 
Inter exp
Inter expInter exp
Inter exp
 
616
616616
616
 
Environment Sustainability in the Age of Digital Revolution: A Review of the ...
Environment Sustainability in the Age of Digital Revolution: A Review of the ...Environment Sustainability in the Age of Digital Revolution: A Review of the ...
Environment Sustainability in the Age of Digital Revolution: A Review of the ...
 
Fyp presentation
Fyp presentationFyp presentation
Fyp presentation
 
Sustainabiity_Article_write_up
Sustainabiity_Article_write_upSustainabiity_Article_write_up
Sustainabiity_Article_write_up
 
An analysis of environmental impacts of various environmental aspects for ind...
An analysis of environmental impacts of various environmental aspects for ind...An analysis of environmental impacts of various environmental aspects for ind...
An analysis of environmental impacts of various environmental aspects for ind...
 
An analysis of environmental impacts of various environmental aspects for ind...
An analysis of environmental impacts of various environmental aspects for ind...An analysis of environmental impacts of various environmental aspects for ind...
An analysis of environmental impacts of various environmental aspects for ind...
 
Assessment of the Spatial Compliance and Negligence of Environmental Laws on ...
Assessment of the Spatial Compliance and Negligence of Environmental Laws on ...Assessment of the Spatial Compliance and Negligence of Environmental Laws on ...
Assessment of the Spatial Compliance and Negligence of Environmental Laws on ...
 

More from IJSRED

IJSRED-V3I6P13
IJSRED-V3I6P13IJSRED-V3I6P13
IJSRED-V3I6P13IJSRED
 
School Bus Tracking and Security System
School Bus Tracking and Security SystemSchool Bus Tracking and Security System
School Bus Tracking and Security SystemIJSRED
 
BigBasket encashing the Demonetisation: A big opportunity
BigBasket encashing the Demonetisation: A big opportunityBigBasket encashing the Demonetisation: A big opportunity
BigBasket encashing the Demonetisation: A big opportunityIJSRED
 
Quantitative and Qualitative Analysis of Plant Leaf Disease
Quantitative and Qualitative Analysis of Plant Leaf DiseaseQuantitative and Qualitative Analysis of Plant Leaf Disease
Quantitative and Qualitative Analysis of Plant Leaf DiseaseIJSRED
 
DC Fast Charger and Battery Management System for Electric Vehicles
DC Fast Charger and Battery Management System for Electric VehiclesDC Fast Charger and Battery Management System for Electric Vehicles
DC Fast Charger and Battery Management System for Electric VehiclesIJSRED
 
Growth Path Followed by France
Growth Path Followed by FranceGrowth Path Followed by France
Growth Path Followed by FranceIJSRED
 
Acquisition System
Acquisition SystemAcquisition System
Acquisition SystemIJSRED
 
Parallelization of Graceful Labeling Using Open MP
Parallelization of Graceful Labeling Using Open MPParallelization of Graceful Labeling Using Open MP
Parallelization of Graceful Labeling Using Open MPIJSRED
 
Study of Phenotypic Plasticity of Fruits of Luffa Acutangula Var. Amara
Study of Phenotypic Plasticity of  Fruits of Luffa Acutangula Var. AmaraStudy of Phenotypic Plasticity of  Fruits of Luffa Acutangula Var. Amara
Study of Phenotypic Plasticity of Fruits of Luffa Acutangula Var. AmaraIJSRED
 
Understanding Architecture of Internet of Things
Understanding Architecture of Internet of ThingsUnderstanding Architecture of Internet of Things
Understanding Architecture of Internet of ThingsIJSRED
 
Smart shopping cart
Smart shopping cartSmart shopping cart
Smart shopping cartIJSRED
 
An Emperical Study of Learning How Soft Skills is Essential for Management St...
An Emperical Study of Learning How Soft Skills is Essential for Management St...An Emperical Study of Learning How Soft Skills is Essential for Management St...
An Emperical Study of Learning How Soft Skills is Essential for Management St...IJSRED
 
Smart Canteen Management
Smart Canteen ManagementSmart Canteen Management
Smart Canteen ManagementIJSRED
 
Gandhian trusteeship and Economic Ethics
Gandhian trusteeship and Economic EthicsGandhian trusteeship and Economic Ethics
Gandhian trusteeship and Economic EthicsIJSRED
 
Impacts of a New Spatial Variable on a Black Hole Metric Solution
Impacts of a New Spatial Variable on a Black Hole Metric SolutionImpacts of a New Spatial Variable on a Black Hole Metric Solution
Impacts of a New Spatial Variable on a Black Hole Metric SolutionIJSRED
 
A Study to Assess the Effectiveness of Planned Teaching Programme on Knowledg...
A Study to Assess the Effectiveness of Planned Teaching Programme on Knowledg...A Study to Assess the Effectiveness of Planned Teaching Programme on Knowledg...
A Study to Assess the Effectiveness of Planned Teaching Programme on Knowledg...IJSRED
 
Inginious Trafalgar Contrivition System
Inginious Trafalgar Contrivition SystemInginious Trafalgar Contrivition System
Inginious Trafalgar Contrivition SystemIJSRED
 
Farmer's Analytical assistant
Farmer's Analytical assistantFarmer's Analytical assistant
Farmer's Analytical assistantIJSRED
 
Functions of Forensic Engineering Investigator in India
Functions of Forensic Engineering Investigator in IndiaFunctions of Forensic Engineering Investigator in India
Functions of Forensic Engineering Investigator in IndiaIJSRED
 
Participation Politique Feminine En Competition Électorale Au Congo-Kinshasa....
Participation Politique Feminine En Competition Électorale Au Congo-Kinshasa....Participation Politique Feminine En Competition Électorale Au Congo-Kinshasa....
Participation Politique Feminine En Competition Électorale Au Congo-Kinshasa....IJSRED
 

More from IJSRED (20)

IJSRED-V3I6P13
IJSRED-V3I6P13IJSRED-V3I6P13
IJSRED-V3I6P13
 
School Bus Tracking and Security System
School Bus Tracking and Security SystemSchool Bus Tracking and Security System
School Bus Tracking and Security System
 
BigBasket encashing the Demonetisation: A big opportunity
BigBasket encashing the Demonetisation: A big opportunityBigBasket encashing the Demonetisation: A big opportunity
BigBasket encashing the Demonetisation: A big opportunity
 
Quantitative and Qualitative Analysis of Plant Leaf Disease
Quantitative and Qualitative Analysis of Plant Leaf DiseaseQuantitative and Qualitative Analysis of Plant Leaf Disease
Quantitative and Qualitative Analysis of Plant Leaf Disease
 
DC Fast Charger and Battery Management System for Electric Vehicles
DC Fast Charger and Battery Management System for Electric VehiclesDC Fast Charger and Battery Management System for Electric Vehicles
DC Fast Charger and Battery Management System for Electric Vehicles
 
Growth Path Followed by France
Growth Path Followed by FranceGrowth Path Followed by France
Growth Path Followed by France
 
Acquisition System
Acquisition SystemAcquisition System
Acquisition System
 
Parallelization of Graceful Labeling Using Open MP
Parallelization of Graceful Labeling Using Open MPParallelization of Graceful Labeling Using Open MP
Parallelization of Graceful Labeling Using Open MP
 
Study of Phenotypic Plasticity of Fruits of Luffa Acutangula Var. Amara
Study of Phenotypic Plasticity of  Fruits of Luffa Acutangula Var. AmaraStudy of Phenotypic Plasticity of  Fruits of Luffa Acutangula Var. Amara
Study of Phenotypic Plasticity of Fruits of Luffa Acutangula Var. Amara
 
Understanding Architecture of Internet of Things
Understanding Architecture of Internet of ThingsUnderstanding Architecture of Internet of Things
Understanding Architecture of Internet of Things
 
Smart shopping cart
Smart shopping cartSmart shopping cart
Smart shopping cart
 
An Emperical Study of Learning How Soft Skills is Essential for Management St...
An Emperical Study of Learning How Soft Skills is Essential for Management St...An Emperical Study of Learning How Soft Skills is Essential for Management St...
An Emperical Study of Learning How Soft Skills is Essential for Management St...
 
Smart Canteen Management
Smart Canteen ManagementSmart Canteen Management
Smart Canteen Management
 
Gandhian trusteeship and Economic Ethics
Gandhian trusteeship and Economic EthicsGandhian trusteeship and Economic Ethics
Gandhian trusteeship and Economic Ethics
 
Impacts of a New Spatial Variable on a Black Hole Metric Solution
Impacts of a New Spatial Variable on a Black Hole Metric SolutionImpacts of a New Spatial Variable on a Black Hole Metric Solution
Impacts of a New Spatial Variable on a Black Hole Metric Solution
 
A Study to Assess the Effectiveness of Planned Teaching Programme on Knowledg...
A Study to Assess the Effectiveness of Planned Teaching Programme on Knowledg...A Study to Assess the Effectiveness of Planned Teaching Programme on Knowledg...
A Study to Assess the Effectiveness of Planned Teaching Programme on Knowledg...
 
Inginious Trafalgar Contrivition System
Inginious Trafalgar Contrivition SystemInginious Trafalgar Contrivition System
Inginious Trafalgar Contrivition System
 
Farmer's Analytical assistant
Farmer's Analytical assistantFarmer's Analytical assistant
Farmer's Analytical assistant
 
Functions of Forensic Engineering Investigator in India
Functions of Forensic Engineering Investigator in IndiaFunctions of Forensic Engineering Investigator in India
Functions of Forensic Engineering Investigator in India
 
Participation Politique Feminine En Competition Électorale Au Congo-Kinshasa....
Participation Politique Feminine En Competition Électorale Au Congo-Kinshasa....Participation Politique Feminine En Competition Électorale Au Congo-Kinshasa....
Participation Politique Feminine En Competition Électorale Au Congo-Kinshasa....
 

Recently uploaded

HARMONY IN THE NATURE AND EXISTENCE - Unit-IV
HARMONY IN THE NATURE AND EXISTENCE - Unit-IVHARMONY IN THE NATURE AND EXISTENCE - Unit-IV
HARMONY IN THE NATURE AND EXISTENCE - Unit-IVRajaP95
 
Introduction to Microprocesso programming and interfacing.pptx
Introduction to Microprocesso programming and interfacing.pptxIntroduction to Microprocesso programming and interfacing.pptx
Introduction to Microprocesso programming and interfacing.pptxvipinkmenon1
 
Biology for Computer Engineers Course Handout.pptx
Biology for Computer Engineers Course Handout.pptxBiology for Computer Engineers Course Handout.pptx
Biology for Computer Engineers Course Handout.pptxDeepakSakkari2
 
VIP Call Girls Service Kondapur Hyderabad Call +91-8250192130
VIP Call Girls Service Kondapur Hyderabad Call +91-8250192130VIP Call Girls Service Kondapur Hyderabad Call +91-8250192130
VIP Call Girls Service Kondapur Hyderabad Call +91-8250192130Suhani Kapoor
 
GDSC ASEB Gen AI study jams presentation
GDSC ASEB Gen AI study jams presentationGDSC ASEB Gen AI study jams presentation
GDSC ASEB Gen AI study jams presentationGDSCAESB
 
CCS355 Neural Network & Deep Learning UNIT III notes and Question bank .pdf
CCS355 Neural Network & Deep Learning UNIT III notes and Question bank .pdfCCS355 Neural Network & Deep Learning UNIT III notes and Question bank .pdf
CCS355 Neural Network & Deep Learning UNIT III notes and Question bank .pdfAsst.prof M.Gokilavani
 
APPLICATIONS-AC/DC DRIVES-OPERATING CHARACTERISTICS
APPLICATIONS-AC/DC DRIVES-OPERATING CHARACTERISTICSAPPLICATIONS-AC/DC DRIVES-OPERATING CHARACTERISTICS
APPLICATIONS-AC/DC DRIVES-OPERATING CHARACTERISTICSKurinjimalarL3
 
Decoding Kotlin - Your guide to solving the mysterious in Kotlin.pptx
Decoding Kotlin - Your guide to solving the mysterious in Kotlin.pptxDecoding Kotlin - Your guide to solving the mysterious in Kotlin.pptx
Decoding Kotlin - Your guide to solving the mysterious in Kotlin.pptxJoão Esperancinha
 
Microscopic Analysis of Ceramic Materials.pptx
Microscopic Analysis of Ceramic Materials.pptxMicroscopic Analysis of Ceramic Materials.pptx
Microscopic Analysis of Ceramic Materials.pptxpurnimasatapathy1234
 
Sachpazis Costas: Geotechnical Engineering: A student's Perspective Introduction
Sachpazis Costas: Geotechnical Engineering: A student's Perspective IntroductionSachpazis Costas: Geotechnical Engineering: A student's Perspective Introduction
Sachpazis Costas: Geotechnical Engineering: A student's Perspective IntroductionDr.Costas Sachpazis
 
Software and Systems Engineering Standards: Verification and Validation of Sy...
Software and Systems Engineering Standards: Verification and Validation of Sy...Software and Systems Engineering Standards: Verification and Validation of Sy...
Software and Systems Engineering Standards: Verification and Validation of Sy...VICTOR MAESTRE RAMIREZ
 
Past, Present and Future of Generative AI
Past, Present and Future of Generative AIPast, Present and Future of Generative AI
Past, Present and Future of Generative AIabhishek36461
 
Internship report on mechanical engineering
Internship report on mechanical engineeringInternship report on mechanical engineering
Internship report on mechanical engineeringmalavadedarshan25
 
Model Call Girl in Narela Delhi reach out to us at 🔝8264348440🔝
Model Call Girl in Narela Delhi reach out to us at 🔝8264348440🔝Model Call Girl in Narela Delhi reach out to us at 🔝8264348440🔝
Model Call Girl in Narela Delhi reach out to us at 🔝8264348440🔝soniya singh
 
Sheet Pile Wall Design and Construction: A Practical Guide for Civil Engineer...
Sheet Pile Wall Design and Construction: A Practical Guide for Civil Engineer...Sheet Pile Wall Design and Construction: A Practical Guide for Civil Engineer...
Sheet Pile Wall Design and Construction: A Practical Guide for Civil Engineer...Dr.Costas Sachpazis
 
High Profile Call Girls Nagpur Isha Call 7001035870 Meet With Nagpur Escorts
High Profile Call Girls Nagpur Isha Call 7001035870 Meet With Nagpur EscortsHigh Profile Call Girls Nagpur Isha Call 7001035870 Meet With Nagpur Escorts
High Profile Call Girls Nagpur Isha Call 7001035870 Meet With Nagpur Escortsranjana rawat
 
Artificial-Intelligence-in-Electronics (K).pptx
Artificial-Intelligence-in-Electronics (K).pptxArtificial-Intelligence-in-Electronics (K).pptx
Artificial-Intelligence-in-Electronics (K).pptxbritheesh05
 
chaitra-1.pptx fake news detection using machine learning
chaitra-1.pptx  fake news detection using machine learningchaitra-1.pptx  fake news detection using machine learning
chaitra-1.pptx fake news detection using machine learningmisbanausheenparvam
 

Recently uploaded (20)

HARMONY IN THE NATURE AND EXISTENCE - Unit-IV
HARMONY IN THE NATURE AND EXISTENCE - Unit-IVHARMONY IN THE NATURE AND EXISTENCE - Unit-IV
HARMONY IN THE NATURE AND EXISTENCE - Unit-IV
 
Introduction to Microprocesso programming and interfacing.pptx
Introduction to Microprocesso programming and interfacing.pptxIntroduction to Microprocesso programming and interfacing.pptx
Introduction to Microprocesso programming and interfacing.pptx
 
Biology for Computer Engineers Course Handout.pptx
Biology for Computer Engineers Course Handout.pptxBiology for Computer Engineers Course Handout.pptx
Biology for Computer Engineers Course Handout.pptx
 
★ CALL US 9953330565 ( HOT Young Call Girls In Badarpur delhi NCR
★ CALL US 9953330565 ( HOT Young Call Girls In Badarpur delhi NCR★ CALL US 9953330565 ( HOT Young Call Girls In Badarpur delhi NCR
★ CALL US 9953330565 ( HOT Young Call Girls In Badarpur delhi NCR
 
VIP Call Girls Service Kondapur Hyderabad Call +91-8250192130
VIP Call Girls Service Kondapur Hyderabad Call +91-8250192130VIP Call Girls Service Kondapur Hyderabad Call +91-8250192130
VIP Call Girls Service Kondapur Hyderabad Call +91-8250192130
 
GDSC ASEB Gen AI study jams presentation
GDSC ASEB Gen AI study jams presentationGDSC ASEB Gen AI study jams presentation
GDSC ASEB Gen AI study jams presentation
 
CCS355 Neural Network & Deep Learning UNIT III notes and Question bank .pdf
CCS355 Neural Network & Deep Learning UNIT III notes and Question bank .pdfCCS355 Neural Network & Deep Learning UNIT III notes and Question bank .pdf
CCS355 Neural Network & Deep Learning UNIT III notes and Question bank .pdf
 
APPLICATIONS-AC/DC DRIVES-OPERATING CHARACTERISTICS
APPLICATIONS-AC/DC DRIVES-OPERATING CHARACTERISTICSAPPLICATIONS-AC/DC DRIVES-OPERATING CHARACTERISTICS
APPLICATIONS-AC/DC DRIVES-OPERATING CHARACTERISTICS
 
Decoding Kotlin - Your guide to solving the mysterious in Kotlin.pptx
Decoding Kotlin - Your guide to solving the mysterious in Kotlin.pptxDecoding Kotlin - Your guide to solving the mysterious in Kotlin.pptx
Decoding Kotlin - Your guide to solving the mysterious in Kotlin.pptx
 
Microscopic Analysis of Ceramic Materials.pptx
Microscopic Analysis of Ceramic Materials.pptxMicroscopic Analysis of Ceramic Materials.pptx
Microscopic Analysis of Ceramic Materials.pptx
 
Sachpazis Costas: Geotechnical Engineering: A student's Perspective Introduction
Sachpazis Costas: Geotechnical Engineering: A student's Perspective IntroductionSachpazis Costas: Geotechnical Engineering: A student's Perspective Introduction
Sachpazis Costas: Geotechnical Engineering: A student's Perspective Introduction
 
young call girls in Rajiv Chowk🔝 9953056974 🔝 Delhi escort Service
young call girls in Rajiv Chowk🔝 9953056974 🔝 Delhi escort Serviceyoung call girls in Rajiv Chowk🔝 9953056974 🔝 Delhi escort Service
young call girls in Rajiv Chowk🔝 9953056974 🔝 Delhi escort Service
 
Software and Systems Engineering Standards: Verification and Validation of Sy...
Software and Systems Engineering Standards: Verification and Validation of Sy...Software and Systems Engineering Standards: Verification and Validation of Sy...
Software and Systems Engineering Standards: Verification and Validation of Sy...
 
Past, Present and Future of Generative AI
Past, Present and Future of Generative AIPast, Present and Future of Generative AI
Past, Present and Future of Generative AI
 
Internship report on mechanical engineering
Internship report on mechanical engineeringInternship report on mechanical engineering
Internship report on mechanical engineering
 
Model Call Girl in Narela Delhi reach out to us at 🔝8264348440🔝
Model Call Girl in Narela Delhi reach out to us at 🔝8264348440🔝Model Call Girl in Narela Delhi reach out to us at 🔝8264348440🔝
Model Call Girl in Narela Delhi reach out to us at 🔝8264348440🔝
 
Sheet Pile Wall Design and Construction: A Practical Guide for Civil Engineer...
Sheet Pile Wall Design and Construction: A Practical Guide for Civil Engineer...Sheet Pile Wall Design and Construction: A Practical Guide for Civil Engineer...
Sheet Pile Wall Design and Construction: A Practical Guide for Civil Engineer...
 
High Profile Call Girls Nagpur Isha Call 7001035870 Meet With Nagpur Escorts
High Profile Call Girls Nagpur Isha Call 7001035870 Meet With Nagpur EscortsHigh Profile Call Girls Nagpur Isha Call 7001035870 Meet With Nagpur Escorts
High Profile Call Girls Nagpur Isha Call 7001035870 Meet With Nagpur Escorts
 
Artificial-Intelligence-in-Electronics (K).pptx
Artificial-Intelligence-in-Electronics (K).pptxArtificial-Intelligence-in-Electronics (K).pptx
Artificial-Intelligence-in-Electronics (K).pptx
 
chaitra-1.pptx fake news detection using machine learning
chaitra-1.pptx  fake news detection using machine learningchaitra-1.pptx  fake news detection using machine learning
chaitra-1.pptx fake news detection using machine learning
 

Applications of Operations Research in Minimizing Emission related Externalities of Power Plants

  • 1. International Journal of Scientific Research and Engineering Development-– Volume X Issue X, Year Available at www.ijsred.com ISSN : 2581-7175 ©IJSRED: All Rights are Reserved Page 1 Applications of Operations Research in Minimizing Emission related Externalities of Power Plants Pratik Doshi*, Nuti Thakkar**, Pranav Kapoor`, Pranav Thawani``, Prakhar Pandey``` *( *(Student at NMIMS University, VL Mehta Road, Vile Parle, Mumbai Email: pratikdoshi99@gmail.com) ** (Student at NMIMS University, VL Mehta Road, Vile Parle, Mumbai Email: nutithakkar1259@gmail.com) `(Student at NMIMS University, VL Mehta Road, Vile Parle, Mumbai Email: pranav413k@gmail.com) ``(Student at NMIMS University, VL Mehta Road, Vile Parle, Mumbai Email: pranavthawani@gmail.com) ```(Student at NMIMS University, VL Mehta Road, Vile Parle, Mumbai Email: prakharpandey8@gmail.com) ----------------------------------------************************---------------------------------- Abstract: Power generation is a leading contributor to air quality deterioration. This has led to the emergence of basic air quality benchmarks that are supposed to be upheld by power companies. While these decisions are taken keeping the health of the broad environment in mind, little is done to reduce or compensate for the damage caused in the regions surrounding power plants. This research employs pollution measurement models and combines them with Operations Research techniques to come up with solutions that make lives easier for people living around power plants. Keywords —Plume Dispersion, Optimizing Power Plant Locations, Minimizing Pollution Concentration, Improving Health Standards, Simulation Techniques.. ----------------------------------------************************---------------------------------- I. INTRODUCTION “Recent years have witnessed growing concerns about the harmful ramifications of industrial development and urbanization in the form of climate change and global warming (Rohit Nishant, 2012). The findings of the International Panel on Climate Change (IPCC), a body formed by the United Nations (UN), suggest that greenhouse gases (GHGs) are responsible for global warming(National Geographic, 2019). A major source of the GHGs emissions is caused by industrial operations. The increasing cognizance of adverse environmental impact has resulted in organizational efforts targeted at reducing harmful environmental impact. A recent industry report indicates that IT infrastructure such as data centres contributes to 2% of the annual GHGs emissions (Computerworld, 2007) . This has resulted in the emergence of green IT as a significant component of a broad stream of initiatives focused on improving environmental performance of organizations. The last three decades have seen a stream of research on the impact of environmental performance and regulations on an organization’s financial RESEARCH ARTICLE OPEN ACCESS
  • 2. International Journal of Scientific Research and Engineering Development-– Volume X Issue X, Year Available at www.ijsred.com ISSN : 2581-7175 ©IJSRED: All Rights are Reserved Page 2 performance. There have been two distinct views on the possible direction of the relationship between environmental performance and organizational performance. The underlying argument is that the drive towards better environmental performance would be achieved by organizational research and operations towards cutting down on emissions. One of the important components of the environmental performance of organizations is GHG emissions, which refers to discharge of gases such as carbon dioxide (CO2), methane (CH4), nitrous oxide (N2O) and fluorinated gases. These gases trap heat in the atmosphere and thus contribute to global warming and climate change. The GHG emissions are measured and tracked using a protocol developed by the World Resources Institute (WRI) and the World Business Council for Sustainable Development (WBCSD) (The Greenhouse Gas Protocol Initiative 2011). The emergence of environmental problems on global forums have led to the development of the concept of Emissions Trading. Given the externalities associated with emissions, every company is allocated limited emission rights. These rights cap the emissions by the operations of individual companies. Companies who have unused rights can sell them to those who have exhausted their rights. This provides a financial incentive for companies to minimize their emissions.” 1 Various studies like (Tim Laing, 2013) and (Xiting Gong, 2013) have been conducted to assess the financial, business and environmental implications of emissions trading and carbon tax. 1 Content in quotes referred from (Rohit Nishant, 2012) 2 Content Referred from (The Guardian, n.d.), (Glick, n.d.), (NASA Earth Observatory, n.d.) and (Wikipedia, n.d.) II. OPERATIONS RESEARCH Operations Research Techniques have played a major role in optimizing operations. This area of study has helped in developing strategies that save time, money and energy. It has applications in industries such as airlines, manufacturing, services, military and government. Some business applications of operations research include market strategy planning, capital budgeting with the help of Linear Programming (LP), manpower assignment, machine assignment and space allocation with the help of Assignment and Transportation Models. (Javadi, 2011) published his findings on how principles of operations research were being applied in schools and academic institutions. (Rodolfo C. Salazar, 1968) used simulations and stochastic linear programming to compute expected returns from portfolios of projects. Operations Research Techniques such as simulation models have been particularly useful in reducing emissions and making key decisions whose ultimate result is reduced environmental damage. Works such as (Najam Khan, 2019) have dived deep into software based simulation that is aimed at minimizing coal transportation cost and electricity transmission loss while keeping emissions under regulatory standards. Other work in the areas of energy and environment that have taken a quantitative approach include (Dang Gu Chai, 2017). III. OVERVIEW2 Through the course of time, pollution has imperceptibly become one of the most hazardous threats to the environment. As a result of negligence towards strict regulations there has been a
  • 3. International Journal of Scientific Research and Engineering Development-– Volume X Issue X, Year Available at www.ijsred.com ISSN : 2581-7175 ©IJSRED: All Rights are Reserved Page 3 detrimental impact on the environment. Around 700,000 premature deaths are caused due to toxic emissions. To minimize the increasing impact there have been multiple interventions in recent years by many organizations/governments. In the timeline of these interventions there are certain junctures which have been important for the safeguarding of the environmental condition. Some examples of these are the Paris Convention, the United Nations Framework Convention on Climate Change, the Biological Diversity Convention and some local movements such as the Chipko movement. These movements have resulted in strict regulations and colossal punishments for disregarding them. Various studies have been conducted to study the implications of countries individual emissions on a global level. (Welsh, 1990) published the implications of cross border air pollution in Western Europe while keeping the cost element in min. There has been an average implementation of 100 new laws every year since 2009. Some of these rules include legal limits on emission of greenhouse gasses and pollutants and prohibition of use of environmentally toxic materials (Eg: recent ban on one time use plastic). In view of the future trajectory of each country’s emission there have also been POAs (plans of action) allocated to each country; These movements have formed POAs to keep annual global warming well under 2 °C. This has been done to provide a guideline for countries to try and maintain coherence between the actual emissions and the predicted emissions. Although there have been multiple treaties, conventions and other plans the global temperature has been constantly rising by approximately 0.2 degrees Celsius every decade. Emission of particulate matter 2.5 (emissions of compounds which are a concern for human health) has increased over time in various countries. As a result of the global warming, glaciers decrease in a volume of 1.07 × 10⁶ km² every year; The Kilimanjaro has melted over 80% (Glick, n.d.) and parts of the Himalayas could disappear by 2035. The warming and melting has also heightened the sea by around 19cm and harmed a lot of animal life. Non-compliant countries are having a huge impact on the environment and global warming records have been periodic and constant; Though the punishments are strict it will be a hard task to prevent global warming to increase global temperatures from 1.5°C to 2°C. With increase in Global Warming caused due to emissions leading to stronger and frequent storms, draughts and increased sea level, it became imperative to find a solution leading to the invent of Renewable Energy. The wide increase in renewable energy - Solar Power, Wind Power, Hydro Power, Ocean Energy, Geothermal Energy, Solar Thermal Heating and Cooling and Biofuels; it has reduced greenhouse gas as well as dust emission. It decreases emission by 81%. Not only that but models like Energy and R&D Roadmaps and System like Prospective outlook on Long Term Energy have helped minimise emission and stimulate and analyse the economic perspective of world’s energy sector.
  • 4. International Journal of Scientific Research and Engineering Development-– Volume X Issue X, Year Available at www.ijsred.com ISSN : 2581-7175 ©IJSRED: All Rights are Reserved Page 4 Source: (NASA Earth Observatory, n.d.) The figure above sheds light on the historical temperature anomalies as calculated by different research bodies. This can largely be attributed to increasing emission levels across the globe. The primary composition of these emissions is CO2, SO2, NOx, Particulate Matter and varying amounts of toxic metals lead and mercury. Extensive research on the environmental and economic damage caused by emissions has been conducted earlier and their conclusions are exhibited in (Kenneth Gillingham, 2018). IV. RESEARCH OBJECTIVES The objective of this paper is to study existing literature on Pollutant Dispersion and Pollutant Exposure Minimizing Techniques and recommend models that can optimize pollutant exposure using constraints not used earlier (Example: Population density of surrounding region) . The ultimate goal of the study is to make these models flexible to facilitate easy integration of different pollutant concentration models. V. METHODOLOGY Work done by (Najam Khan, 2019) adopted a unique approach of using computer simulations to solve the complex problem of optimising cost while meeting environmental emission standards for power plants. The approach adopted in their research serves as inspiration for this research paper. The model proposed in this paper suggests that an existing Plume Dispersion Model be used to calculate a statistic that can represent the emission related externality associated with setting up a power plant at all possible locations on a 2-D plane surface and optimizing the location of the power plant to minimize the associated externalities. The model also proposes that the population of the habitation areas be taken into account to correctly estimate the associated externality. VI. LITERATURE REVIEW This study employees the Gaussian Plume dispersion Model to calculate the concentration of pollutants at
  • 5. International Journal of Scientific Research and Engineering Development-– Volume X Issue X, Year Available at www.ijsred.com ISSN : 2581-7175 ©IJSRED: All Rights are Reserved Page 5 a particular location from the power plant. Numerous other equations have been developed that help in similar calculations under various conditions. “Models like the METI LIS (A. Kouchi, 2004) and AIST-ADMER were developed in Japan to study industrial emissions. The National Institute of Advanced Industrial Science and technology developed the AIST-ADMER model that takes into account metrological data and emission specific characteristics to estimate the chemical concentration of emissions in a particular area. The METI LIS model was developed by the Japanese Ministry of Economy, Trade and Industry to study emissions under various environmental conditions. It was used to calculate emissions using in Vietnam (Nguyen Huu Huan, 2012). (Razi, 2012) used the AIST-ADMER model to estimate regional concentration and distribution of mercury in the Honshu Island. Individual models to study individual gases were also developed.” 3 (Hicham Gourgue, 2015) developed models to study nitrous oxide compounds emitted from boilers. Apart from the models that try to estimate plume dispersion, several scholars have worked on equations that explain plume rise (Seema Awasthia, 2006). In this study, the effective height of the stack was taking into account. The effective height of the stack is a sum of the actual height of the chimney and the natural rise in the emitted gases when they are released. (F.W. Thomas, 1969) came up with the results of a study involving major electricity generation stations in England in 1963. Simulation has been used in earlier research to optimize costs (Zhijie Zhu, 2019). This area of study is a unique blend of science and operations research where the models are based on the principals of science while their optimization is 3 Referenced from (Najam Khan, 2019) achieved from principles of Operations research. Therefore the literature surrounding this field also seeks inspiration from both Scientists and Operations Researchers. VII. LOCATION OPTIMIZING MODEL As Stated earlier, the model proposed in this paper employs simulations. The volume of calculations arising out of computing the concentration of pollutants suggests that they be done through software. For the purpose of this paper, a suitable computer algorithm was developed whose results have been displayed. (Figures 1-4) Key Computations undertaken by the Algorithm: 1. Concentration of Pollutants: The concentration of pollution for every region is calculated using the Gaussian Plume Dispersion Model (Arya, 1999). C = 𝑄 𝜋.𝑢.𝜎 𝑦. 𝜎 𝑧 .ⅇ ( −𝐻2 2 (𝜎 𝑧)2) .ⅇ ( −𝑦2 2 (𝜎 𝑦) 2) Where ‘C’ is the concentration in ug/m3 , ‘Q’ is the rate of emission of pollutants from the plant in ug/sec, ‘u’ is the velocity of the wind in m/sec at the height where the pollutants are released in the air, sigma y is the horizontal dispersion of plume particles from the central line (absolute trajectory of plume), sigma z is vertical dispersion of plume particles from the central line, ‘H’ is the effective height of the stack (chimney) that is emitting the pollutants and ‘y’ is the Y coordinate of the region. The model calculates the pollution concentration at ground level for a location
  • 6. International Journal of Scientific Research and Engineering Development-– Volume X Issue X, Year Available at www.ijsred.com ISSN : 2581-7175 ©IJSRED: All Rights are Reserved Page 6 with X and Y coordinates on a plane. The coordinates of the location are expressed by aligning the x-axis with the trajectory of the prevalent wind. It should be noted that: • For every region, only the maximum concentration of pollutants (worst air quality) at ground level is taken into account. The concentration of pollutants is maximum when the region falls on the trajectory of the wind that is carrying the plume. Thus the variable ‘y’ is set to 0 during the calculations • The pollutant concentration is calculated at ground level. As a result, the variable ‘z’ which appears in the standard version of the equation is ignored above. ‘z’ represents the height of the point from the ground level (which in this case is 0) 2. Weighted Average Exposure (WAE): A weighted average (Investopedia, 2019) of the concentration of pollutants across surrounding areas of habitation, using the population of those areas as weights is used to represent the environmental externality associated with setting up a factory at a particular location. WAE = ∑ 𝑐 𝑖 . 𝑃 𝑖 𝛴 𝑃 𝑖 Where ‘C‘ is the maximum possible concentration of pollutants in region ‘i’ and ‘P’ is the population of that region. 3. Simulations: The Weighted Average Exposure (WAE) is calculated with reference to every point on the 2D plane where setting up a power plant is possible. The final step is to select the location of the power plant that has the minimum WAE. Application of the Model: Illustration Region The Simulation procedure is applied to a 10 km x 10 km plot of land which has 20 inhabited regions with varying population densities in each region. The area under consideration is at sea level, dry and largely devoid of any vegetation. This means there is no need for any deforestation and the only externality associated with setting up a power plant in this region is the resultant pollutant emissions. The 20 inhabited regions are randomly dispersed in the area. The environmental conditions are stable and there is little experience of winds at ground level. This is why the region does not experience dust storms in spite of low green cover in the area. The region is described keeping in mind the pre- requisites of using the Gaussian Plume Dispersion Model. As regions vary, the model may become less accurate. It is therefore recommended to modify the models when dealing with diverse environmental and climatic conditions.
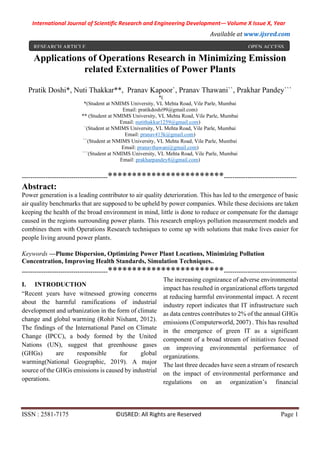
  • 7. International Journal of Scientific Research and Engineering Development-– Volume X Issue X, Year Available at www.ijsred.com ISSN : 2581-7175 ©IJSRED: All Rights are Reserved Page 7 Figure 1: 2-D Plane representation The region can be visualized with the help of the above map. The map highlights the randomly dispersed habitations (blue bubbles). The size of the bubble highlights the relative population density of that habitation as compared to the others. The area under consideration is only 10 km x 10 km. Power Plant The power plant is proposed to have a stack (chimney) height of approximately 100m and the maximum height the plume is expected to rise to is 150m. The average wind speed at the effective height of 150m is assumed to be 10m/sec. The boiler exhaust system will consist of only one blower that can effectively blow out plume at the rate of 500 g/sec. Pollution Concentration and the Weighted Average Exposure The weighted average exposure to pollutants is calculated for every possible point where the plant can be set up. The following figure shows the exposure to pollutants by all the inhabited regions when the plant is placed at the coordinates (2,2). -2 0 2 4 6 8 10 12 -2 0 2 4 6 8 10 12 2D Plane under Consideration (in km)
  • 8. International Journal of Scientific Research and Engineering Development-– Volume X Issue X, Year Available at www.ijsred.com ISSN : 2581-7175 ©IJSRED: All Rights are Reserved Page 8 Figure 2: Exposure due to power plant at (2,2) The power plant is marked by the small green circle. The bubbles represent the habitations and their relative size highlights the exposure to pollutants. In order to arrive at the Weighted Average Exposure (WAE), the average of the pollution concentration of the habited areas is taken, using their respective populations as weights. The WEA for the plant location (2,2) turns out to be 9.48 ug/m3 . The WEA for all the possible plant locations are calculated to estimate the location-wise impact of the power plant. It should be noted that there may be water bodies, highways, habitations and government reserved forests in the area under consideration. The location of such structures must be excluded from the simulation process as setting up a power plant is not possible in those areas. The simulation process itself operates on a degree of precision. It is possible to achieve a degree of precision to the last metre. The figure below summarizes the results of the simulation algorithm developed.
  • 9. International Journal of Scientific Research and Engineering Development-– Volume X Issue X, Year Available at www.ijsred.com ISSN : 2581-7175 ©IJSRED: All Rights are Reserved Page 9 Figure 3: Results of the simulation algorithm The precision on the algorithm was set to 1km to facilitate presentation of the results on a table. The WAE values in each cell are expressed in ug/m3 . The least WAE occurs in cell (0,0). This implies that setting up the power plant at that location will result in least externality. The empty cells represent the inhabited areas. They are left empty because it is not possible to place a power plant there. The optimum value is 4.087 ug/m3 . The table also makes it easy to analyse the externalities and allow the decision maker to select the second or third best location if the first is unavailable. Figure 4 depicts the scenario when the power plant is placed at (0,0), which is the optimal point. The size of the bubbles represent the degree of concentration of pollutants. The larger the bubbles, the greater is the exposure. It should be noted that there is a striking difference in the size of bubbles in Figure 2 and that in Figure 4. On an average, the bubbles are smaller in Figure 4, implying lower exposure levels on average in Figure 4.
  • 10. International Journal of Scientific Research and Engineering Development-– Volume X Issue X, Year Available at www.ijsred.com ISSN : 2581-7175 ©IJSRED: All Rights are Reserved Page 10 Figure 4: Exposure levels at optimized plant location VIII. GENERALIZATION OF THE MODEL The simulation procedure adopted in this study is flexible. Plume Dispersion Models come with their own set of assumptions and pre-requisites. One model cannot be used in all types of environments and geographies. However, it is possible to use this simulation procedure along with other Plume Dispersion Models. A generalized process to be followed while using a similar simulation procedure is summarized below. 1. Selecting the Plume Dispersion Model to calculate the concentration of pollutants at any given location relative to the location of the power plant. 2. Assigning values to the constants used in the calculation of pollutant concentration depending upon various environmental and territorial factors 3. Selecting a possible location where the plant can be set up. 4. Developing/Selecting a statistic that can be used to measure the externalities associated with setting up a power plant at that location. It should be noted that this statistic is the variable, whose minimization will ultimately determine the location of the power plant. It should be designed in a way, such that it fairly represents the pollutant concentration across all the nearby areas occurring by setting up the plant at that location (the one selected in step 3) 5. Calculating the value of the statistic for every possible location where the plant can be set- up. In other words, repeating step 2 and 3 for all possible locations. 6. Minimizing the statistic
  • 11. International Journal of Scientific Research and Engineering Development-– Volume X Issue X, Year Available at www.ijsred.com ISSN : 2581-7175 ©IJSRED: All Rights are Reserved Page 11 IX. CONCLUSION Pollutants in the environment due to emission externalities has been a huge problem and the major concern is to counter the confounded risk of emission externalities leading to affecting of public health as well as environmental damage. Here we tried various interventions to reduce greenhouse gases by finding an optimal location with the least WAE. The goal here was to minimise public exposure of harmful emissions. Using operational and emission perspectives we came to a conclusion for a best candidate location for the power plant. X. LIMITATIONS The study suffers from the limitations of correct model selection. There are a lot of models that explain Pollution dispersion under multiple conditions. Variables such as wind velocity, temperature of the atmosphere, temperature of the emitted gases, wind direction, rate of gaseous emission, humidity conditions, geographical terrain, vegetative cover and many others affect the concentration of pollutants. The sheer number of variables makes the models complex and sometimes less accurate. The Gaussian Plume distribution model cannot be applied to emissions which have high concentrations of gases that with other constituents of the atmosphere. There can be no decay, oxidation, combustion or any other process that chemically changes the properties of the plume. The occurrence of any of these reactions will result into inaccurate estimation of pollutant concentration through the Gaussian Dispersion model. Furthermore, the accuracy of the estimates reduces when there are a lot of barriers because a part of the particulate matter settles on surfaces of trees, buildings, mountains and even the ground. Occurrences of natural events like rainfall completely distorts the estimates. The chemical properties of the plume and its temperature during emissions determines how high it rises. This has a considerable impact on concentration estimate. Furthermore, the Gaussian Distribution model assumes that winds carry the plume. The model fails to estimate the impact of common gas dispersion under very low wind conditions. These limitations can however be overcome by careful selection of the model to calculate plume dispersion. The problems that arise out of conducting simulations is that they can never be done without a software. REFERENCES A. Kouchi, K. O. (2004). Development of a low-rise industrial source dispersion model (METI-LIS model). International Journal of Environment and Pollution, 325-338. Arya, S. P. (1999). Air Pollution Meteorology and Dispersion. New York: Oxford University Press. Computerworld. (2007, December 03). Enterprises Struggle with Under Used Datacentres. Retrieved from techworld.com: https://www.techworld.com/news/data/enterprises- struggle-with-under-used-datacentres-10822/ Dang Gu Chai, P. F. (2017). Quantitative analysis on the energy and environmental impact of the Korean National Energy R&D Roadmap; Using Bottom up energy system model. F.W. Thomas, S. C. (1969). Plume Rise Estimates for electric Generating Stations. Great Britain. Glick, D. (n.d.). The Big Thaw. Retrieved from nationalgeographic.com: https://www.nationalgeographic.com/environment/gl obal-warming/big-thaw/ Hicham Gourgue, A. A. (2015). Dispersion of the NOx Emissions from Chimneys Around Industrial Area: Case Study of the Company CIBEL II. Materialstoday: Proceedings, 4689-4693. Investopedia. (2019, 10 4). Retrieved from investopedia.com: https://www.investopedia.com/terms/w/weightedaver age.asp Javadi, M. H. (2011). Application and roles of management science tools and techniques to effective decision making in the academic settings . Ishfahan: Elsevier Ltd. Kenneth Gillingham, J. H. (2018). Cost of reducing greenhouse gas emissions. Journal of Economic Perpspectives. Najam Khan, E. K. (2019). Location Optimization of a Coal Power Plant to Balance Costs against Plant’s Emission Exposure. American Journal of operations Research, 31-58. NASA Earth Observatory. (n.d.). Retrieved from earthobservatory.nasa.gov:
  • 12. International Journal of Scientific Research and Engineering Development-– Volume X Issue X, Year Available at www.ijsred.com ISSN : 2581-7175 ©IJSRED: All Rights are Reserved Page 12 https://earthobservatory.nasa.gov/world-of- change/DecadalTemp National Geographic. (2019, January 17). Retrieved from nationalgeographic.com: https://www.nationalgeographic.com/environment/gl obal-warming/global-warming-causes/ Nguyen Huu Huan, N. X. (2012). METI-LIS MODEL TO ESTIMATE H2S EMISSION RATES FROM TO LICH RIVER, VIETNAM . ARPN Journal of Engineering and Applied Sciences, 1473-1479. Razi, H. (2012, January). Modeling of atmospheric dispersion of mercury from coal–fired power plants in Japan. Athmospheric Pollution Research, pp. 226-237. Rodolfo C. Salazar, S. K. (1968). A Simulation Model of Capital Budgeting under Uncertainty. Informs. Rohit Nishant, T. S. (2012). Does Environmental Performance Affect Organizational Performance? Evidence from Green IT Organizations. Thirty Third International Conference on Information Systems. Orlando. Seema Awasthia, M. K. (2006). General plume dispersion model (GPDM) for point source emission. Delhi: Springer. The Guardian. (n.d.). Whats the target for Solcing Climate Change. Retrieved from theguardian.com: https://www.theguardian.com/environment/2011/nov /14/climate-change-targets Tim Laing, M. S. (2013). Assessing the effectiveness of the EU. Grantham Research Institute on Climate Change and the Environment. Retrieved from https://pdfs.semanticscholar.org/7e47/e17c418a0aeae 20db4c8dd071f8ad020e6c2.pdf Welsh, H. (1990). Cost-Effective Control Strategies for Energy-Related Transboundaiy Air Pollution in Western Europe. The Energy Journal, 87-104. Wikipedia. (n.d.). Environmental Movement. Retrieved from wikipedia.org: https://en.wikipedia.org/wiki/Environmental_movem ent Xiting Gong, S. X. (2013, August). Optimal Production Planning with Emissions Trading. Operations Research. Zhijie Zhu, X. L. (2019). Simulation Research on emission control.