Coefficient of Thermal Expansion and their Importance.pptx
GIS Automation in Ground Water Analysis
1. International Journal of Research in Engineering and Science (IJRES)
ISSN (Online): 2320-9364, ISSN (Print): 2320-9356
www.ijres.org Volume 5 Issue 5 ǁ May. 2017 ǁ PP. 25-29
www.ijres.org 25 | Page
GIS Automation in Ground Water Analysis
S. K. Singh, S.K. Tripathi and R.K. Prajapati*
Department of Energy and Environment, MGCG University, Chitrakoot- 485334, Satna (M.P.) India
*Corresponding Author email: Prajapati.rajesh8@gmail.com, Mob. +91-9755039331
Prologue
Evaluation of maps generated from different conceptual models or data processing approaches at spatial
and temporal level has its foremost importance in many geo environmental applications. GIS technology in such
studies is proved to be the powerful tool especially in water utility applications, engineering, constructions and
operational purposes. The technique provides advanced automation into number of applications that use to be
time consuming and tedious before. The attempt is an approach to give glimpse of automation techniques used
in ground water analysis in JBS pilot area.
Jaunpur Branch Sub Basin, Ground Water Levels and Sub Irrigation Units
Jaunpur Canal is a branch canal of the Sarda Sahayak Feeder Canal System of about 650 cumec capacity, off-
taking from the Sarda River and fed by Sarda Link Channel of 480 cumec capacity from the Ghaghra River. The
123-cumecs Jaunpur Branch canal irrigates about 3 lakh ha between the Gomti and the Sai Rivers. Nevertheless,
the gross command area, which can be irrigated from the Jaunpur offtake, is about 542000 ha of the Gomti-Sai
doab. The region of study is Jaunpur Branch Sub Basin, pilot area of the Ghaghara Gomti Basin that comes
under Uttar Pradesh Water Sector Restructuring Project (UPWSRP). Under the same (UPWSRP) program, the
UP Irrigation Department recently installed more than 475 piezometers with Automatic Digital Water Level
Recorders (ADWLR) to monitor groundwater levels in JBS. Six hourly groundwater level data of pre monsoon
and post-monsoon 2005 onwards as obtained from piezometer is required to be summarized as per one hundred
forty six Sub Irrigation Units.
Methodology
The tool developed for ground water depth analysis is compatible in ARCGIS environment. The
interface interpolates the data using inverse distance weighted algorithm and produces the output in table as well
as raster formats. The tool requires three input files first the peizometer data point file, second the polygon file
that is Sub Irrigation Units (it may be any other polygon layer of the same area, such as block or MSB layer),
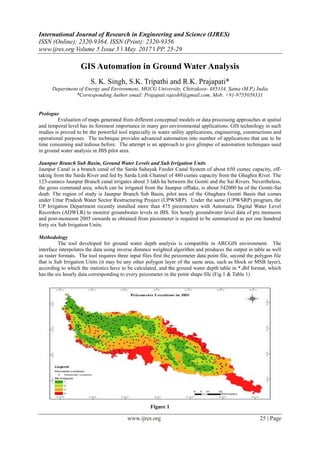
according to which the statistics have to be calculated, and the ground water depth table in *.dbf format, which
has the six hourly data corresponding to every peizometer in the point shape file (Fig.1 & Table 1)
Figure 1
2. GIS Automation in Ground Water Analysis
www.ijres.org 26 | Page
Table1
Interface of the program is user friendly, user has to mention the three files required in the input and click the
Run button to execute the program (Figure 2 & Table 2).
Table 2
Figure 2
3. GIS Automation in Ground Water Analysis
www.ijres.org 27 | Page
There are two outputs generated by the program, one is the interpolated grid, and the other is the polygon wise
statistics (Figure 3 & Table 3).
Figure 3
Table 3
Comparing the results and utility of this program, with the data for the three dates 2nd
July, 2nd
August
and 2nd
September, results are extracted presented in Figure 4, 5 & 6. It gives the idea of clear cut changing
trend of different ground water levels over three respective months.
4. GIS Automation in Ground Water Analysis
www.ijres.org 28 | Page
Figure 4
Figure 5
Figure 6
5. GIS Automation in Ground Water Analysis
www.ijres.org 29 | Page
The outputs can be seen on excel sheets in form of table and charts as well. An example of one SIU Polygon of
a Deeh distributary is plotted and demonstrated in Figure 7.
Figure 7
Utilities
[1]. The tool combines data with application behavior modeling
[2]. It analyses the output based on various statistical parameters such as central tendency and deviations
[3]. It gives a spontaneous data projection from one scale to another
[4]. It helps to understand trend of changes in ground water levels over temporal scale
[5]. User can extract information as desired whether in map or raster format or table format