1. Methods
Satellite images from SPOT (2003 and 2008) and Land Use
Database from Department of Land Development are used in this
study. The study is conducted through ArcGIS program. Method
used in this study is Sight Analysis.
1.Make two layers : Satellite images and Land Use Database
acquired from Department of Land Development
2.Analyze Satellite image(2005) by sight and make a database of the
Land Use
3. Conduct the same method with the other Satellite image (2008)
4. Find the changes in land use by using a mathematics principle
“intersection”
5. Survey the study area to check the overall accuracy
STUDY OF CHANGES IN LAND USE BY USING GEOINFORMATICS
IN BHUDDHAMONTHON,NAKONPATHOM
MUKKARIN SEANGPROH , PATHOMPONG PRUEKPRASERT
ADVISOR AJ.SIRIRAT PONGPIPATTANAPAN
MAHIDOL WITTAYANUSORN INTERNATIONAL SCIENCE SCHOOL
Paddy field Miscellaneous Urban
Other
Agriculture
Water bodies Total
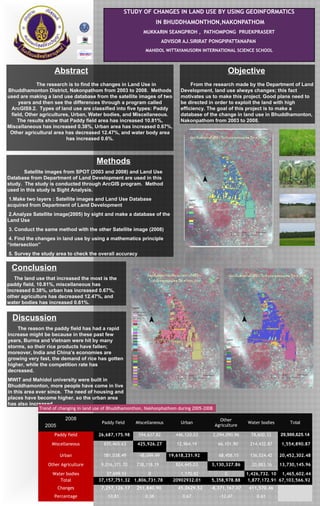
Paddy field 26,687,175.98 594,637.82 446,120.03 2,094,090.96 78,600.33 29,900,625.14
Miscellaneous 835,465.63 425,926.27 12,964.19 66,101.90 214,432.87 1,554,890.87
Urban 581,038.49 48,049.49 19,618,231.92 68,458.15 136,524.42 20,452,302.48
Other Agriculture 9,016,371.70 738,118.19 824,445.03 3,130,327.86 20,883.16 13,730,145.96
Water bodies 37,699.51 0 1,170.82 0 1,426,732. 10 1,465,602.44
Total 37,157,751.32 1,806,731.78 20902932.01 5,358,978.88 1,877,172.91 67,103,566.92
Changes 7,257,126.17 251,840.90 45,0629.52 -8,371,167.07 411,570.46
Percentage 10.81 0.38 0.67 -12.47 0.61
2005
2008
Abstract
The research is to find the changes in Land Use in
Bhuddhamonton District, Nakonpathom from 2003 to 2008. Methods
used are making a land use database from the satellite images of two
years and then see the differences through a program called
ArcGIS9.2. Types of land use are classified into five types: Paddy
field, Other agricultures, Urban, Water bodies, and Miscellaneous.
The results show that Paddy field area has increased 10.81%,
Miscellaneous has increased 0.38%, Urban area has increased 0.67%,
Other agricultural area has decreased 12.47%, and water body area
has increased 0.6%.
Objective
From the research made by the Department of Land
Development, land use always changes; this fact
motivates us to make this project. Good plans need to
be directed in order to exploit the land with high
efficiency. The goal of this project is to make a
database of the change in land use in Bhuddhamonton,
Nakonpathom from 2003 to 2008.
Conclusion
The land use that increased the most is the
paddy field, 10.81%, miscellaneous has
increased 0.38%, urban has increased 0.67%,
other agriculture has decreased 12.47%, and
water bodies has increased 0.61%.
Discussion
The reason the paddy field has had a rapid
increase might be because in these past few
years, Burma and Vietnam were hit by many
storms, so their rice products have fallen;
moreover, India and China’s economies are
growing very fast, the demand of rice has gotten
higher, while the competition rate has
decreased.
MWIT and Mahidol university were built in
Bhuddhamonton, more people have come in live
in this area ever since. The need of housing and
places have become higher, so the urban area
has also increased.
Trend of changing in land use of Bhuddhamonthon, Nakhonphathom during 2005-2008