
Recommended
More Related Content
What's hot
What's hot (20)
Similar to 2016 optimisation of front wing ground clearance - write up
Similar to 2016 optimisation of front wing ground clearance - write up (20)
More from Hashan Mendis
Recently uploaded
Recently uploaded (20)
2016 optimisation of front wing ground clearance - write up
- 1. ASSIGNMENT 4 OPTIMISATION OF A WING IN GROUND CLEARANCE MIET 2004 Mechanical Design Hashan Mendis s3449757
- 2. EXECUTIVE SUMMARY In order to maximise downforce created by the front wing, the optimum ground clearance and flap angle of the rear element was determined. As ANSYS has optimisation function built into the program, it was deemed unnecessary to spend resources on understand the code. Instead Matlab was utilised to graph the data produced. Using ANSYS CFX which is a Computational Fluid Dynamics (CFD) program, simulations in 2D were performed. The geometry contained the profiles within the domain. A domain independence study was performed to ensure the domain didn’t affect the results. It resulted in an inlet and wall 5 m away from the profile, and outlet 10 m behind. After the geometry was meshed a mesh study was also performed to ensure mesh independence, resulting in a 300 mm volume mesh of the outer domain, 50 mm volume mesh of the inner domain, 1 mm edge sizing around the wing and an inflation layer with the first element being 0.02 mm from the surface of the wing. Each simulation took 1 minute and focused on changing the ground clearance and flap angle to create a full design of experiments. The results showed maximum coefficient of lift (Cl) at 20° flap angle at 110 mm ground clearance. A partial design of experiments in 3D performed showing a maximum Cl of 1.42, with a 30° flap and 70 mm ground clearance. The different between the results is due to the different pressure distribution. The even pressure distribution present in the 2D results changes in 3D due to vortices and different pressure regions interacting. The design was then optimised by adding plates on the end plates and strakes under the wing. This controlled the air flow and hence pressure distribution. It resulted in a 30% increase of Cl from 1.42 to 1.85. Problems faced in the simulation revolved around obtaining solution that converged. The mesh had to be refined in 3D as the geometry complexity increase. Vortices were being created that required a finer mesh. Run times in 3D taking hours, required an understanding of how to interpreting the CFD data, ensuring appropriate modification were performed that would return an expected result. KEYWORDS Front Wing, aerodynamics, FSAE, CFD, ANSYS, CFX, wing, profile, ground clearance, optimisation,
- 3. Contents EXECUTIVE SUMMARY......................................................................................................................................... 2 KEYWORDS .......................................................................................................................................................... 2 INTRODUCTION ................................................................................................................................................... 4 METHODOLOGY............................................................................................................................................... 4 CFD....................................................................................................................................................................... 5 GEOMETRY ...................................................................................................................................................... 5 MESH ............................................................................................................................................................... 5 SET UP.............................................................................................................................................................. 5 SOLUTION........................................................................................................................................................ 6 DESIGN OF EXPERIMENT ................................................................................................................................. 6 OPTIMIZATION..................................................................................................................................................... 6 Conclusion ........................................................................................................................................................... 7 Appendix A – Residuals and Monitor Points ....................................................................................................... 8 Appendix B – DOE Results ................................................................................................................................. 10 Appendix C – Pressure Distribtion of 2d and 3d flow........................................................................................ 11 Appendix D - flow structure - 30° flap angle, 70 mm ground clearance........................................................... 12 Appendix E – Long end plate............................................................................................................................. 13 Appendix F – foot and side plate....................................................................................................................... 14 Appendix H – cut away end plate and Top Plate............................................................................................... 16 Appendix I – strakes on wing............................................................................................................................. 17 Appendix I – variations of the designs............................................................................................................... 18 Table of Figures Figure 1 - Front Wing Design – Double element profile, end plate and mounting plate.................................... 4 Figure 2- Simplified model of the FSAE car ......................................................................................................... 4 Figure 3- 3D geometry used ................................................................................................................................ 5 Figure 4-2D Geometry used for CFD.................................................................................................................... 5 Figure 5-Volume sizing of the domain in 2D ....................................................................................................... 5 Figure 6- Inflation layer around wing .................................................................................................................. 5 Figure 7- Modified front wing design with plates and strakes............................................................................ 7
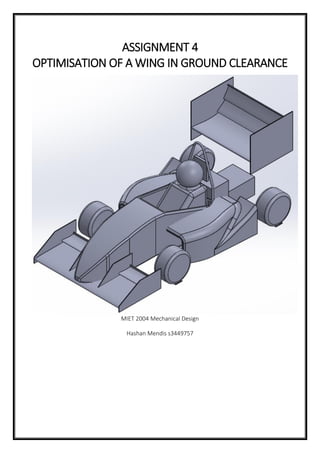
- 4. INTRODUCTION The aerodynamics package of the FSAE car as shown in Figure 1 consisting of a front and rear wing used to increase the average cornering speed of the race car. The current design of the front wing in Figure 2. As the middle section of the wing is fixed, the section with two elements will be analysed will be optimised to increase the Cl using ANSYS CFX which is a CFD simulator. ANSYS CFX is a CFD simulation software that predicts air flow and force. The coefficient of lift is a dimensionless number and in this case indicated how much downforce can be created. The pressure distribution between the top and bottom surface of the wing is essential to creating downforce. As ground clearance of the wing decreases, a venturi is created, cross sectional area decreases, flow accelerates, pressure underneath the wing drop, increasing the pressure difference which creates more downforce. The pressure drop increases the adverse pressure gradient and flow will separate if it is too large, reducing downforce. Flow separation is sensitive to the flap angle with large flap angle generating a large pressure gradient. In order to increase downforce, the ground clearance and flap angle needs to be evaluated and then the design optimised. METHODOLOGY The flow fields of the front wing are effect by the car but running a full car simulation will increase computational time. To reduce complexity a front wing in isolation will be studied, with a varying second flap. 2D and 3D simulations can be run in CFD. 2D simulations have a quick run time however doesn’t take into account vorticity and different pressure regions interacting. The coefficients are overstated but using a constant set up general trends can be deduced. 3D simulations can take hours to solve but accurately predict flow fields of complex 3D geometry. Due to the quick run time 2D CFD will be utilised to perform a full design of experiments. The ground clearance will vary from 50mm (minimum wing height due to pitch and roll) in 20mm increments and flap angles ranging from 10° to 40° in 10° increments. Matlab will be used to plot data. A partial design of experiments will be conducted in 3D focusing on areas that yield high Cl. Figure 1 - Front Wing Design – double element profile, end plate and mounting plate Figure 2- Simplified model of the FSAE car
- 5. After an optimum ground clearance and flap angle have been established the design will be optimised to increase Cl. CFD GEOMETRY The double element profile in the domains have the ability to translate and rotate the rear flap angle. The 2D geometry took a 1 mm slice of the profiles where the 3D geometry has a 400 mm span as shown in Figure 3. with fixed end plate. Due to geometry symmetry a half model was simulated, reducing computational time. A domain study was conducted in order in order to ensure the walls do not affect the results and the outlet is far enough to resolve the wake. The inlet and top wall placed 5000 m away from the profile and outlet 10000 mm behind as shown in Figure 4. In 2D the wall has a 1 mm width, 3D a 4000 mm width. The inner domain allows a fine mesh to be created locally around the wing capture important flow fields. MESH A mesh study was conducted to establish independence. It consists of tetrahedron elements that are able to contour to the complex geometry. The outer domain has a volume sizing of 300 mm, inner domain of 50 mm and 1 mm edge sizing around the wing as shown in Figure 5. Prism elements on the surface of the wing are used to capture the boundary layer, consisting of 20 elements with the first element height set to 0.02 mm as shown in Figure 6 resulting in a total element count of 43 000 in 2D and 11 000 000 in 3D. As the complexity of the 3D geometry increase, a 20 mm inner volume mesh was required to solve. SET UP The inlet and ground speed was set to 60km/hr which is the average car speed. The wing has a no slip condition allowing a boundary layer to be formed. The walls have a free slip condition; this bounds flow but won’t affect pressure. The turbulence model used is called Shear Stress Transpose as it can resolve a fine boundary layer accurately which is important to predict separation. Convergence criteria was set to 1e-6 with downforce monitors to ensure stability. Figure 6- Inflation layer around wing Figure 3- 3D geometry used Figure 4-2D Geometry used for CFD Figure 5-Volume sizing of the domain in 2D
- 6. SOLUTION The monitor points which measured downforce of the wing are constant with the residuals declining indicating a converged simulation. A sample if produced in Appendix A for a 2D run. If issues occurred the mesh was altered. A typical simulation took 1 minute in 2D and 2 hours in 3D. DESIGN OF EXPERIMENT The data from the experiments were added to an excel file. Matlab was then used to read the data and plot it as seen in Appendix B The 2D full design of experiments show the trends are unimodal for each flap angle. The maximum Cl is between a ground clearance of 90 mm to 110 mm. Flow starts to separate at 30° flap angles which is why 20° has the highest Cl. The difference between the maximum Cl and neighbouring data points is under 5% which is deemed acceptable. 5% difference of Cl results in a 1kg difference at 60km/hr which won’t affect performance. The 3D partial design of experiments started at 110 mm ground clearance at 20° flap angle. Ground clearance adjusted until Cl peaked. The results showed 20° flap angles reached a maximum Cl of 1.35 and 30° max Cl of 1.42 at 70 mm ground clearance. At 40° the flow separates at high ground clearance, decreases ground clearance would increase the pressure gradient exasperating separation. To save computational time the 40° angles were neglected. The difference between the neighbouring data points is under 5% showing that there isn’t a noticeable difference between the flap angles or ground clearance. The reason the 2D design of experiments under predicted separation angle and ground clearance is due to the pressure distribution between 2D and 3D flow. The pressure contour of a 2D simulation is 200 Pa lower mid chord than the 3D simulations as seen in Appendix C. The pressure difference is due to the different flow conditions. In 2D, the flow is chord wise resulting in an even pressure distribution. In 3D, due vortices and different pressure gradients interacting, the air flow travels chord and span wise. The change in flow, changes the pressure distribution, resulting in higher pressure underneath the wing. This results in a lower pressure gradient, allowing the wing to push higher angles, and lower ground clearances. This shows that the 2D simulations need to be tested in 3D but can be used to understand how variables interact and where to start. OPTIMIZATION Appendix D shows the flow structure of the wing at 30° flap angle at 70 mm ground clearance. Due to the pressure difference between the wing and free stream air, a clockwise vortex on the bottom edge of the end plate and anticlockwise vortex on the top edge is formed. As discussed, the vortex interferes with the pressure distribution reducing efficiency. The first iteration was to extend the end plate till it was 40 mm above the ground as shown in Appendix E. This ensured in pitch and roll the wing didn’t bottom out. The long end plate moved the vortex away from the bottom surface of the wing, lowering the pressure, increasing Cl by 8%. A 19 mm foot and side plates were added to the end plate as seen in Appendix F. It lessens the intensity of the vortex on the bottom side and moves the top vortex away from the wing. It reduced its effect on the pressure distribution of the wing which increased Cl by 9%. A C-channel section was also tried to produce the same effect as seen in Appendix G. The idea was that the channel would contain the vortex. On comparison the Cl was the same, as the foot plate would be easier to manufacture it was chosen.
- 7. A section of the top end plate was taken out match the profile of the mounting plate. Top plates were then added, pushing the top vortex away from the wing as seen in Appendix H. The design increased Cl by 2%. In order to control the vortex created on the lower side strakes were added as seen in Appendix I. The strakes would control the air flow and contain the vortex. 3 strakes were added at 20mm apart, any more saw no return. The pressure distribution of the lower surface with the strakes show a larger low pressure region contained by the strakes, with the vortex having a smaller effect. The design saw a 9% increase in Cl. The double element section of the design has changed from the simple design to add plates along the end plate and strakes underneath the wing. Overall the design saw an increase of 30% downforce with a Cl of 1.85. Appendix J has a list of design changes with respective Cl. If time was available, the next steps would be to add the wing to the car with rotating wheels to understand how the flow fields change. CONCLUSION The front wing is a vital component of the aerodynamics package in creating downforce. An analysis needed to be conducted to understand what the optimum ground clearance was at different flap angles and if the design could be optimised. A full design of experiments was conducted in 2D at ground clearances varying from 40 mm to 150 mm at flap angles ranging from 10° to 40°. The results showed a unimodal trend, the maximum Cl produced 20° at 90 mm ground clearance with flow separation at 30°. The partial design of experiments in 3D showed max Cl at 30°, 70 mm ground clearance. The difference in data from the 2D is due to the change of the pressure distribution along the surface of the wing. The design was then optimised to increase Cl, increasing 30% from 1.42 to 1.85 due to the addition of plates on the end plate and strakes on the wing. The devices controlled air flow by controlling the vortices created. If time was available, the next steps would include adding the wing to the chassis with rotating tires to understand the flow fields and how they change. Figure 7- Modified front wing design with plates and strakes
- 8. APPENDIX A – RESIDUALS AND MONITOR POINTS RESIDUALS OF A 2D SIMULATION
- 9. MONITOR POINTS OF A SIMULATION STABILISING
- 10. APPENDIX B – DOE RESULTS DOE RESULTS
- 11. APPENDIX C – PRESSURE DISTRIBTION OF 2D AND 3D FLOW 2D PRESSURE DISTRIBUTION 3D PRESSURE DISTRIBUTION
- 12. APPENDIX D - FLOW STRUCTURE - 30° FLAP ANGLE, 70 MM GROUND CLEARANCE PRESSURE DISTRIBUTION OF THE END PLATE PRESSURE DISTRIBUTION OF THE END PLATE WITH VORTEX REGION CORES HIGHLIGHTED IN GREY. PRESSURE DISTRIBUTION OF THE BOTTOM SURFACE OF THE WING
- 13. APPENDIX E – LONG END PLATE PRESSURE DISTRIBUTION WITH LONG END PLATE PRESSURE DISTRIBUTION WITH LONG END PLATE HIGHLIGHTING VORTEX REGION PRESSURE DISTRIBUTION OF THE BOTTOM SURFACE OF THE WING WITH LONG END PLATE
- 14. APPENDIX F – FOOT AND SIDE PLATE FOOT PLATE AND SIDE PLATE ADDED VORTEX GENERATED FROM FOOT PLATE HAS LESS INTENSITY, TOP VORTEX IS PUSHED AWAY FROM THE WING PRESSURE DISTRIBUTION OF THE BOTTOM SURFACE OF THE WING WITH FOOT AND SIDE PLATES.
- 15. APPENDIX G – C-CHANNEL DESIGN C CHANNEL ON END PLATE
- 16. APPENDIX H – CUT AWAY END PLATE AND TOP PLATE TOP PLATES CREATE A VORTEX AWAY FROM THE WING PREVIOUS DESIGN WITH A VORTEX OVER THE WING
- 17. APPENDIX I – STRAKES ON WING DESIGN OF THE STRAKES PRESSURE DISTRIBUTION UNDERNEATH THE WING VORTEX CREATED FROM BOTTOM SURFACE VIEW OF THE VORTEX FROM THE FRONT PLANE
- 18. APPENDIX I – VARIATIONS OF THE DESIGNS VARIATION CL 70MMGROUND CLEARANCE 1.42 LONG END PLATE 1.53 LONG END PLATE AND FOOT PLATE 1.67 LONG END PLATE, FOOT PLATE AND TOP PLATE 1.70 LONG END PLATE, FOOT PLATE, TOP PLATE AND STRAKES 1.85 TABLE OF VARIOUS DESIGNs