SlideShare a Scribd company logo
1 of 18
Download to read offline
Spectroscopy
C-H
stretch
Wave numbers in cm"1
5000 4000 3000 2500 2000 1500 1400 1200 1100 1000 900 800
4 r/
700
0 ch3cch2ch3
2 3 4 5 6 7 8 9 10 11 12 13 14 15
ntil about 1945, the structure of a newly discovered organic compound was based almost
entirely on itsmolecular formula andchemicalreactions.The compoundwas convertedinto a
knowncompound by a series ofspecific reactions,or it was synthesised from smaller known
compoundsby specific reactions.This way offinding the structure ofan organic compoundwas time-
consuming and not always 100% accurate. The conclusions were as reliable as the understanding of
the reactions that were carried out.
Organic chemistry has been revolutionised in the past 50 years by the use of Spectroscopic
Methods for analysis and structure determination. These methods have three major advantages over
most chemical methods :
(1) Spectroscopic methods are easier and faster to do than mostchemicaltests or reactions.
(2) Spectroscopic methods provide far more information about molecular structure.
Practicallyallfunctional groups andstructural features can bedetectedwithvery small
amounts ofsample.
(3) Spectroscopic methods are non-destructive and,ifnecessary,the entiresample can be
There are four spectroscopic methods which are very widely used in Organic Chemistry. They
are :ultraviolet-visible, infrared, nuclear magnetic resonance, and mass spectroscopy. The basis of
these methods is electromagnetic radiation.
ELECTROMAGNETIC RADIATION
The most familiar form ofelectromagneticradiation is ordinary white light,which canbedispersed
by a prism into a spectrum of colours. This visible light represents only a small part of the entire
Electromagnetic Spectrum,which extends fromhigh-energycosmic raysto low-energy radioor radar
waves. Electromagnetic radiationcan bedescribed as a stream ofenergetic particles called Photonsor
as aWave Motion.
recovered.
SPECTROSCOPY Ăż
173
ESE8Z2
10"Hz 10'5Hz 1010Hz
Cosmic X-rays (UV) (UV) (Vis) (IR) (IR) Microwave
and Vacuum Near Visible Near Infrared and
7-rays ultraviolet ultraviolet infrared radio
0.1 nm 11m ouvim 2 »im 50 nm
Fig. 9.1. Electromagnetic spectrum.
The fundamental equations of electromagnetic radiationare :
E= hv and vA =c
where E is the energy of radiation, h is Planck's constant, v (pronounced as nu) is the frequency of
radiation, A (pronounced as lambda) is the wavelength ofthe radiation, andc isthe velocity of light
which isconstant. Since v and A arc relatedbya constant (c),the energy of radiationcan be described
by either frequency or the wavelength.
Fig. 9.1 shows the various components of the electromagnetic spectrum. Inorganic chemistry,
the importantwavelength regions are the ultraviolet,visible, and infrared.
The ultraviolet and visible regions are adjacent, and the boundry is somewhat arbitrary since it
depends upon humanperceptionoflight.The commonlyusedunitfor wavelength inthisregion isthe
Nanometer ( 1 nm= 10~9 meter =0.1A, angstrom).The infraredregionisat longer wavelengths (lower
energy,sinceE=heIX).Forthis region,the scalcmaybe expressedinwavelength (microns,[!)or Wave
Number. The latter is generally preferred. The wave number is the reciprocal of the wavelength in
centimetres.
PRINCIPLEOF SPECTROSCOPY
All organic compounds interact with electromagnetic radiation, that is, they absorb energy.
When a moleculeabsorbs energy,a transformation occursthat may becither temporary or permanent.
Lower-energy radiation may cause a molecularrotationor a bondvibration. Higher-energy radiation
may cause the promotion of electrons to higher energy levels or bond clcavagc.
Whether the transformation involvesmolecular rotation,bondvibration, or electronic transition.
the molecule absorbs only the wavelength of radiation with exactly the energy necessary for the
transition. The absorption of wavelengths of radiation is selective for a particular transition which
depends on the structure ofthe molecule.By measuringthe absorptionspectra of knowncompounds.
we can correlate the wavelengths of energy absorbed with characteristic structural features. This
information is then used to determine the structure of unknown compounds.
SPECTROPHOTOMETER
The instrument that is used to measure the amount ofelectromagnetic radiation absorbed by an
organic moleculeiscalled Spectrophotometer or Spectrometer. Itconsistsofa lightsource ofradiation.
with a prism that can select the desired wavelengths, which are passed through a sample of the
compoundbeinginvestigated(Fig.9.2). The radiationthat isabsorbed bythe sample can be detected,
analysed, and recorded. The recording is called the Spectrum of the compound.
I
I
174Ăż A TEXTBOOK OF ORGANIC CHEMISTRY
ivd_
Light Prism
source selector Sample Detector Recorder
Fig. 9.2. Basic components of a spectrophotometer.
INFRARED SPECTROSCOPY
An infrared(IR) spectrometer subjects a compound to infrared radiation in the 5000-667 cm'1
(2|im) range. Although this radiation is weak, it does supply sufficient energy for bonds in the
moleculeto vibrate by Stretchingor Bending(Fig.9.3).The atoms ofamoleculecanbeconsideredas
linkedby springs that are set inmotion by the applicationof energy. As the molecule is subjected to
the individual wavelengths in the 5000-667 cm"1 range, it absorbs only those possessing exactly the
energy requiredto cause a particular vibration. Energy absorptions are recorded as bands (peaks) on
V V V V
»Stretching vibrations Bending vibrations
Fig. 9.3. Molecular vibrations caused by infrared radiation.
Since different bonds andfunctional groups absorb at different wavelengths, an infraredspectrum
is used to determine the structure of organic molecules. For example, carbon-carbon triple-bond is
stronger than a carbon-carbon double bond and requires a shorter wavelength (greater energy) to
stretch. The same considerations apply to carbon-oxygen and carbon-nitrogen bonds.
C=C
2100-2200cm
c=c
1620-1680cm
ri
C=0
1690-1750cm
C—O
1050 1400an
C=N
2210-2260cm"1
C—N
1050-1400cm1
Thus, from the positionofan absorption peak,one can identify the group that caused it.Fig. 9.4
shows the general areas in which various bonds absorb in the infrared.
Wavelength (jam)
2
100
. I
o 80
.1
I60
c
CO
i<0
iX 20
"T1""
N — H
O—
C
3.5 4 4.5 5 5.5 6 6.5 7 8 9 10 11 12 14 16
1" '
C =r C
c3n h°HN C =N
T
ÿJ—1—i—i
—
C ~C
:C~0
C N
Fingerprint rQgioft
P i Ăż
T
.4000 3500 3000 2500 2000 1800 1600 1400 1200 1000 800 600
Wavelength (cm ')
Fig. 9.4. Area of absorption for various bonds in the infrared.
SPECTROSCOPY Ăż
175
(B>
(C)
Fig. 9.5.
bend
ÿC —H
stretchOH J
stretch CO stretch
An infrared spectrum is usually studied in two sections :
(1) FunctionalGroup Region.The area from 5000cm'1to 1300cm"1iscalledthe functional group
region. The bands in this region are particularly useful in determining the type of functional groups
present in the molecule.
(2) Fingerprint Region.The area from 1300 cm"1to 667 cm"1iscalledthe fingerprint region. A
peak-by-peak match ofan unknown spectrum with the spectrum of the suspected compound in this
regioncan be used, muchlikea fingerprint, to confirm itsidentity.Table 9.1shows some characteristic
infrared absorptionbands. Fig. 9.5 shows some examples ofinfrared spectra.
Wave numbers in cm"1
5000 4000 3000 2500 2000 1500 1400 1200 1100 1000 900 800 700
100 s ......-
TT
Ăż
Wave length in microns
stretch
Wave numbers in cm"1
Wave length in microns
stretch
C-H
bends
(isopropyl)
bends
Hstretch
5000 4000
Wave numbers in cm"1
1100 1000 900
bends
KCHoNHo_I
_— L -£
2 3 4 5 6 7 8 9 10 11 12 13 14 15
Some examples of IR spectra. (A) is Methanol. (B) is Butanone. (C) is Isobutylamine.
176Ăż A TEXTBOOK OF ORGANIC CHEMISTRY
Table 9.1 :SOME CHARACTERISTIC IR ABSORPTION BANDS
Range incm'1
Bond(Remarks)
1050-1400 C-0 (inethers, alcohols, esters)
1050-1400 C-N (inamines)
1315-1475 C-H (inalkanes)
1340-1500 no2 (two peaks)
1450-1600 c=c (inaromatic rings :several peaks)
1620-1680 C=C (inalkenes)
1630-1690 C=0 (inamides)
1690-1750 C=0 aldehydes, ketones, esters)
1700-1725 c=o (incarboxylic acids)
1770-1820 c=o (inacidchlorides)
2100-2200 Cs=C
2210-2260 C=N
2500 S-H
2700-2800 C-H (ofaldehyde group)
2500-3000 O-H (of COOH group)
3000-3100 C-H (C is part ofaromatic ring)
3330 C-H (C is part of OC)
3020-3080 C-H (C is part of C=C)
2800-3000 C-H (inalkanes)
3300-3500 N-H (inamines,amides)
3200-3600 O-H (in H-bonded ROH)
3600-3650 O-H
Summary of IRSpectroscopy
(1)Absorption ofinfraredradiationcauses covalent bonds within the moleculeto be promoted
from one vibrational energy level to a higher vibrational energy level.
(2) Stronger bonds require greater energy to vibrate (stretch or bend). Therefore, such bonds
absorb infrared radiation ofshorter wavelengths.
(3) Different functional groups absorb infrared radiation at different wavelengths, and their
presence or absence ina moleculecan be determined by examination ofan IR spectrum.
(4) No two compounds have exactly identical infrared spectTa.
ULTRAVIOLET-VISIBLE SPECTROSCOPY
Inultraviolet-visible(UV-Vis)spectroscopy, the 200-750 nmregionofthe ultravioletspectrum is
used. This includes both the visible region (400-750 nm) and near ultraviolet region (200-400 nm).
Radiation of these wavelengths is sufficiently energetic to cause the promotion of loosely held
electrons, such as nonbonding electrons or electrons involved in a 7i-bond to higher energy levels.
For absorption inthis particular regionofultravioletspectrum, the moleculemust contain conjugated
double bonds. Ifthe conjugation is extensive, the molecule will absorb inthe visible region.
The ultraviolet-visiblespectrum is composedofonly a few broadbands ofabsorption(Fig.9.6).
The wavelength ofmaximumabsorbance isreferredto as The following pointsshouldbekeptin
mindwhile interpretinga UV-Visspectrum.
(1) Nonconjugatedalkenesshow an intenseabsorption below200nmandistherefore inaccessible
to most commonly usedUV spectrometers. Forexample,ethylenehas =171nm.This absorption
comes from the light-inducedpromotionofa 7c-electronto the next higher energy level.
I
SPECTROSCOPY. Ăż
177
.....V -I .. ' )iM|m IO' Ăż
-
/ j --f- I
200 400 600 750 nm
Fig. 9.6. A sample UV-Vis spectrum.
(2) Nonconjugatedcarbonyl compounds have a very weak absorption band in the 200-300 nm
region.This bandarises fromexcitationofone ofthe nonbondingelectrons(fromanunsharedpair)to
the next higherenergy level.For example,
O
ii
ch3—c—ch3 a0Acetone Cydohexanone
279 nm 291 nm
(3) When a moleculecontains two or morenonconjugatedcarbon-carbondoublebonds,the UV
spectrum isthat expectedofa simple alkene. However,when the doublebonds are conjugated, /™ax is
shifted to longer wavelengths. For example,
ch2=ch—ch2—ch2—ch=ch2 ch3ch=ch—ch=chch3
1,5-Hexadiene 2,4-Hexadiene
178 nm 227 nm
(4) Conjugation of a carbon-carbon double bond and a carbonyl group shifts the Ama* of both
groups to longer wavelengths. For example,
(CH3)2C=CH—CH2CH3 180 nm
O
II
(CH3)2CH—CH2—C—CH3 283 nm
O
(CH3)2C=CH—C—CH3 230 nm ( for C=C)
327 nm ( for C=0)
(5) As the number ofdouble bonds inconjugationincreases, A,max also increases. For example,
ch2=ch—ch=ch2
1,3-Butadiene Benzene
215 nm 257 nm
Summary-ofUV-VisSpectroscopy
(1) Absorptionofultraviolet-visibleradiation(200-700nm)causes electrons withinmolecules
to be promoted from one energy level to a higher electronic energy level.
(2) Ifan organic compound does not absorb UV-Vis radiation, it means that the compound
does not contain conjugated double bonds.
(3) Ifan organic compoundabsorbs UV-Visradiation, it means that the compoundcontains a
carbonylgroup or conjugateddoublebonds.Forexample,conjugateddienes, carbonylcompounds,
andaromatic compounds all absorb inthe UV-Visregion.
178« atextbook of organic chemistry
NUCLEAR MAGNETIC RESONANCE (NMR) SPECTROSCOPY
Nuclear magnetic resonance spectroscopy involves absorption of electromagnetic radiation in
the radio frequency region.Absorption ofradiowaves inthe presenceofmagnetic field isaccompanied
by a special type of nuclear transition, and for this reason we call this type of spectroscopy nuclear
magnetic resonance (NMR) spectroscopy.
The nuclei ofcertainatoms behaveas ifthey are spinning charges. Any spinning charge creates
a magnetic field and behaves as if it were a tiny bar magnet. Of the three nuclei most common in
organic compounds ('H, l2C, and ,60)only the hydrogen nucleus proton behaves in this manner.
When a proton inan organic molecule isplaced in a strong magnetic field, it can align with the
field or against it. Inthe morestable low-energystate, itisalignedWith the magnetic field(Fig.9.7). If
energy issupplied inthe form ofradiowavesofexactly the right frequency, radiation will be absorbed
and the nucleus will "flip" and alignagainstthe appliedmagnetic field inthe higher energy state. For
example,a proton inan appliedfieldof 14000 gauss requiresa frequency of60 millionhertz(cyclesper
second) for this particular transition. When this exact frequency is applied, it is absorbed, and the
absorption recorded on a chart paper. Inpractice, either the magnetic field can be held constant and
the radio frequency varied, or more commonly, the radio frequency can be held constant and the
magnetic field varied. Fig.9.8 shows the various components ofa NMR spectrometer.
Positionof Signals ;ChemicalShifts. The mainpurpose ofNMR isnot to detect the presenceof
protons in a molecule. It can distinguish between protons indifferent chemical environments within
the molecule. Protons on benzene ring, or on a carbon bearing a chlorine, or on a carbon adjacent to
a carbonyl group absorb radio frequency energies at different applied magnetic fields, and appear at
different locations(chemicalshifts) on the recordingpaper. Also, thepositionofabsorption isrelatively
constant for protons ina particular chemical or structural environment. Hence,the numberofsignals
recordedon the NMR chartpaper indicates the number ofdifferent types ofprotons ina molecule.
The position of the peak can give information about the molecular structure in the vicinity of the
proton.
High energy
less stable state
(b)
Radio
waves
T
Low energy
more stable state (a)
Fig. 9.7. Orientation of a spinning hydrogen nucleus in an applied magnetic field.
(a) shows the nucleus in more stable low-energy state. (b) shows the nucleus in
less stable high-energy state. Applying radiowaves flips the nucleus from the
more stable 'aligned' state (a) to less stable 'nonaligned' state (b).
To understandthe applicationofNMR,we should knowwhat arc EquivalentandNon-equivalent
protons.Equivalent protons are protons inthe same moleculethat are chemically indistinguishable. In
I
SPECTROSCOPY J 179
other words, equivalent protons are positioned instructurally and chemically equivalent areas inthe
molecule.As an example, letus consider the following compounds.
Sample tube
(A)
Magnet
(B)
Radio frequency
input oscillator
Detecto
Radio Frequency
Oscillator
NMR
spectrum
Detector
Powerful
electromagnet
Sample tube
Fig. 9.8. Schematic diagrams of a NMR spectrometer.
CI
ch3—ch2—CI
a b
CH3—CH2—CH2—CI
a b c
n-Propyl chloride
(3 Signals)
CH -CH,CH-
a" b c"
Isopropyl chloride
(2 Signals)
Ethyl chloride
(2 Signals)
Equivalent protons are indicated by the same letter, non-equivalent protons by different letters.
Noticethat w-propyl chloridecanbe easily distinguishedfrom its isomer isopropylchloride,by simply
examining the NMR spectra of the two compounds, n-propyl chloridc gives three NMR signals and
has three non-equivalent sets ofprotons,whereas isopropyl chloride gives two NMR signals and has
two sets of equivalent protons and one non-equivalent proton.
180". A TEXTBOOK OF ORGANIC CHEMISTRY
Delta and Tail Scales.Nuclearmagneticresonancechartpaperisrectangularwith a linearscale of
8 (delta) unitsacross the bottom.Mostchart papers have scales from 5=0to 8= 8 or 9 ppm (partsper
million).Toeverysampleasmallamount ofTetramethylsilane (TMS),(CH3)4Si,isaddedasareference
(theTMS signal isat 8=0). All other signals are relativeto TMS. SometimesX (tau)scaleisusedwhere
the TMS signal isat 10.0ppm. HenceT = 10—8.
Table 9.2 lists some characteristic chemical shifts (fromTMS) ofdifferent types ofprotons.
Table 9.2 : SOME TYPICAL NMR CHEMICAL SHIFTS OF PROTONS
pe ofProton Type ofCompound 8 Value
R-CH3 Alkane 0.8-1.2
Ar—CH3 Arene 2.2-2.5
c=c-ch3 Alkene 1.6-1.9
R-O-CH3 Ether 3.2-3.3
Ar—O-CH3 Ether 3.7-4.0
R-CO-CH3 Ketone 2.1-2.4
Ar—CO-CH3 Ketone 2.4-2.6
CH3-COOR Ester 1.9-2.2
R-COOCH3 Ester 3.0-3.9
CH,-N< Amine 2.2-2.6
R-CH2-R Alkane 1.1-1.5
R-CH2—Ar Arene 2.5-2.9
R-CH2-X Alkyl halide 2.7-4.5
r-ch2-no2 Nitroalkane 4.4-4.6
R CH2-OH Alcohol 3.4-4.0
Ar-CH2-OH Alcohol 4.0-5.0
R-CH2-COOH Acid 2.0-2.6
R3C-H Alkane 1.4-1.6
Ar-H . Arene 6.0-7.5
C=C—H Alkene 4.5-6.0
CsC-H .Alkyne 1.7-1.9
R-CHO Aldehyde 9.0-10.0
R-COOH Acid 10-12
R-OH Alcohol 2-6
Ar-OH Phenol 6-8
r-nh2 Amine 1-5
As anexample, letusconsider the NMR spectrum ofbenzylalcohol(Fig.9.9A). Noticethat there
are four signals inthis spectrum.
(1) The signal on the far right at 8= 0 is that ofthe TMS reference.
(2) The signal at 8 = 7.3 is a single sharp peak due to the five chemically equivalent phenyl
protons.
(3) The signal at 8 =4.6 isa single sharp peak due to the two chemically equivalent methylene
(-CH2-) protons.
(4) The signal at 8=2.4 isa single sharp peak due to the hydroxy (-OH) proton.
I
SPECTROSCOPY Ăż
181
Area = 5
Area = 2
TMS
Reference
8.0 7.0 6.0 5.0 3.0 2.0 1.0 0 PPM4.0
Chemical Shifts / 5
(B)
Area = 3
Area = 2
Area = 1
1.0 0 PPM8.0 7.0 6.0 5.0 4.0 3.0 2.0
Chemical Shifts / 8
Area = 6
"CH?
Ares
TMS
Reference!
8.0 7.0 6.0 5.0 4.0 3.0 2.0 1.0 0 PPM
Chemical Shifts / 5
Fig. 9.9. Some examples of NMR spectra. (A) is Benzyl alcohol. (B) is Ethyl
alcohol. (C) is Isopropylbenzene.
Peak Area ;Integration.The relative areas under the various peaks ofa NMR spectrum are in
proportion to the number of protons contributing to each signal. These areas can be electronically
integrated by a NMR spectrometer. Comparison of the areas provides the ratio among the various
kindsofprotons inthe molecule.Forexample,consider the NMRspectrum ofbenzylalcohol(Fig.9.9
A). The hydrogens inthe moleculeare ina I:2 :5 ratio,likethe correspondingareas inthe spectrum.
I
182 iA TEXTBOOK OFORGANIC CHEMISTRY
Peak Splitting ;SplittingPattern.Hydrogensonadjacent carbons,eachwithadifferent chemical
shift, can influencethe signal ofthe other. This influenceappears as peak splitting. We can generalise
the phenomenon by saying that the number ofpeaks into which aparticularproton'ssignal is split,
equals one more than the total number ofprotons on directly adjacent carbons. The split peaks are
not ofequalheight. Fig. 9.10 shows the splitting pattern for various types ofnon-equivalent protons.
II I H I H
II I I I I
—C— C— —C—c— —C—c—H
ii ii ii
H H H H H H
/  I  / Doublet Doublet Triplet Doublet Quartet Doublet
Fig. 9.10. Splitting pattern for various types of non-equivalent protons.
Inthe NMR spectrum of ethyl alcohol (Fig. 9.9 B), notice that the ethyl group is indicated by a
quartet and a triplet.
In the NMR spectrum of isopropyl benzene (Fig. 9.9 C), notice that the isopropyl group is
indicated by a heptet and a doublet.
SummaryofNMRSpectroscopy
(1) Absorption ofradiowaves inthe presenceofa magnetic fieldcauses nucleiwithin molecules
to be promoted from one spin energy levelto a higher spin energy level.
(2) The number ofsignals inthe NMRspectrum corresponds to the number ofdifferent types
ofprotons inthe molecule.
(3) The position (chemical shift) of each signal gives information about the structural
environment of the protons.
(4) The relative areas (Integration) under the signals givethe ratioofthe numbers ofeach type
of proton inthe molecule. Ifthe molecular formula is known, the actual number of each type of
proton can be determined.
(5) The splittingpatternofeachsignal gives usthe numberofprotonsonneighboringcarbons.
The number ofpeaks into which a signal is split is one more than the total number ofprotons on
directly adjacent carbons.
IMPORTANT TERMS USED IN NMR SPECTROSCOPY
Chemicalshift :The separationbetween thepeak ofthe reference standard (TMS) andany other
peak inan nmr spectrum.
8scale :An nmr scale inwhich the TMS peak isset at zero andpeaks to the left ofit (downfield)
haveincreasinglypositivevalues, inparts per million(ppm).
TMS :Abbreviation for tctramethylsilane, (CH3)4Si,the reference standard innmr spectrometry.
Downfield shift :The protons of most organic compounds are less shielded than those of TMS
and therefore require less energy for resonance to take place. The peaks appear therefore at lower
fields, or downfieldof the TMS reference peak.
Spin-spin coupling : The splitting of a signal into two or more peaks because of magnetic
interactions between neighboring protons.
(w +1) rule :A rulethat allowsus to predict intohow many smaller peaks a given signal issplit by
neighboring protons. The rule states that a signal is split into (n+ 1) peaks, where n represents the
number ofequivalent next-doorprotons.
SPECTROSCOPY Ăż
183
c
I1
O
JC
C=
ĂżC
N
1°»
lo
—H C =C
1
N— H II
3800 3400 3000 2600 2200 1800 1400
Wavenumber (cm*1)
Group Assignments in Infrared Spectra
C02H
CHO
ArH C=CH X—CH C=CH
Tl*IS
OCH COCK
CH
ch2
11.0 10.0 9.0 8.0 7.0 6.0 5.0 4.0 3.0 2.0 1.0 0
Chemical shift, 8 (ppm)
Higher magnetic field
i
>Proton more deshielded
Group Assignments in NMR Spectra
MASS SPECTROSCOPY
Ina mass spectrometer, organic molecules are vapourised and bombarded with a beam of very
high-energy electrons (Fig.9.11).The resultingcollisions impartconsiderable energyto the molecule,
which inturn emit electrons to producepositively charged ions. These ions possess so much energy
that they often fragment through various bond cleavages to produce new positively charged ions.
ABC+ (Molecular ion)
ABC electron
> AB+ c+beam
A+ BC+
The positive ions are accelerated toward a negatively charged plate by passing them through a
magnetic field,which deflects the ions.The ionsoflightermass are deflected more thanheavier ions.
Eachkindofionhasaparticularmassto charge (m!e)ratio.Formost ions producedinthe fragmentation
of the molecule, the charge is +1so, that m/e usually represents the mass ofthe ion.
Base Peak.The set ofionsproducedfrom amoleculecan be analysed since each has itsown ml
e ratio,andproduces a signal whose intensity is due to the relativeabundace of that ion. The largest
peakfound in a mass spectrum (that ofhighest intensity) is calledthe basepeak, and is given the
numerical value of 100. The intensities of all other peaks are expressed relative to the height ofthe
base peak.A mass spectrum ishighly characteristic ofa particular compound.
I
184" A TEXTBOOK OF ORGANIC CHEMISTRY
Beam
positive
Negatively
accelerating
plates
Sample=(o
inlet xS
Electron
gun
(B)
Negatively charged
accelerating
plates
Sample inlet
Fig. 9.11. Schematic diagrams of a Mass spectrometer.
Molecular Ion. The ionformedby removing one electronfrom theparent molecule is called
molecular ion orparent ion. The molecular ionpeak is usually representedas NT.Itmay or may not
be the peak of highest intensity. The molecular ion is the most important ion, since its mass is the
Molecular Weight ofthe parent molecule.
The use of mass spectroscopy is not limited to the determination of the molecular weight of
compounds. Italso has great utilityinthe elucidationofthe structure ofa molecule.The fragmentation
processes oforganic moleculesfollow certainpatterns inthat the fragments brokenoffarerelatedto
bond strengths and the stability of the species formed. Since certain structural features inmolecule
producedefinite characteristic fragmentation patterns, the identificationofthese fragments and their
relative intensities ina mass spectrum can beused to determine the structure of organic compounds.
The following examples illustrate how a mass spectrum can be used to determine the structure of
organic molecules:
Example 1. Let us consider the following isomers.
CH3CH2CH2CH2CH2CH2CH2CH3 n-Octane
ch3
CH3CH2CH2CHCH2CH2CH3 4-Methylheptane
77-Octane canbeeasily distinguishedfrom 4-methylheptane, since the methyl group branched at
C-4inthe lattercompound, is easily brokenoff"as CHĂż fragment and will give a peak oflargeintensity
at m/e= 15
Example 2. Consider the mass spectrum shown in Fig. 9.12. The fragmentation pattern and
relativeabundance ofpeaks isas follows.A molecular weight of32,whichcorresponds to 02,isruled
I
SPECTROSCOPY Ăż
185
out, since the only other possible fragment would be O with a peak ofrelatively high intensity at m/
e=b.Anm/epeak is present at a value of 16,but has a very low relative intensity,0.21. The peak at
m/e= 15 isdue to a CHt fragment, and the overall spectrum indicates an elemental composition of
CH40.Considerationofother peakspresent leads to the conclusionthat the moleculeproducingthis
spectrum ismethylalcohol (CH3OH).
100;
3 40
m/e Relative
abundance
12 0.32
13 0.72
14 2.4
15 1.3
16 0.21
17 1.0
28 6.3
29 64
30 3.8
31 100
32 66
33 0.98
34 0.14
Fig. 9.12. Mass spectrum of Methyl alcohol, CH3OH
SummaryofMassSpectroscopy
(1) Mass spectroscopy involves organic molecules being bombarded by a very high-energy
electronbeam.
(2) The peak ofhighest intensity in a mass spectrum is referred to as the base peak.
(3) Fragmentationprocesses can produce numerous fragments, from which the structures of
organic molecules can be deduced.
(4) When one electron is removedfrom a molecule,a molecular ion isproduced.Them/evalue
of the molecular ion peak is the molecular weight of the compound being investigated. The
molecular weights obtained by mass spectroscopy arc extremely accurate.
o Mass
|Spectrometer
Moleculefar,d Here
186" A TEXTBOOK OF ORGANIC CHEMISTRY
EXAMINATION QUESTIONS
1. (a) Explain why spectroscopic methods are increasingly used for structure determination of
organic compounds.
(b) What type of information one can obtain from : (/) IR spectrum ; (if) UV spectrum ;and
(/'/'/) NMR spectrum.
2. What type of molecular transitions are brought about by absorption of :
(a) Ultraviolet-visibleradiation
(b) Infraredradiation (PanjabBSc, 2003 ;DelhiBSc. 2005)
3. Write notes on :
(a) UV spectroscopy (Banaras BSc. 2001)
(b) IR spectroscopy (MadrasBSc, 2003)
(c) NMR spectroscopy (DelhiBSc, 2002 ;Jadavpur BSc. 2004)
4. Discuss the principle and applications of NMR spectroscopy in structure determination of
organic compounds. (HSGaur BSc. 2004)
5. What ismeantby the term ChemicalShiftofa particularproton inNMR spectroscopy ? Draw the
splitting patterns of protons in NMR spectrum of ethyl alcohol.
6. How will you distinguish between 1,3-pentadiene and 1,4-pcntadiene by UV spectroscopy ?
Answer. 1,3-Pentadiene will have higher max than 1,4-pcntadiene. This is because 1,3-Pcntadiene is
conjugated ;whereas 1,4-pentadiene is not.
7. How will you distinguish between benzene and anthracene by UV spectroscopy ?
(Bharathidasan BSc. 2004)
Answer. Anthracene will have higher max than benzene. This is because anthracene is more conjugated
than benzene.
8. A chemist prepared the two isomeric ketones (A ) and (B). placed them in separate flasks, but
forgot to label them. How could you differenciate the two by UV spectroscopy
O O
II II
ch3ch2ch=chcch3 ch3ch=chch2cch3
(A) (B)
Answer. In the UV spectra, (.4),a conjugated system, would show Xmax at higher wavelengths than (B),a
nonconjugatedcompound.
9. Two isomeric dienes (A) and (B) having the molecular formula CsHg absorb at 223 nm and
178 nm respectively. Write the structures of the two isomers.
Answer. (A) is CH2=CH-CH=CH-CH3 ; 1,3-Pentadiene
(B) is CH2=CH-CH2—CH=CH2 ; 1,4-Pentadiene
10. Arrange the following compounds inthe increasingorder of their UVabsorption maxima :
(a) Ethylene (b) Naphthalene (c) Anthracene (d) 1,3-Butadiene
Answer, (a) < (d) < (c) < (b)
11. How do you identify the following functional groups by IR spectroscopy :
(a) -OH (b) -NH2 (c) -CN (d) >C=0
12. Discuss the principle of IR spectroscopy. How will you distinguish between the following pairs
of compounds on the basis of IR spectroscopy :
(a) Ethyl alcohol anddiethyl ether
(b) Acetic acid andethyl acetate
Answer, (a) Ethyl alcohol shows a strong/broad absorption at 3200-3500 cm-1(due to O-Hbond) while
diethyl ether does not ; and (ft) Acetic acid shows a strong/broad absorption at 2500-3500 cm"1 (due to O-H
bond) while ethyl acetate docs not.
13. How would you distinguish between the following pairs of compounds by IR spectroscopy ?
(a) CH3CH2CH2N(CH3)2 and CH3CH2CH2NH2
(b) CH3CH2CH2COOH and CH3CH2COOCH3
(c) CH,CH2COCH3 and CH3CH2COOCH3
I
r
SPECTROSCOPY J 187
Answer, (a) CH3CH,CH:NH2 shows N-H absorption at 3300-3500 cm"1 while CH3CH2CHjN(CH,)2
does not.
(b) CHjCH2CH2COOHshows O-Habsorptionat 2500-3500cm 1
whileCH3CH2CH2COOCH3
does not.
(c) CH3CH2COOCH3 shows C-0 absorption at 1050-1350 cm1while CH3CH2COCH3 does
not.
14. Two compounds, (A) and (B), have the same molecular formula C2H60. They have different IR
spectra. Compound (A) shows a strong/broad absorption at 3400 cm"1, while compound (B) does not. Suggest
formulas for (A)and(B)which account for the difference.
Answer. (A) is ethyl alcohol (CH3CH2OH) ;(B) is dimethyl ether (CH3OCH3). The strong absorption at
3400 cm"1 in(A) is due to the O-Hbond.
15. Draw the structure of a compound with each of the following molecular formulas that will show
only one peak in its NMR spectrum :
(a) C3H$C12 (b) C5HI2 (c) CĂżO (d) C4H6
Answer. Possible structures are :
CI ch3
(a) CH3-C-CH3 (b) CH3-C-CH3
CI CH3
(c) CH3-O-CH3 (d) CH3CSCCH3
16. How many NMR signals do you expect from eachofthe following compounds. Indicatealso the
splitting pattern of the various signals.
(a) CH3OCH3 (*>) CH3OCH2CH3 (c) CH3CH2OH
Answer, (a) One signal(singlet) ; (b)Three signals (singlet,quartet,triplet) ;and(c)Twosignals (singlet,
quartet).
17. How many signals (ignoring the splitting patterns) would you see in the NMR spectra of the
following compounds ? (Saugar BSc, 2002)
(a) Butanone (b) Cyclobutane (c) Ăż-xylene (d) 2-Propanol
Answer, (a) Three signals ;(b) One signal ;(c) Two signals ;and (d) Three signals.
18. Predict the signal pattern of the CH3 protons in the NMR spectra of the following compounds.
O
II
(a) CH3CHBr2 (b) CH3—C-OH
OH
(c) CHaCHjBr (d) CH3-CH-CH3 (AllahabadBSc.2003)
Answer. Apply the (w + 1) rule, (a) The CH3 group has one neighboringproton and would therefore be
a doublet ;(b)The CH3group hasnoneighboringproton,andwould therefore beasinglet ;(c)The CH3group has
two neighboringequivalent protons andwould thereforebeatriplet ;and(d)The two CH3 groups are equivalent
and haveone neighboringproton. The CH3signal would therefore be a doublet.
19. The NMR spectrum of compound (A) C2H60, shows one signal only, a singlet. Deduce the
structure of (A). {CalicutBSc, 2004)
Answer. (A) is CH3-0-CH3
20. The NMR spectrum of compound {A), C5H]2, gives only one signal, a singlet. What is the
structure of (Ăż4)?
Answer. The molecular formula, C5H12, indicates that (/*) is an alkane. The single signal in the NMR
spectrum indicatesthat all hydrogensare equivalent. The only possibleC5H12 isomerthat fitsthe data is(CH3)4C
(2,2-Dimethylpropane).
21. The UV spectrum for a compound with formula C3H60 shows a weak absorption band at 280
nm. The NMR spectrum shows only one signal, a singlet. What is the structure of the compound ?
Answer. The weak UV absorption at 280 nm is characteristic ofa carbonyl group (C=0), leavingC2H6
for theremainder ofthe original formula. This suggests two CH3 groups. The structure ofacetone (CH3COCH3)
fits all the data.
v
188!A TEXTBOOK OFORGANIC CHEMISTRY
22. The NMR spectrum of a compound C4HqBr consists ofa single sharp line. What is the structure
of the compound ?
Answer. The compound is /er/-Butyl bromide, (CH3)3 CBr.
23. Suggest the structure of a compound each with the following NMR spectral features :
(a) An alcohol with two NMR peaks
(6) A compound C5Hj0 with a single NMR peak
(c) A compound C4H6 with a single NMRpeak.
Answer, (a) Methylalcohol ; (b) Cyclopentane : (c) 2-Butyne
24. How would you distinguish between the following pairs of compounds byNMR spectroscopy ?
O O
II II
(a) CH3-C-CH3 and CH3CH2-C-H
O 0
II II
(b) CH3—C—CH3 and CH3—C-OCH3 (PunjabBSc. 2005)
Answer, (a) CH3COCH3 will give only one signal, while CH3CH2CHO will give three signals; and
(b) CH3COCH3will give only one signal, while CH3COOCH3will give two signals.
25. How will you distinguish between the three dibromobenzenes by their NMR spectra.
(Visva BhartiBSc, 2003)
Answer. o-Dibromobenzene will show two peaks ;w-dibromobenzene will show three peaks ; and
p-dibromobenzenewill show only one peak.
Br Br
V a
Br
Qr*b a c b
o-Dibromobenzene m-Dibromobenzene p-Dibromobenzene
(two peaks) (three peaks) (one peak)
1:1 1:2:1
26. Give a structure consistent with the following NMR data :
Molecularformula =C3HsCl3
(a) Singletat 82.20, 3H (b) Singlet at 64.02, 2H
b a
Answer. The compound is CH2C1—CCI2—CH3
27. Give a structure consistent with the following NMR data : Molecular formula = Ci0H14
(a) Singlet at 5 1.30,9H (A) Singlet at 5 7.28,5H
Answer. The compound is :
fert-Butylbenzene
CH3Ăż
28. Suggest a structure consistent with the following NMR data :Molecular formula = CĂżHĂż
(a) Singlet at 86.78, 3// (A) Singlet at 82.25, 9H (MysoreBSc.2004)
Answer. The compound is :
Mesitylene
CH) a
r
Alkanes
<4-
«* C
C C
j5,il.K '*!Ăż 1
loĂż 3UTANE
mFUEL ;
A:
Butaneisusedasafuelinlighters. Itisalsousedinsamecamping stoves.
lkanes are the simplest organic compounds made of carbon and hydrogen only. They have
the general formula C„H2*+2where n= 1,2,3etc. The first three members ofthis class can be
represented as :
H H H
H—C-
I
H
-H H-C
I
H
-C—H
Methane
H
Ethane
H H H
I I I
H—C—C—C—H
I I I
H H H
Propane
The carbon atoms intheir moleculesare bondedto each other by single covalent bonds. Each carbon
is again bonded to enough hydrogen atoms to give maximum covalence of 4. Since the carbon
skeletonofalkanes isfully 'saturated' with hydrogens,they are also calledSaturated Hydrocarbons.
Alkanes containstrongC—C andC—Hcovalent bonds.Therefore, this class ofhydrocarbons are
relatively chemically inert. Hencethey are sometimes referredto as Paraffins(Latin,parumaffinis=
littleaffinity).
STRUCTURE
Let us consider methane (CH4) and ethane (CH3—CH3) for illustrating the orbital make up of
alkanes. Inmethane, carbon forms single bonds with four hydrogen atoms. Since the carbon atom is
attached to four other atoms, it uses spl hybrid orbitals to form these bonds. Each C-H bond is the
resultofthe overlap ofansp3 orbitalfrom carbonand ans orbital from hydrogen(Fig. 10.1).All C—H
bonds are a bonds.

More Related Content

What's hot

C-13 NMR Spectroscopy ppt(10 Minute explanation)
C-13 NMR Spectroscopy ppt(10 Minute explanation)C-13 NMR Spectroscopy ppt(10 Minute explanation)
C-13 NMR Spectroscopy ppt(10 Minute explanation)Madhav Ingalageri
 
Conformational analysis of medium rings
Conformational analysis of medium ringsConformational analysis of medium rings
Conformational analysis of medium ringsPRUTHVIRAJ K
 
Analysis of aspirin with IR
Analysis of aspirin with IRAnalysis of aspirin with IR
Analysis of aspirin with IRSagarTarapure
 
C13 NUCLEAR MAGNETIC RESONANCE
C13 NUCLEAR MAGNETIC RESONANCE C13 NUCLEAR MAGNETIC RESONANCE
C13 NUCLEAR MAGNETIC RESONANCE Sujitlal Bhakta
 
Basic principle of IR spectroscoy
Basic principle of IR spectroscoy Basic principle of IR spectroscoy
Basic principle of IR spectroscoy faysalahmed35
 
Polarography
PolarographyPolarography
Polarographysai sree
 
Theories of chromatography
Theories of chromatographyTheories of chromatography
Theories of chromatographyKhalid Hussain
 
Proton NMR
Proton NMRProton NMR
Proton NMRRafa Zubair
 
Factors are affecting the chemical shift values nmr spectra
Factors are affecting the chemical shift values   nmr spectraFactors are affecting the chemical shift values   nmr spectra
Factors are affecting the chemical shift values nmr spectraganapathimurugan1
 
Fragmentation Pattern of Mass Spectrometry
Fragmentation Pattern of Mass SpectrometryFragmentation Pattern of Mass Spectrometry
Fragmentation Pattern of Mass SpectrometryAshwani Dhingra
 
Ion exchange chromatography
Ion exchange chromatographyIon exchange chromatography
Ion exchange chromatographyAlay Desai
 
Infrared Spectroscopy (IR) - Overview & Interpretation
Infrared Spectroscopy (IR) - Overview & InterpretationInfrared Spectroscopy (IR) - Overview & Interpretation
Infrared Spectroscopy (IR) - Overview & InterpretationManoj Prajapati
 
Nmr spin spin coupling
Nmr spin spin couplingNmr spin spin coupling
Nmr spin spin couplingArpitSuralkar
 
Organometallic catalysis
Organometallic catalysisOrganometallic catalysis
Organometallic catalysisBISWAJIT MORAN
 
Hydrogenation, catalytic hydrogenation
Hydrogenation, catalytic hydrogenationHydrogenation, catalytic hydrogenation
Hydrogenation, catalytic hydrogenationAishwaryaRajput8
 
Nmr spltting pattern
Nmr spltting patternNmr spltting pattern
Nmr spltting patternsiraj174
 

What's hot (20)

C-13 NMR Spectroscopy ppt(10 Minute explanation)
C-13 NMR Spectroscopy ppt(10 Minute explanation)C-13 NMR Spectroscopy ppt(10 Minute explanation)
C-13 NMR Spectroscopy ppt(10 Minute explanation)
 
Conformational analysis of medium rings
Conformational analysis of medium ringsConformational analysis of medium rings
Conformational analysis of medium rings
 
Analysis of aspirin with IR
Analysis of aspirin with IRAnalysis of aspirin with IR
Analysis of aspirin with IR
 
C13 NUCLEAR MAGNETIC RESONANCE
C13 NUCLEAR MAGNETIC RESONANCE C13 NUCLEAR MAGNETIC RESONANCE
C13 NUCLEAR MAGNETIC RESONANCE
 
Basic principle of IR spectroscoy
Basic principle of IR spectroscoy Basic principle of IR spectroscoy
Basic principle of IR spectroscoy
 
Mass spectroscopy
Mass spectroscopyMass spectroscopy
Mass spectroscopy
 
Polarography
PolarographyPolarography
Polarography
 
M.Sc. 13 c nmr
M.Sc. 13 c nmrM.Sc. 13 c nmr
M.Sc. 13 c nmr
 
Theories of chromatography
Theories of chromatographyTheories of chromatography
Theories of chromatography
 
Proton NMR
Proton NMRProton NMR
Proton NMR
 
Factors are affecting the chemical shift values nmr spectra
Factors are affecting the chemical shift values   nmr spectraFactors are affecting the chemical shift values   nmr spectra
Factors are affecting the chemical shift values nmr spectra
 
Fragmentation Pattern of Mass Spectrometry
Fragmentation Pattern of Mass SpectrometryFragmentation Pattern of Mass Spectrometry
Fragmentation Pattern of Mass Spectrometry
 
Ion exchange chromatography
Ion exchange chromatographyIon exchange chromatography
Ion exchange chromatography
 
Double resonance
Double resonanceDouble resonance
Double resonance
 
Infrared Spectroscopy (IR) - Overview & Interpretation
Infrared Spectroscopy (IR) - Overview & InterpretationInfrared Spectroscopy (IR) - Overview & Interpretation
Infrared Spectroscopy (IR) - Overview & Interpretation
 
Nmr spin spin coupling
Nmr spin spin couplingNmr spin spin coupling
Nmr spin spin coupling
 
Organometallic catalysis
Organometallic catalysisOrganometallic catalysis
Organometallic catalysis
 
Hydrogenation, catalytic hydrogenation
Hydrogenation, catalytic hydrogenationHydrogenation, catalytic hydrogenation
Hydrogenation, catalytic hydrogenation
 
Nmr spltting pattern
Nmr spltting patternNmr spltting pattern
Nmr spltting pattern
 
Two dimensional nmr
Two dimensional nmrTwo dimensional nmr
Two dimensional nmr
 

Similar to Spectroscopy chapter 9 textbook of organic chemistry arun bahl-

Compiled presentations MOS
Compiled presentations MOSCompiled presentations MOS
Compiled presentations MOSRoman Hodson
 
Instrumental and Modern methods.ppt
Instrumental and Modern methods.pptInstrumental and Modern methods.ppt
Instrumental and Modern methods.pptBlackStunnerjunior
 
IR Spectra Interpretation
IR Spectra InterpretationIR Spectra Interpretation
IR Spectra InterpretationGanesh Shinde
 
Absorption spectroscopy
Absorption spectroscopyAbsorption spectroscopy
Absorption spectroscopymedicalmentor
 
Infrared presentation
Infrared presentationInfrared presentation
Infrared presentationShiv Kumar
 
Ultraviolet visible (uv vis) spectroscopy Likhith K
Ultraviolet visible (uv vis) spectroscopy Likhith KUltraviolet visible (uv vis) spectroscopy Likhith K
Ultraviolet visible (uv vis) spectroscopy Likhith KLIKHITHK1
 
Spectrometry
SpectrometrySpectrometry
SpectrometryAhmed Ragab
 
INTERPRETATION OF IR SPECTROSCOPY
INTERPRETATION OF IR SPECTROSCOPYINTERPRETATION OF IR SPECTROSCOPY
INTERPRETATION OF IR SPECTROSCOPYOORATHI SASIVARDHAN
 
IR Spectroscopy_2022.pptx
IR Spectroscopy_2022.pptxIR Spectroscopy_2022.pptx
IR Spectroscopy_2022.pptxmichelle894942
 
CRCL Officers Presentation UV-Vis
CRCL Officers Presentation UV-VisCRCL Officers Presentation UV-Vis
CRCL Officers Presentation UV-VisK Thambi durai
 
12 02-09-12-24-23-1390-sampathkumar
12 02-09-12-24-23-1390-sampathkumar12 02-09-12-24-23-1390-sampathkumar
12 02-09-12-24-23-1390-sampathkumarDONIKAMARKANDE
 
Ir spectroscopy PRESENTED BY DIPSANKAR
Ir spectroscopy     PRESENTED BY DIPSANKAR Ir spectroscopy     PRESENTED BY DIPSANKAR
Ir spectroscopy PRESENTED BY DIPSANKAR Dipsankar Bera
 
Theory of IR spectroscopy
Theory of IR spectroscopy Theory of IR spectroscopy
Theory of IR spectroscopy Sanathoiba Singha
 
Application of ir
Application of irApplication of ir
Application of irjoan vijetha
 
78298077-Ir-Application.ppt
78298077-Ir-Application.ppt78298077-Ir-Application.ppt
78298077-Ir-Application.pptArun Nt
 
Elementary organic spectroscopy
Elementary organic spectroscopyElementary organic spectroscopy
Elementary organic spectroscopylsk1976
 
Spectroscopy
SpectroscopySpectroscopy
SpectroscopyArpit Modh
 

Similar to Spectroscopy chapter 9 textbook of organic chemistry arun bahl- (20)

Ch13.ppt
Ch13.pptCh13.ppt
Ch13.ppt
 
Compiled presentations MOS
Compiled presentations MOSCompiled presentations MOS
Compiled presentations MOS
 
Instrumental and Modern methods.ppt
Instrumental and Modern methods.pptInstrumental and Modern methods.ppt
Instrumental and Modern methods.ppt
 
IR Spectra Interpretation
IR Spectra InterpretationIR Spectra Interpretation
IR Spectra Interpretation
 
Absorption spectroscopy
Absorption spectroscopyAbsorption spectroscopy
Absorption spectroscopy
 
Infrared presentation
Infrared presentationInfrared presentation
Infrared presentation
 
Ultraviolet visible (uv vis) spectroscopy Likhith K
Ultraviolet visible (uv vis) spectroscopy Likhith KUltraviolet visible (uv vis) spectroscopy Likhith K
Ultraviolet visible (uv vis) spectroscopy Likhith K
 
Spectrometry
SpectrometrySpectrometry
Spectrometry
 
INTERPRETATION OF IR SPECTROSCOPY
INTERPRETATION OF IR SPECTROSCOPYINTERPRETATION OF IR SPECTROSCOPY
INTERPRETATION OF IR SPECTROSCOPY
 
IR Spectroscopy_2022.pptx
IR Spectroscopy_2022.pptxIR Spectroscopy_2022.pptx
IR Spectroscopy_2022.pptx
 
CRCL Officers Presentation UV-Vis
CRCL Officers Presentation UV-VisCRCL Officers Presentation UV-Vis
CRCL Officers Presentation UV-Vis
 
Infrared spectroscopy2
Infrared spectroscopy2Infrared spectroscopy2
Infrared spectroscopy2
 
12 02-09-12-24-23-1390-sampathkumar
12 02-09-12-24-23-1390-sampathkumar12 02-09-12-24-23-1390-sampathkumar
12 02-09-12-24-23-1390-sampathkumar
 
Vijay seminor ..analysis
Vijay seminor ..analysisVijay seminor ..analysis
Vijay seminor ..analysis
 
Ir spectroscopy PRESENTED BY DIPSANKAR
Ir spectroscopy     PRESENTED BY DIPSANKAR Ir spectroscopy     PRESENTED BY DIPSANKAR
Ir spectroscopy PRESENTED BY DIPSANKAR
 
Theory of IR spectroscopy
Theory of IR spectroscopy Theory of IR spectroscopy
Theory of IR spectroscopy
 
Application of ir
Application of irApplication of ir
Application of ir
 
78298077-Ir-Application.ppt
78298077-Ir-Application.ppt78298077-Ir-Application.ppt
78298077-Ir-Application.ppt
 
Elementary organic spectroscopy
Elementary organic spectroscopyElementary organic spectroscopy
Elementary organic spectroscopy
 
Spectroscopy
SpectroscopySpectroscopy
Spectroscopy
 

Recently uploaded

Employee wellbeing at the workplace.pptx
Employee wellbeing at the workplace.pptxEmployee wellbeing at the workplace.pptx
Employee wellbeing at the workplace.pptxNirmalaLoungPoorunde1
 
Call Girls in Dwarka Mor Delhi Contact Us 9654467111
Call Girls in Dwarka Mor Delhi Contact Us 9654467111Call Girls in Dwarka Mor Delhi Contact Us 9654467111
Call Girls in Dwarka Mor Delhi Contact Us 9654467111Sapana Sha
 
History Class XII Ch. 3 Kinship, Caste and Class (1).pptx
History Class XII Ch. 3 Kinship, Caste and Class (1).pptxHistory Class XII Ch. 3 Kinship, Caste and Class (1).pptx
History Class XII Ch. 3 Kinship, Caste and Class (1).pptxsocialsciencegdgrohi
 
Computed Fields and api Depends in the Odoo 17
Computed Fields and api Depends in the Odoo 17Computed Fields and api Depends in the Odoo 17
Computed Fields and api Depends in the Odoo 17Celine George
 
Kisan Call Centre - To harness potential of ICT in Agriculture by answer farm...
Kisan Call Centre - To harness potential of ICT in Agriculture by answer farm...Kisan Call Centre - To harness potential of ICT in Agriculture by answer farm...
Kisan Call Centre - To harness potential of ICT in Agriculture by answer farm...Krashi Coaching
 
“Oh GOSH! Reflecting on Hackteria's Collaborative Practices in a Global Do-It...
“Oh GOSH! Reflecting on Hackteria's Collaborative Practices in a Global Do-It...“Oh GOSH! Reflecting on Hackteria's Collaborative Practices in a Global Do-It...
“Oh GOSH! Reflecting on Hackteria's Collaborative Practices in a Global Do-It...Marc Dusseiller Dusjagr
 
Hybridoma Technology ( Production , Purification , and Application )
Hybridoma Technology  ( Production , Purification , and Application  ) Hybridoma Technology  ( Production , Purification , and Application  )
Hybridoma Technology ( Production , Purification , and Application ) Sakshi Ghasle
 
Introduction to ArtificiaI Intelligence in Higher Education
Introduction to ArtificiaI Intelligence in Higher EducationIntroduction to ArtificiaI Intelligence in Higher Education
Introduction to ArtificiaI Intelligence in Higher Educationpboyjonauth
 
How to Make a Pirate ship Primary Education.pptx
How to Make a Pirate ship Primary Education.pptxHow to Make a Pirate ship Primary Education.pptx
How to Make a Pirate ship Primary Education.pptxmanuelaromero2013
 
Crayon Activity Handout For the Crayon A
Crayon Activity Handout For the Crayon ACrayon Activity Handout For the Crayon A
Crayon Activity Handout For the Crayon AUnboundStockton
 
Enzyme, Pharmaceutical Aids, Miscellaneous Last Part of Chapter no 5th.pdf
Enzyme, Pharmaceutical Aids, Miscellaneous Last Part of Chapter no 5th.pdfEnzyme, Pharmaceutical Aids, Miscellaneous Last Part of Chapter no 5th.pdf
Enzyme, Pharmaceutical Aids, Miscellaneous Last Part of Chapter no 5th.pdfSumit Tiwari
 
How to Configure Email Server in Odoo 17
How to Configure Email Server in Odoo 17How to Configure Email Server in Odoo 17
How to Configure Email Server in Odoo 17Celine George
 
POINT- BIOCHEMISTRY SEM 2 ENZYMES UNIT 5.pptx
POINT- BIOCHEMISTRY SEM 2 ENZYMES UNIT 5.pptxPOINT- BIOCHEMISTRY SEM 2 ENZYMES UNIT 5.pptx
POINT- BIOCHEMISTRY SEM 2 ENZYMES UNIT 5.pptxSayali Powar
 
The Most Excellent Way | 1 Corinthians 13
The Most Excellent Way | 1 Corinthians 13The Most Excellent Way | 1 Corinthians 13
The Most Excellent Way | 1 Corinthians 13Steve Thomason
 
ECONOMIC CONTEXT - LONG FORM TV DRAMA - PPT
ECONOMIC CONTEXT - LONG FORM TV DRAMA - PPTECONOMIC CONTEXT - LONG FORM TV DRAMA - PPT
ECONOMIC CONTEXT - LONG FORM TV DRAMA - PPTiammrhaywood
 
Biting mechanism of poisonous snakes.pdf
Biting mechanism of poisonous snakes.pdfBiting mechanism of poisonous snakes.pdf
Biting mechanism of poisonous snakes.pdfadityarao40181
 
Sanyam Choudhary Chemistry practical.pdf
Sanyam Choudhary Chemistry practical.pdfSanyam Choudhary Chemistry practical.pdf
Sanyam Choudhary Chemistry practical.pdfsanyamsingh5019
 
भारत-रोम व्यापार.pptx, Indo-Roman Trade,
भारत-रोम व्यापार.pptx, Indo-Roman Trade,भारत-रोम व्यापार.pptx, Indo-Roman Trade,
भारत-रोम व्यापार.pptx, Indo-Roman Trade,Virag Sontakke
 

Recently uploaded (20)

Employee wellbeing at the workplace.pptx
Employee wellbeing at the workplace.pptxEmployee wellbeing at the workplace.pptx
Employee wellbeing at the workplace.pptx
 
Call Girls in Dwarka Mor Delhi Contact Us 9654467111
Call Girls in Dwarka Mor Delhi Contact Us 9654467111Call Girls in Dwarka Mor Delhi Contact Us 9654467111
Call Girls in Dwarka Mor Delhi Contact Us 9654467111
 
History Class XII Ch. 3 Kinship, Caste and Class (1).pptx
History Class XII Ch. 3 Kinship, Caste and Class (1).pptxHistory Class XII Ch. 3 Kinship, Caste and Class (1).pptx
History Class XII Ch. 3 Kinship, Caste and Class (1).pptx
 
Model Call Girl in Tilak Nagar Delhi reach out to us at 🔝9953056974🔝
Model Call Girl in Tilak Nagar Delhi reach out to us at 🔝9953056974🔝Model Call Girl in Tilak Nagar Delhi reach out to us at 🔝9953056974🔝
Model Call Girl in Tilak Nagar Delhi reach out to us at 🔝9953056974🔝
 
Computed Fields and api Depends in the Odoo 17
Computed Fields and api Depends in the Odoo 17Computed Fields and api Depends in the Odoo 17
Computed Fields and api Depends in the Odoo 17
 
Kisan Call Centre - To harness potential of ICT in Agriculture by answer farm...
Kisan Call Centre - To harness potential of ICT in Agriculture by answer farm...Kisan Call Centre - To harness potential of ICT in Agriculture by answer farm...
Kisan Call Centre - To harness potential of ICT in Agriculture by answer farm...
 
“Oh GOSH! Reflecting on Hackteria's Collaborative Practices in a Global Do-It...
“Oh GOSH! Reflecting on Hackteria's Collaborative Practices in a Global Do-It...“Oh GOSH! Reflecting on Hackteria's Collaborative Practices in a Global Do-It...
“Oh GOSH! Reflecting on Hackteria's Collaborative Practices in a Global Do-It...
 
Hybridoma Technology ( Production , Purification , and Application )
Hybridoma Technology  ( Production , Purification , and Application  ) Hybridoma Technology  ( Production , Purification , and Application  )
Hybridoma Technology ( Production , Purification , and Application )
 
Introduction to ArtificiaI Intelligence in Higher Education
Introduction to ArtificiaI Intelligence in Higher EducationIntroduction to ArtificiaI Intelligence in Higher Education
Introduction to ArtificiaI Intelligence in Higher Education
 
How to Make a Pirate ship Primary Education.pptx
How to Make a Pirate ship Primary Education.pptxHow to Make a Pirate ship Primary Education.pptx
How to Make a Pirate ship Primary Education.pptx
 
Staff of Color (SOC) Retention Efforts DDSD
Staff of Color (SOC) Retention Efforts DDSDStaff of Color (SOC) Retention Efforts DDSD
Staff of Color (SOC) Retention Efforts DDSD
 
Crayon Activity Handout For the Crayon A
Crayon Activity Handout For the Crayon ACrayon Activity Handout For the Crayon A
Crayon Activity Handout For the Crayon A
 
Enzyme, Pharmaceutical Aids, Miscellaneous Last Part of Chapter no 5th.pdf
Enzyme, Pharmaceutical Aids, Miscellaneous Last Part of Chapter no 5th.pdfEnzyme, Pharmaceutical Aids, Miscellaneous Last Part of Chapter no 5th.pdf
Enzyme, Pharmaceutical Aids, Miscellaneous Last Part of Chapter no 5th.pdf
 
How to Configure Email Server in Odoo 17
How to Configure Email Server in Odoo 17How to Configure Email Server in Odoo 17
How to Configure Email Server in Odoo 17
 
POINT- BIOCHEMISTRY SEM 2 ENZYMES UNIT 5.pptx
POINT- BIOCHEMISTRY SEM 2 ENZYMES UNIT 5.pptxPOINT- BIOCHEMISTRY SEM 2 ENZYMES UNIT 5.pptx
POINT- BIOCHEMISTRY SEM 2 ENZYMES UNIT 5.pptx
 
The Most Excellent Way | 1 Corinthians 13
The Most Excellent Way | 1 Corinthians 13The Most Excellent Way | 1 Corinthians 13
The Most Excellent Way | 1 Corinthians 13
 
ECONOMIC CONTEXT - LONG FORM TV DRAMA - PPT
ECONOMIC CONTEXT - LONG FORM TV DRAMA - PPTECONOMIC CONTEXT - LONG FORM TV DRAMA - PPT
ECONOMIC CONTEXT - LONG FORM TV DRAMA - PPT
 
Biting mechanism of poisonous snakes.pdf
Biting mechanism of poisonous snakes.pdfBiting mechanism of poisonous snakes.pdf
Biting mechanism of poisonous snakes.pdf
 
Sanyam Choudhary Chemistry practical.pdf
Sanyam Choudhary Chemistry practical.pdfSanyam Choudhary Chemistry practical.pdf
Sanyam Choudhary Chemistry practical.pdf
 
भारत-रोम व्यापार.pptx, Indo-Roman Trade,
भारत-रोम व्यापार.pptx, Indo-Roman Trade,भारत-रोम व्यापार.pptx, Indo-Roman Trade,
भारत-रोम व्यापार.pptx, Indo-Roman Trade,
 

Spectroscopy chapter 9 textbook of organic chemistry arun bahl-

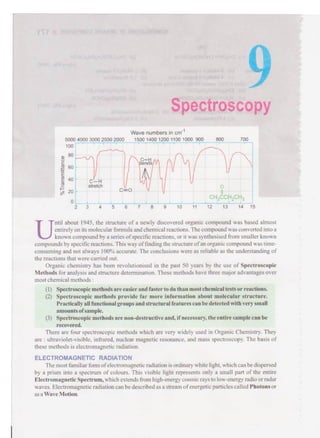
  • 1. Spectroscopy C-H stretch Wave numbers in cm"1 5000 4000 3000 2500 2000 1500 1400 1200 1100 1000 900 800 4 r/ 700 0 ch3cch2ch3 2 3 4 5 6 7 8 9 10 11 12 13 14 15 ntil about 1945, the structure of a newly discovered organic compound was based almost entirely on itsmolecular formula andchemicalreactions.The compoundwas convertedinto a knowncompound by a series ofspecific reactions,or it was synthesised from smaller known compoundsby specific reactions.This way offinding the structure ofan organic compoundwas time- consuming and not always 100% accurate. The conclusions were as reliable as the understanding of the reactions that were carried out. Organic chemistry has been revolutionised in the past 50 years by the use of Spectroscopic Methods for analysis and structure determination. These methods have three major advantages over most chemical methods : (1) Spectroscopic methods are easier and faster to do than mostchemicaltests or reactions. (2) Spectroscopic methods provide far more information about molecular structure. Practicallyallfunctional groups andstructural features can bedetectedwithvery small amounts ofsample. (3) Spectroscopic methods are non-destructive and,ifnecessary,the entiresample can be There are four spectroscopic methods which are very widely used in Organic Chemistry. They are :ultraviolet-visible, infrared, nuclear magnetic resonance, and mass spectroscopy. The basis of these methods is electromagnetic radiation. ELECTROMAGNETIC RADIATION The most familiar form ofelectromagneticradiation is ordinary white light,which canbedispersed by a prism into a spectrum of colours. This visible light represents only a small part of the entire Electromagnetic Spectrum,which extends fromhigh-energycosmic raysto low-energy radioor radar waves. Electromagnetic radiationcan bedescribed as a stream ofenergetic particles called Photonsor as aWave Motion. recovered.
  • 2. SPECTROSCOPY Ăż 173 ESE8Z2 10"Hz 10'5Hz 1010Hz Cosmic X-rays (UV) (UV) (Vis) (IR) (IR) Microwave and Vacuum Near Visible Near Infrared and 7-rays ultraviolet ultraviolet infrared radio 0.1 nm 11m ouvim 2 »im 50 nm Fig. 9.1. Electromagnetic spectrum. The fundamental equations of electromagnetic radiationare : E= hv and vA =c where E is the energy of radiation, h is Planck's constant, v (pronounced as nu) is the frequency of radiation, A (pronounced as lambda) is the wavelength ofthe radiation, andc isthe velocity of light which isconstant. Since v and A arc relatedbya constant (c),the energy of radiationcan be described by either frequency or the wavelength. Fig. 9.1 shows the various components of the electromagnetic spectrum. Inorganic chemistry, the importantwavelength regions are the ultraviolet,visible, and infrared. The ultraviolet and visible regions are adjacent, and the boundry is somewhat arbitrary since it depends upon humanperceptionoflight.The commonlyusedunitfor wavelength inthisregion isthe Nanometer ( 1 nm= 10~9 meter =0.1A, angstrom).The infraredregionisat longer wavelengths (lower energy,sinceE=heIX).Forthis region,the scalcmaybe expressedinwavelength (microns,[!)or Wave Number. The latter is generally preferred. The wave number is the reciprocal of the wavelength in centimetres. PRINCIPLEOF SPECTROSCOPY All organic compounds interact with electromagnetic radiation, that is, they absorb energy. When a moleculeabsorbs energy,a transformation occursthat may becither temporary or permanent. Lower-energy radiation may cause a molecularrotationor a bondvibration. Higher-energy radiation may cause the promotion of electrons to higher energy levels or bond clcavagc. Whether the transformation involvesmolecular rotation,bondvibration, or electronic transition. the molecule absorbs only the wavelength of radiation with exactly the energy necessary for the transition. The absorption of wavelengths of radiation is selective for a particular transition which depends on the structure ofthe molecule.By measuringthe absorptionspectra of knowncompounds. we can correlate the wavelengths of energy absorbed with characteristic structural features. This information is then used to determine the structure of unknown compounds. SPECTROPHOTOMETER The instrument that is used to measure the amount ofelectromagnetic radiation absorbed by an organic moleculeiscalled Spectrophotometer or Spectrometer. Itconsistsofa lightsource ofradiation. with a prism that can select the desired wavelengths, which are passed through a sample of the compoundbeinginvestigated(Fig.9.2). The radiationthat isabsorbed bythe sample can be detected, analysed, and recorded. The recording is called the Spectrum of the compound. I I
  • 3. 174Ăż A TEXTBOOK OF ORGANIC CHEMISTRY ivd_ Light Prism source selector Sample Detector Recorder Fig. 9.2. Basic components of a spectrophotometer. INFRARED SPECTROSCOPY An infrared(IR) spectrometer subjects a compound to infrared radiation in the 5000-667 cm'1 (2|im) range. Although this radiation is weak, it does supply sufficient energy for bonds in the moleculeto vibrate by Stretchingor Bending(Fig.9.3).The atoms ofamoleculecanbeconsideredas linkedby springs that are set inmotion by the applicationof energy. As the molecule is subjected to the individual wavelengths in the 5000-667 cm"1 range, it absorbs only those possessing exactly the energy requiredto cause a particular vibration. Energy absorptions are recorded as bands (peaks) on V V V V »Stretching vibrations Bending vibrations Fig. 9.3. Molecular vibrations caused by infrared radiation. Since different bonds andfunctional groups absorb at different wavelengths, an infraredspectrum is used to determine the structure of organic molecules. For example, carbon-carbon triple-bond is stronger than a carbon-carbon double bond and requires a shorter wavelength (greater energy) to stretch. The same considerations apply to carbon-oxygen and carbon-nitrogen bonds. C=C 2100-2200cm c=c 1620-1680cm ri C=0 1690-1750cm C—O 1050 1400an C=N 2210-2260cm"1 C—N 1050-1400cm1 Thus, from the positionofan absorption peak,one can identify the group that caused it.Fig. 9.4 shows the general areas in which various bonds absorb in the infrared. Wavelength (jam) 2 100 . I o 80 .1 I60 c CO i<0 iX 20 "T1"" N — H O— C 3.5 4 4.5 5 5.5 6 6.5 7 8 9 10 11 12 14 16 1" ' C =r C c3n h°HN C =N T ĂżJ—1—i—i — C ~C :C~0 C N Fingerprint rQgioft P i Ăż T .4000 3500 3000 2500 2000 1800 1600 1400 1200 1000 800 600 Wavelength (cm ') Fig. 9.4. Area of absorption for various bonds in the infrared.
  • 4. SPECTROSCOPY Ăż 175 (B> (C) Fig. 9.5. bend ĂżC —H stretchOH J stretch CO stretch An infrared spectrum is usually studied in two sections : (1) FunctionalGroup Region.The area from 5000cm'1to 1300cm"1iscalledthe functional group region. The bands in this region are particularly useful in determining the type of functional groups present in the molecule. (2) Fingerprint Region.The area from 1300 cm"1to 667 cm"1iscalledthe fingerprint region. A peak-by-peak match ofan unknown spectrum with the spectrum of the suspected compound in this regioncan be used, muchlikea fingerprint, to confirm itsidentity.Table 9.1shows some characteristic infrared absorptionbands. Fig. 9.5 shows some examples ofinfrared spectra. Wave numbers in cm"1 5000 4000 3000 2500 2000 1500 1400 1200 1100 1000 900 800 700 100 s ......- TT Ăż Wave length in microns stretch Wave numbers in cm"1 Wave length in microns stretch C-H bends (isopropyl) bends Hstretch 5000 4000 Wave numbers in cm"1 1100 1000 900 bends KCHoNHo_I _— L -ÂŁ 2 3 4 5 6 7 8 9 10 11 12 13 14 15 Some examples of IR spectra. (A) is Methanol. (B) is Butanone. (C) is Isobutylamine.
  • 5. 176Ăż A TEXTBOOK OF ORGANIC CHEMISTRY Table 9.1 :SOME CHARACTERISTIC IR ABSORPTION BANDS Range incm'1 Bond(Remarks) 1050-1400 C-0 (inethers, alcohols, esters) 1050-1400 C-N (inamines) 1315-1475 C-H (inalkanes) 1340-1500 no2 (two peaks) 1450-1600 c=c (inaromatic rings :several peaks) 1620-1680 C=C (inalkenes) 1630-1690 C=0 (inamides) 1690-1750 C=0 aldehydes, ketones, esters) 1700-1725 c=o (incarboxylic acids) 1770-1820 c=o (inacidchlorides) 2100-2200 Cs=C 2210-2260 C=N 2500 S-H 2700-2800 C-H (ofaldehyde group) 2500-3000 O-H (of COOH group) 3000-3100 C-H (C is part ofaromatic ring) 3330 C-H (C is part of OC) 3020-3080 C-H (C is part of C=C) 2800-3000 C-H (inalkanes) 3300-3500 N-H (inamines,amides) 3200-3600 O-H (in H-bonded ROH) 3600-3650 O-H Summary of IRSpectroscopy (1)Absorption ofinfraredradiationcauses covalent bonds within the moleculeto be promoted from one vibrational energy level to a higher vibrational energy level. (2) Stronger bonds require greater energy to vibrate (stretch or bend). Therefore, such bonds absorb infrared radiation ofshorter wavelengths. (3) Different functional groups absorb infrared radiation at different wavelengths, and their presence or absence ina moleculecan be determined by examination ofan IR spectrum. (4) No two compounds have exactly identical infrared spectTa. ULTRAVIOLET-VISIBLE SPECTROSCOPY Inultraviolet-visible(UV-Vis)spectroscopy, the 200-750 nmregionofthe ultravioletspectrum is used. This includes both the visible region (400-750 nm) and near ultraviolet region (200-400 nm). Radiation of these wavelengths is sufficiently energetic to cause the promotion of loosely held electrons, such as nonbonding electrons or electrons involved in a 7i-bond to higher energy levels. For absorption inthis particular regionofultravioletspectrum, the moleculemust contain conjugated double bonds. Ifthe conjugation is extensive, the molecule will absorb inthe visible region. The ultraviolet-visiblespectrum is composedofonly a few broadbands ofabsorption(Fig.9.6). The wavelength ofmaximumabsorbance isreferredto as The following pointsshouldbekeptin mindwhile interpretinga UV-Visspectrum. (1) Nonconjugatedalkenesshow an intenseabsorption below200nmandistherefore inaccessible to most commonly usedUV spectrometers. Forexample,ethylenehas =171nm.This absorption comes from the light-inducedpromotionofa 7c-electronto the next higher energy level. I
  • 6. SPECTROSCOPY. Ăż 177 .....V -I .. ' )iM|m IO' Ăż - / j --f- I 200 400 600 750 nm Fig. 9.6. A sample UV-Vis spectrum. (2) Nonconjugatedcarbonyl compounds have a very weak absorption band in the 200-300 nm region.This bandarises fromexcitationofone ofthe nonbondingelectrons(fromanunsharedpair)to the next higherenergy level.For example, O ii ch3—c—ch3 a0Acetone Cydohexanone 279 nm 291 nm (3) When a moleculecontains two or morenonconjugatedcarbon-carbondoublebonds,the UV spectrum isthat expectedofa simple alkene. However,when the doublebonds are conjugated, /™ax is shifted to longer wavelengths. For example, ch2=ch—ch2—ch2—ch=ch2 ch3ch=ch—ch=chch3 1,5-Hexadiene 2,4-Hexadiene 178 nm 227 nm (4) Conjugation of a carbon-carbon double bond and a carbonyl group shifts the Ama* of both groups to longer wavelengths. For example, (CH3)2C=CH—CH2CH3 180 nm O II (CH3)2CH—CH2—C—CH3 283 nm O (CH3)2C=CH—C—CH3 230 nm ( for C=C) 327 nm ( for C=0) (5) As the number ofdouble bonds inconjugationincreases, A,max also increases. For example, ch2=ch—ch=ch2 1,3-Butadiene Benzene 215 nm 257 nm Summary-ofUV-VisSpectroscopy (1) Absorptionofultraviolet-visibleradiation(200-700nm)causes electrons withinmolecules to be promoted from one energy level to a higher electronic energy level. (2) Ifan organic compound does not absorb UV-Vis radiation, it means that the compound does not contain conjugated double bonds. (3) Ifan organic compoundabsorbs UV-Visradiation, it means that the compoundcontains a carbonylgroup or conjugateddoublebonds.Forexample,conjugateddienes, carbonylcompounds, andaromatic compounds all absorb inthe UV-Visregion.
  • 7. 178« atextbook of organic chemistry NUCLEAR MAGNETIC RESONANCE (NMR) SPECTROSCOPY Nuclear magnetic resonance spectroscopy involves absorption of electromagnetic radiation in the radio frequency region.Absorption ofradiowaves inthe presenceofmagnetic field isaccompanied by a special type of nuclear transition, and for this reason we call this type of spectroscopy nuclear magnetic resonance (NMR) spectroscopy. The nuclei ofcertainatoms behaveas ifthey are spinning charges. Any spinning charge creates a magnetic field and behaves as if it were a tiny bar magnet. Of the three nuclei most common in organic compounds ('H, l2C, and ,60)only the hydrogen nucleus proton behaves in this manner. When a proton inan organic molecule isplaced in a strong magnetic field, it can align with the field or against it. Inthe morestable low-energystate, itisalignedWith the magnetic field(Fig.9.7). If energy issupplied inthe form ofradiowavesofexactly the right frequency, radiation will be absorbed and the nucleus will "flip" and alignagainstthe appliedmagnetic field inthe higher energy state. For example,a proton inan appliedfieldof 14000 gauss requiresa frequency of60 millionhertz(cyclesper second) for this particular transition. When this exact frequency is applied, it is absorbed, and the absorption recorded on a chart paper. Inpractice, either the magnetic field can be held constant and the radio frequency varied, or more commonly, the radio frequency can be held constant and the magnetic field varied. Fig.9.8 shows the various components ofa NMR spectrometer. Positionof Signals ;ChemicalShifts. The mainpurpose ofNMR isnot to detect the presenceof protons in a molecule. It can distinguish between protons indifferent chemical environments within the molecule. Protons on benzene ring, or on a carbon bearing a chlorine, or on a carbon adjacent to a carbonyl group absorb radio frequency energies at different applied magnetic fields, and appear at different locations(chemicalshifts) on the recordingpaper. Also, thepositionofabsorption isrelatively constant for protons ina particular chemical or structural environment. Hence,the numberofsignals recordedon the NMR chartpaper indicates the number ofdifferent types ofprotons ina molecule. The position of the peak can give information about the molecular structure in the vicinity of the proton. High energy less stable state (b) Radio waves T Low energy more stable state (a) Fig. 9.7. Orientation of a spinning hydrogen nucleus in an applied magnetic field. (a) shows the nucleus in more stable low-energy state. (b) shows the nucleus in less stable high-energy state. Applying radiowaves flips the nucleus from the more stable 'aligned' state (a) to less stable 'nonaligned' state (b). To understandthe applicationofNMR,we should knowwhat arc EquivalentandNon-equivalent protons.Equivalent protons are protons inthe same moleculethat are chemically indistinguishable. In I
  • 8. SPECTROSCOPY J 179 other words, equivalent protons are positioned instructurally and chemically equivalent areas inthe molecule.As an example, letus consider the following compounds. Sample tube (A) Magnet (B) Radio frequency input oscillator Detecto Radio Frequency Oscillator NMR spectrum Detector Powerful electromagnet Sample tube Fig. 9.8. Schematic diagrams of a NMR spectrometer. CI ch3—ch2—CI a b CH3—CH2—CH2—CI a b c n-Propyl chloride (3 Signals) CH -CH,CH- a" b c" Isopropyl chloride (2 Signals) Ethyl chloride (2 Signals) Equivalent protons are indicated by the same letter, non-equivalent protons by different letters. Noticethat w-propyl chloridecanbe easily distinguishedfrom its isomer isopropylchloride,by simply examining the NMR spectra of the two compounds, n-propyl chloridc gives three NMR signals and has three non-equivalent sets ofprotons,whereas isopropyl chloride gives two NMR signals and has two sets of equivalent protons and one non-equivalent proton.
  • 9. 180". A TEXTBOOK OF ORGANIC CHEMISTRY Delta and Tail Scales.Nuclearmagneticresonancechartpaperisrectangularwith a linearscale of 8 (delta) unitsacross the bottom.Mostchart papers have scales from 5=0to 8= 8 or 9 ppm (partsper million).Toeverysampleasmallamount ofTetramethylsilane (TMS),(CH3)4Si,isaddedasareference (theTMS signal isat 8=0). All other signals are relativeto TMS. SometimesX (tau)scaleisusedwhere the TMS signal isat 10.0ppm. HenceT = 10—8. Table 9.2 lists some characteristic chemical shifts (fromTMS) ofdifferent types ofprotons. Table 9.2 : SOME TYPICAL NMR CHEMICAL SHIFTS OF PROTONS pe ofProton Type ofCompound 8 Value R-CH3 Alkane 0.8-1.2 Ar—CH3 Arene 2.2-2.5 c=c-ch3 Alkene 1.6-1.9 R-O-CH3 Ether 3.2-3.3 Ar—O-CH3 Ether 3.7-4.0 R-CO-CH3 Ketone 2.1-2.4 Ar—CO-CH3 Ketone 2.4-2.6 CH3-COOR Ester 1.9-2.2 R-COOCH3 Ester 3.0-3.9 CH,-N< Amine 2.2-2.6 R-CH2-R Alkane 1.1-1.5 R-CH2—Ar Arene 2.5-2.9 R-CH2-X Alkyl halide 2.7-4.5 r-ch2-no2 Nitroalkane 4.4-4.6 R CH2-OH Alcohol 3.4-4.0 Ar-CH2-OH Alcohol 4.0-5.0 R-CH2-COOH Acid 2.0-2.6 R3C-H Alkane 1.4-1.6 Ar-H . Arene 6.0-7.5 C=C—H Alkene 4.5-6.0 CsC-H .Alkyne 1.7-1.9 R-CHO Aldehyde 9.0-10.0 R-COOH Acid 10-12 R-OH Alcohol 2-6 Ar-OH Phenol 6-8 r-nh2 Amine 1-5 As anexample, letusconsider the NMR spectrum ofbenzylalcohol(Fig.9.9A). Noticethat there are four signals inthis spectrum. (1) The signal on the far right at 8= 0 is that ofthe TMS reference. (2) The signal at 8 = 7.3 is a single sharp peak due to the five chemically equivalent phenyl protons. (3) The signal at 8 =4.6 isa single sharp peak due to the two chemically equivalent methylene (-CH2-) protons. (4) The signal at 8=2.4 isa single sharp peak due to the hydroxy (-OH) proton. I
  • 10. SPECTROSCOPY Ăż 181 Area = 5 Area = 2 TMS Reference 8.0 7.0 6.0 5.0 3.0 2.0 1.0 0 PPM4.0 Chemical Shifts / 5 (B) Area = 3 Area = 2 Area = 1 1.0 0 PPM8.0 7.0 6.0 5.0 4.0 3.0 2.0 Chemical Shifts / 8 Area = 6 "CH? Ares TMS Reference! 8.0 7.0 6.0 5.0 4.0 3.0 2.0 1.0 0 PPM Chemical Shifts / 5 Fig. 9.9. Some examples of NMR spectra. (A) is Benzyl alcohol. (B) is Ethyl alcohol. (C) is Isopropylbenzene. Peak Area ;Integration.The relative areas under the various peaks ofa NMR spectrum are in proportion to the number of protons contributing to each signal. These areas can be electronically integrated by a NMR spectrometer. Comparison of the areas provides the ratio among the various kindsofprotons inthe molecule.Forexample,consider the NMRspectrum ofbenzylalcohol(Fig.9.9 A). The hydrogens inthe moleculeare ina I:2 :5 ratio,likethe correspondingareas inthe spectrum. I
  • 11. 182 iA TEXTBOOK OFORGANIC CHEMISTRY Peak Splitting ;SplittingPattern.Hydrogensonadjacent carbons,eachwithadifferent chemical shift, can influencethe signal ofthe other. This influenceappears as peak splitting. We can generalise the phenomenon by saying that the number ofpeaks into which aparticularproton'ssignal is split, equals one more than the total number ofprotons on directly adjacent carbons. The split peaks are not ofequalheight. Fig. 9.10 shows the splitting pattern for various types ofnon-equivalent protons. II I H I H II I I I I —C— C— —C—c— —C—c—H ii ii ii H H H H H H / I / Doublet Doublet Triplet Doublet Quartet Doublet Fig. 9.10. Splitting pattern for various types of non-equivalent protons. Inthe NMR spectrum of ethyl alcohol (Fig. 9.9 B), notice that the ethyl group is indicated by a quartet and a triplet. In the NMR spectrum of isopropyl benzene (Fig. 9.9 C), notice that the isopropyl group is indicated by a heptet and a doublet. SummaryofNMRSpectroscopy (1) Absorption ofradiowaves inthe presenceofa magnetic fieldcauses nucleiwithin molecules to be promoted from one spin energy levelto a higher spin energy level. (2) The number ofsignals inthe NMRspectrum corresponds to the number ofdifferent types ofprotons inthe molecule. (3) The position (chemical shift) of each signal gives information about the structural environment of the protons. (4) The relative areas (Integration) under the signals givethe ratioofthe numbers ofeach type of proton inthe molecule. Ifthe molecular formula is known, the actual number of each type of proton can be determined. (5) The splittingpatternofeachsignal gives usthe numberofprotonsonneighboringcarbons. The number ofpeaks into which a signal is split is one more than the total number ofprotons on directly adjacent carbons. IMPORTANT TERMS USED IN NMR SPECTROSCOPY Chemicalshift :The separationbetween thepeak ofthe reference standard (TMS) andany other peak inan nmr spectrum. 8scale :An nmr scale inwhich the TMS peak isset at zero andpeaks to the left ofit (downfield) haveincreasinglypositivevalues, inparts per million(ppm). TMS :Abbreviation for tctramethylsilane, (CH3)4Si,the reference standard innmr spectrometry. Downfield shift :The protons of most organic compounds are less shielded than those of TMS and therefore require less energy for resonance to take place. The peaks appear therefore at lower fields, or downfieldof the TMS reference peak. Spin-spin coupling : The splitting of a signal into two or more peaks because of magnetic interactions between neighboring protons. (w +1) rule :A rulethat allowsus to predict intohow many smaller peaks a given signal issplit by neighboring protons. The rule states that a signal is split into (n+ 1) peaks, where n represents the number ofequivalent next-doorprotons.
  • 12. SPECTROSCOPY Ăż 183 c I1 O JC C= ĂżC N 1°» lo —H C =C 1 N— H II 3800 3400 3000 2600 2200 1800 1400 Wavenumber (cm*1) Group Assignments in Infrared Spectra C02H CHO ArH C=CH X—CH C=CH Tl*IS OCH COCK CH ch2 11.0 10.0 9.0 8.0 7.0 6.0 5.0 4.0 3.0 2.0 1.0 0 Chemical shift, 8 (ppm) Higher magnetic field i >Proton more deshielded Group Assignments in NMR Spectra MASS SPECTROSCOPY Ina mass spectrometer, organic molecules are vapourised and bombarded with a beam of very high-energy electrons (Fig.9.11).The resultingcollisions impartconsiderable energyto the molecule, which inturn emit electrons to producepositively charged ions. These ions possess so much energy that they often fragment through various bond cleavages to produce new positively charged ions. ABC+ (Molecular ion) ABC electron > AB+ c+beam A+ BC+ The positive ions are accelerated toward a negatively charged plate by passing them through a magnetic field,which deflects the ions.The ionsoflightermass are deflected more thanheavier ions. Eachkindofionhasaparticularmassto charge (m!e)ratio.Formost ions producedinthe fragmentation of the molecule, the charge is +1so, that m/e usually represents the mass ofthe ion. Base Peak.The set ofionsproducedfrom amoleculecan be analysed since each has itsown ml e ratio,andproduces a signal whose intensity is due to the relativeabundace of that ion. The largest peakfound in a mass spectrum (that ofhighest intensity) is calledthe basepeak, and is given the numerical value of 100. The intensities of all other peaks are expressed relative to the height ofthe base peak.A mass spectrum ishighly characteristic ofa particular compound. I
  • 13. 184" A TEXTBOOK OF ORGANIC CHEMISTRY Beam positive Negatively accelerating plates Sample=(o inlet xS Electron gun (B) Negatively charged accelerating plates Sample inlet Fig. 9.11. Schematic diagrams of a Mass spectrometer. Molecular Ion. The ionformedby removing one electronfrom theparent molecule is called molecular ion orparent ion. The molecular ionpeak is usually representedas NT.Itmay or may not be the peak of highest intensity. The molecular ion is the most important ion, since its mass is the Molecular Weight ofthe parent molecule. The use of mass spectroscopy is not limited to the determination of the molecular weight of compounds. Italso has great utilityinthe elucidationofthe structure ofa molecule.The fragmentation processes oforganic moleculesfollow certainpatterns inthat the fragments brokenoffarerelatedto bond strengths and the stability of the species formed. Since certain structural features inmolecule producedefinite characteristic fragmentation patterns, the identificationofthese fragments and their relative intensities ina mass spectrum can beused to determine the structure of organic compounds. The following examples illustrate how a mass spectrum can be used to determine the structure of organic molecules: Example 1. Let us consider the following isomers. CH3CH2CH2CH2CH2CH2CH2CH3 n-Octane ch3 CH3CH2CH2CHCH2CH2CH3 4-Methylheptane 77-Octane canbeeasily distinguishedfrom 4-methylheptane, since the methyl group branched at C-4inthe lattercompound, is easily brokenoff"as CHĂż fragment and will give a peak oflargeintensity at m/e= 15 Example 2. Consider the mass spectrum shown in Fig. 9.12. The fragmentation pattern and relativeabundance ofpeaks isas follows.A molecular weight of32,whichcorresponds to 02,isruled I
  • 14. SPECTROSCOPY Ăż 185 out, since the only other possible fragment would be O with a peak ofrelatively high intensity at m/ e=b.Anm/epeak is present at a value of 16,but has a very low relative intensity,0.21. The peak at m/e= 15 isdue to a CHt fragment, and the overall spectrum indicates an elemental composition of CH40.Considerationofother peakspresent leads to the conclusionthat the moleculeproducingthis spectrum ismethylalcohol (CH3OH). 100; 3 40 m/e Relative abundance 12 0.32 13 0.72 14 2.4 15 1.3 16 0.21 17 1.0 28 6.3 29 64 30 3.8 31 100 32 66 33 0.98 34 0.14 Fig. 9.12. Mass spectrum of Methyl alcohol, CH3OH SummaryofMassSpectroscopy (1) Mass spectroscopy involves organic molecules being bombarded by a very high-energy electronbeam. (2) The peak ofhighest intensity in a mass spectrum is referred to as the base peak. (3) Fragmentationprocesses can produce numerous fragments, from which the structures of organic molecules can be deduced. (4) When one electron is removedfrom a molecule,a molecular ion isproduced.Them/evalue of the molecular ion peak is the molecular weight of the compound being investigated. The molecular weights obtained by mass spectroscopy arc extremely accurate. o Mass |Spectrometer Moleculefar,d Here
  • 15. 186" A TEXTBOOK OF ORGANIC CHEMISTRY EXAMINATION QUESTIONS 1. (a) Explain why spectroscopic methods are increasingly used for structure determination of organic compounds. (b) What type of information one can obtain from : (/) IR spectrum ; (if) UV spectrum ;and (/'/'/) NMR spectrum. 2. What type of molecular transitions are brought about by absorption of : (a) Ultraviolet-visibleradiation (b) Infraredradiation (PanjabBSc, 2003 ;DelhiBSc. 2005) 3. Write notes on : (a) UV spectroscopy (Banaras BSc. 2001) (b) IR spectroscopy (MadrasBSc, 2003) (c) NMR spectroscopy (DelhiBSc, 2002 ;Jadavpur BSc. 2004) 4. Discuss the principle and applications of NMR spectroscopy in structure determination of organic compounds. (HSGaur BSc. 2004) 5. What ismeantby the term ChemicalShiftofa particularproton inNMR spectroscopy ? Draw the splitting patterns of protons in NMR spectrum of ethyl alcohol. 6. How will you distinguish between 1,3-pentadiene and 1,4-pcntadiene by UV spectroscopy ? Answer. 1,3-Pentadiene will have higher max than 1,4-pcntadiene. This is because 1,3-Pcntadiene is conjugated ;whereas 1,4-pentadiene is not. 7. How will you distinguish between benzene and anthracene by UV spectroscopy ? (Bharathidasan BSc. 2004) Answer. Anthracene will have higher max than benzene. This is because anthracene is more conjugated than benzene. 8. A chemist prepared the two isomeric ketones (A ) and (B). placed them in separate flasks, but forgot to label them. How could you differenciate the two by UV spectroscopy O O II II ch3ch2ch=chcch3 ch3ch=chch2cch3 (A) (B) Answer. In the UV spectra, (.4),a conjugated system, would show Xmax at higher wavelengths than (B),a nonconjugatedcompound. 9. Two isomeric dienes (A) and (B) having the molecular formula CsHg absorb at 223 nm and 178 nm respectively. Write the structures of the two isomers. Answer. (A) is CH2=CH-CH=CH-CH3 ; 1,3-Pentadiene (B) is CH2=CH-CH2—CH=CH2 ; 1,4-Pentadiene 10. Arrange the following compounds inthe increasingorder of their UVabsorption maxima : (a) Ethylene (b) Naphthalene (c) Anthracene (d) 1,3-Butadiene Answer, (a) < (d) < (c) < (b) 11. How do you identify the following functional groups by IR spectroscopy : (a) -OH (b) -NH2 (c) -CN (d) >C=0 12. Discuss the principle of IR spectroscopy. How will you distinguish between the following pairs of compounds on the basis of IR spectroscopy : (a) Ethyl alcohol anddiethyl ether (b) Acetic acid andethyl acetate Answer, (a) Ethyl alcohol shows a strong/broad absorption at 3200-3500 cm-1(due to O-Hbond) while diethyl ether does not ; and (ft) Acetic acid shows a strong/broad absorption at 2500-3500 cm"1 (due to O-H bond) while ethyl acetate docs not. 13. How would you distinguish between the following pairs of compounds by IR spectroscopy ? (a) CH3CH2CH2N(CH3)2 and CH3CH2CH2NH2 (b) CH3CH2CH2COOH and CH3CH2COOCH3 (c) CH,CH2COCH3 and CH3CH2COOCH3 I
  • 16. r SPECTROSCOPY J 187 Answer, (a) CH3CH,CH:NH2 shows N-H absorption at 3300-3500 cm"1 while CH3CH2CHjN(CH,)2 does not. (b) CHjCH2CH2COOHshows O-Habsorptionat 2500-3500cm 1 whileCH3CH2CH2COOCH3 does not. (c) CH3CH2COOCH3 shows C-0 absorption at 1050-1350 cm1while CH3CH2COCH3 does not. 14. Two compounds, (A) and (B), have the same molecular formula C2H60. They have different IR spectra. Compound (A) shows a strong/broad absorption at 3400 cm"1, while compound (B) does not. Suggest formulas for (A)and(B)which account for the difference. Answer. (A) is ethyl alcohol (CH3CH2OH) ;(B) is dimethyl ether (CH3OCH3). The strong absorption at 3400 cm"1 in(A) is due to the O-Hbond. 15. Draw the structure of a compound with each of the following molecular formulas that will show only one peak in its NMR spectrum : (a) C3H$C12 (b) C5HI2 (c) CĂżO (d) C4H6 Answer. Possible structures are : CI ch3 (a) CH3-C-CH3 (b) CH3-C-CH3 CI CH3 (c) CH3-O-CH3 (d) CH3CSCCH3 16. How many NMR signals do you expect from eachofthe following compounds. Indicatealso the splitting pattern of the various signals. (a) CH3OCH3 (*>) CH3OCH2CH3 (c) CH3CH2OH Answer, (a) One signal(singlet) ; (b)Three signals (singlet,quartet,triplet) ;and(c)Twosignals (singlet, quartet). 17. How many signals (ignoring the splitting patterns) would you see in the NMR spectra of the following compounds ? (Saugar BSc, 2002) (a) Butanone (b) Cyclobutane (c) Ăż-xylene (d) 2-Propanol Answer, (a) Three signals ;(b) One signal ;(c) Two signals ;and (d) Three signals. 18. Predict the signal pattern of the CH3 protons in the NMR spectra of the following compounds. O II (a) CH3CHBr2 (b) CH3—C-OH OH (c) CHaCHjBr (d) CH3-CH-CH3 (AllahabadBSc.2003) Answer. Apply the (w + 1) rule, (a) The CH3 group has one neighboringproton and would therefore be a doublet ;(b)The CH3group hasnoneighboringproton,andwould therefore beasinglet ;(c)The CH3group has two neighboringequivalent protons andwould thereforebeatriplet ;and(d)The two CH3 groups are equivalent and haveone neighboringproton. The CH3signal would therefore be a doublet. 19. The NMR spectrum of compound (A) C2H60, shows one signal only, a singlet. Deduce the structure of (A). {CalicutBSc, 2004) Answer. (A) is CH3-0-CH3 20. The NMR spectrum of compound {A), C5H]2, gives only one signal, a singlet. What is the structure of (Ăż4)? Answer. The molecular formula, C5H12, indicates that (/*) is an alkane. The single signal in the NMR spectrum indicatesthat all hydrogensare equivalent. The only possibleC5H12 isomerthat fitsthe data is(CH3)4C (2,2-Dimethylpropane). 21. The UV spectrum for a compound with formula C3H60 shows a weak absorption band at 280 nm. The NMR spectrum shows only one signal, a singlet. What is the structure of the compound ? Answer. The weak UV absorption at 280 nm is characteristic ofa carbonyl group (C=0), leavingC2H6 for theremainder ofthe original formula. This suggests two CH3 groups. The structure ofacetone (CH3COCH3) fits all the data.
  • 17. v 188!A TEXTBOOK OFORGANIC CHEMISTRY 22. The NMR spectrum of a compound C4HqBr consists ofa single sharp line. What is the structure of the compound ? Answer. The compound is /er/-Butyl bromide, (CH3)3 CBr. 23. Suggest the structure of a compound each with the following NMR spectral features : (a) An alcohol with two NMR peaks (6) A compound C5Hj0 with a single NMR peak (c) A compound C4H6 with a single NMRpeak. Answer, (a) Methylalcohol ; (b) Cyclopentane : (c) 2-Butyne 24. How would you distinguish between the following pairs of compounds byNMR spectroscopy ? O O II II (a) CH3-C-CH3 and CH3CH2-C-H O 0 II II (b) CH3—C—CH3 and CH3—C-OCH3 (PunjabBSc. 2005) Answer, (a) CH3COCH3 will give only one signal, while CH3CH2CHO will give three signals; and (b) CH3COCH3will give only one signal, while CH3COOCH3will give two signals. 25. How will you distinguish between the three dibromobenzenes by their NMR spectra. (Visva BhartiBSc, 2003) Answer. o-Dibromobenzene will show two peaks ;w-dibromobenzene will show three peaks ; and p-dibromobenzenewill show only one peak. Br Br V a Br Qr*b a c b o-Dibromobenzene m-Dibromobenzene p-Dibromobenzene (two peaks) (three peaks) (one peak) 1:1 1:2:1 26. Give a structure consistent with the following NMR data : Molecularformula =C3HsCl3 (a) Singletat 82.20, 3H (b) Singlet at 64.02, 2H b a Answer. The compound is CH2C1—CCI2—CH3 27. Give a structure consistent with the following NMR data : Molecular formula = Ci0H14 (a) Singlet at 5 1.30,9H (A) Singlet at 5 7.28,5H Answer. The compound is : fert-Butylbenzene CH3Ăż 28. Suggest a structure consistent with the following NMR data :Molecular formula = CĂżHĂż (a) Singlet at 86.78, 3// (A) Singlet at 82.25, 9H (MysoreBSc.2004) Answer. The compound is : Mesitylene CH) a
  • 18. r Alkanes <4- «* C C C j5,il.K '*!Ăż 1 loĂż 3UTANE mFUEL ; A: Butaneisusedasafuelinlighters. Itisalsousedinsamecamping stoves. lkanes are the simplest organic compounds made of carbon and hydrogen only. They have the general formula C„H2*+2where n= 1,2,3etc. The first three members ofthis class can be represented as : H H H H—C- I H -H H-C I H -C—H Methane H Ethane H H H I I I H—C—C—C—H I I I H H H Propane The carbon atoms intheir moleculesare bondedto each other by single covalent bonds. Each carbon is again bonded to enough hydrogen atoms to give maximum covalence of 4. Since the carbon skeletonofalkanes isfully 'saturated' with hydrogens,they are also calledSaturated Hydrocarbons. Alkanes containstrongC—C andC—Hcovalent bonds.Therefore, this class ofhydrocarbons are relatively chemically inert. Hencethey are sometimes referredto as Paraffins(Latin,parumaffinis= littleaffinity). STRUCTURE Let us consider methane (CH4) and ethane (CH3—CH3) for illustrating the orbital make up of alkanes. Inmethane, carbon forms single bonds with four hydrogen atoms. Since the carbon atom is attached to four other atoms, it uses spl hybrid orbitals to form these bonds. Each C-H bond is the resultofthe overlap ofansp3 orbitalfrom carbonand ans orbital from hydrogen(Fig. 10.1).All C—H bonds are a bonds.