1. 42853288
0
Satellite Oceanography
Introduction
The global oceans are just one component of the coupled earth system, constantly changing according to the
physical forces and feedbacks which influence a current state. Both biotic and abiotic indicators can be used in
ocean assessment, which in turn provides insight to the overall functioning of the earth system. In the past, global
ocean evaluation was limited by spatial and temporal coverage, however relatively recent remote sensing
technology has improved this resolution. By utilising satellite platforms which capture visible, near infrared, thermal
infrared and microwave reflectance; spatially extensive and temporally regular datasets have become available for
physical and biological ocean parameter analysis (Pandey et al. 2008). Sea surface temperature (SST) and chlorophyll
are two examples of these parameters, and when combined with in situ data collection, the analysis of ocean
conditions at global and regional scales can be both accurate and precise. Such analysis can reveal patterns and
relationships within the current state of global and regional oceanic systems, and provide prediction of future
conditions according to the current momentum of system change.
This report will discuss the oceanographic patterns of SST and chlorophyll which were observed within remotely
sensed raster images at global and regional scales. Firstly, the data processing method will be summarised. This will
be followed by a discussion regarding the patterns of SST and chlorophyll variability within the global oceans and
along the Australian East Coast (AEC). Finally, remotely sensed and in situ data collection will be compared to assess
the precision and accuracy of remotely sensed analysis.
Methods
Remotely sensed and in situ data sets were acquired from the NASA Ocean Colour Website, the UQ Biophysical
Oceanography Group (UQBOG), and the North Stradbroke Island National Reference Station (NRS). All image
creation utilised SeaDAS 7.3.1; and common procedures included the customisation of colour pallets, the assignment
of land masks to no data pixels, and gridline overlay. The analysis of the AEC also included the overlay of a 200m
shapefile. Global parameter analysis required the acquisition of raster datasets captured by the MODIS multi spectral
imaging device on board the Aqua Satellite. SST utilised a range between -2°C and 35°C for January 2015 and 2002-
2015 climatology, while chlorophyll analysis involved a range of 0.01 mg/m3
to 20mg/m3
over the same temporal
resolutions.
The AEC analysis required MODIS imagery from the Aqua and Terra satellites, and UQBOG pre-processing to provide
daily SST images at a 1km resolution. SST and chlorophyll rasters for 2010-2014 climatology and 2015 mean were
created for January and June, with ranges of 14°C to 33°C and 0.01 mg/m3
to 10 mg/m3
respectively. Parameter
anomalies were then calculated to compare current observations to average patterns. Pixel extraction of MODIS SST
and chlorophyll data allowed further processing in Excel, and a comparison to NRS in situ observations during 2011-
2012. Monthly means for SST were calculated at 0m, -20m, and -63m; while chlorophyll observations were limited
2. 42853288
1
to -20m and -60m depths. Graphs were then generated comparing MODIS and in situ data for both parameters over
the range of applicable depths.
Results
Global Sea Surface Temperature
Figure 1 The month of January 2015- Global mean sea surface temperature distribution generated from NASA Ocean Colour Website MODIS
data
Figure 2 January climatology for 2002 to 2015 - global mean sea surface temperature distribution generated from NASA Ocean
Colour Website MODIS data
3. 42853288
2
Global Chlorophyll Concentrations
Figure 3- The month of January 2015- Global mean chlorophyll distribution generated from NASA Ocean Colour Website MODIS data
Figure 4 January Climatology 2002-2015- Global mean chlorophyll distribution generated from NASA Ocean Colour Website MODIS
data
4. 42853288
3
Monthly Sea Surface Temperature Climatology
Monthly Sea Surface Temperature 2015 Means
Figure 6 January SST 2010-2014 Climatology for the
Australian East Coast. Generated from NASA Ocean Colour
Website MODIS data, pre-processed by UQBOG
Figure 5 June SST 2010-2014 Climatology for the Australian
East Coast. Generated from NASA Ocean Colour Website
MODIS data, pre-processed by UQBOG
Figure 8 January SST 2015 mean for the Australian East
Coast. Generated from NASA Ocean Colour Website
MODIS data, pre-processed by UQBOG
Figure 7 June SST 2015 mean for the Australian East
Coast. Generated from NASA Ocean Colour Website
MODIS data, pre-processed by UQBOG
5. 42853288
4
Anomaly- Sea Surface Temperature
Monthly Chlorophyll Climatology
Figure 10 SST January anomaly between the 2015 mean and
2010-2014 climatology data. Generated from NASA Ocean
Colour Website and pre-processed UQBOG MODIS data
Figure 9 SST June anomaly between the 2015 mean and
2010-2014 climatology data. Generated from NASA Ocean
Colour Website and pre-processed UQBOG MODIS data
Figure 11 June Chlorophyll 2010-2014 climatology for the
Australian East Coast. Generated from NASA Ocean Colour
Website MODIS data, pre-processed by UQBOG
Figure 12 January Chlorophyll 2010-2014 climatology for the
Australian East Coast. Generated from NASA Ocean Colour
Website MODIS data, pre-processed by UQBOG
6. 42853288
5
Monthly Chlorophyll 2015 Means
Anomaly- Chlorophyll Concentrations
Figure 13 June Chlorophyll 2015 mean for the Australian
East Coast. Generated from NASA Ocean Colour Website
MODIS data, pre-processed by UQBOG
Figure 134 June Chlorophyll 2015 mean for the Australian
East Coast. Generated from NASA Ocean Colour Website
MODIS data, pre-processed by UQBOG
Figure 15 Chlorophyll January anomaly between the 2015
mean and 2010-2014 climatology data. Generated from
NASA Ocean Colour Website and pre-processed UQBOG
MODIS data
Figure 14 Chlorophyll June anomaly between the 2015
mean and 2010-2014 climatology data. Generated from
NASA Ocean Colour Website and pre-processed UQBOG
MODIS data
7. 42853288
6
NRS In Situ Sea Water Temperature
NRS In Situ Chlorophyll Concentrations
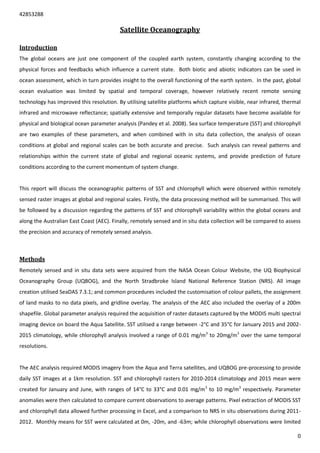
Monthly Sea Surface Temperature for MODIS and NRS In Situ Data at Varied Depth
15
17
19
21
23
25
27
29
1/01/2011 11/04/2011 20/07/2011 28/10/2011 5/02/2012 15/05/2012 23/08/2012 1/12/2012
Temperature(degC)
Time
NRS In Situ Sea Water Temperature Measurements Vs MODIS Remotely Sensed Data-
2011 to 2012
0m In Situ 20m In Situ 63m In Situ MODIS
Figure 16- Time series of NRS in situ data collection of SST for the period of 2011-2012. Data collected using a mooring array instrument, east of
North Stradbroke Island, at depths of at 0m, -20m and -63m.
Figure 17- Time series of NRS in situ data collection of chlorophyll concentrations for the period of 2011-2012. Data collected using a mooring
array instrument, east of North Stradbroke Island, at depths of -20m and -60m
Figure 18- Time series of NRS in situ data collection of SST for the period of 2011-2012, and MODIS measurements for the same period
obtained through pixel extraction. Data collected using a mooring array instrument, east of North Stradbroke Island, at depths of 0m, -
20m and -63m.
0.0
0.5
1.0
1.5
2.0
2.5
3.0
3.5
4.0
1/01/2011 25/06/2011 17/12/2011 9/06/2012 1/12/2012
Chlorophyll(mg/m3)
Time
NRS In Situ Chlorophyll Measurements at Varied Depth between 2011 and 2012
20m Day 20m Month 60m Day 60m Month
15
20
25
30
1/01/2011 11/04/2011 20/07/2011 28/10/2011 5/02/2012 15/05/2012 23/08/2012 1/12/2012
Temperature(degC)
Time
NRS In Situ Sea Water Temperature Measurements at Varied Depth- 2011 to 2012
0m Month 0m Day 20m Month 20m Day 63m Month 63m Day
8. 42853288
7
Comparison of Monthly MODIS and NRS In Situ Chlorophyll Concentrations
Discussion
Global Scale Analysis
The global SST images illustrate the spatial distribution of temperature within the ocean system. Generally, the
equator is characterised by high temperature waters, which decline with latitude change toward the poles. Due to
the convergence of geostrophic gyres, the warmest locations are at the approximate centre of major oceans. The
current directions and heat load within transverse, eastern and western boundary currents are variable according to
the clockwise/anticlockwise circulation patterns of the specific hemisphere in which they exist. Overall, these ocean
circulations are driven by a balance of physical forces, and the dynamic equilibrium of global energy redistribution.
Regional circulation patterns can also be observed at this global scale. The Agulhas Current extends as a warm
intrusion into the Antarctic Circumpolar Current, illustrating the strength of south westerly currents along the South
Africa coast. At the Benguela Region, cold uplifted waters characterise the continental shelf for approximately 15° of
latitude. While off the Argentinian east coast, a northern cold water intrusion illustrates the Brazil-Malvinas
confluence region and the mixing of the Malvinas and Brazil Currents (Gyory, Mariano & Ryan 2013). These regional
currents exist within the January mean and climatology images, suggesting a certain degree of spatial stability within
temporal change.
Global chlorophyll distributions are concentrated outside the unproductive centres of the five major gyres. The
convergent centres of these gyres cause down welling, which limits nutrient availability for phytoplankton blooms.
The highest chlorophyll concentrations are along the continental shelves of the Peruvian, Californian, Canary,
Humboldt, Benguela and Somali up welling regions. Similar productivity also occurs along other coastlines and
protected bays. Excluding the South Eastern Patagonian coast and its spring to autumn upwelling features (Valla &
Piola 2015), western boundary currents depict relatively low chlorophyll concentrations.
0.0
0.2
0.4
0.6
0.8
1.0
1.2
1/01/2011 25/06/2011 17/12/2011 9/06/2012 1/12/2012
Chlorophyll(mg/m3)
Time
NRS In Situ Chlorophyll Measurements at Varied Depth Vs MODIS Remotely Sensed
Data- 2011/2012
20m In Situ 60m In Situ Modis
Figure 19- Time series of NRS in situ data collection of chlorophyll concentrations for the period of 2011-2012, and MODIS measurements for
the same period obtained through pixel extraction. Data collected using a mooring array instrument, east of North Stradbroke Island, at depths
of -20m and -63m.
9. 42853288
8
Regional Scale Analysis
Regional SST images of the AEC illustrated the spatial and temporal dynamics of the East Australian Current (EAC).
Often defined as the South Pacific Gyre ‘s western boundary current (Roughan & Middleton 2002), warm tropical
waters flow south along the coast and decline in temperature as latitude increases. Observable January EAC
features include offshore currents and eddy formations at approximately 24°S and 28°S, the north-easterly turn of
the Tasman Front at approximately 32°S to 33°S, and a regular eddy field just below this location (Ridgway & Hill
2009). During June, general EAC characteristics remain the same, however water temperatures decrease and
southern penetration reduces. This seasonal change is due to decreased solar insolation, and the weakening of
current intensity from south-easterly trade wind dominance.
The SST anomalies revealed variations between average patterns and 2015 observations. In January, the Tasman
Current location and the continental shelf between 28°S and 36°S increased by approximately 1.5°C to 2.5°C. Harvey
Bay, Moreton Bay, and the offshore eddies fields at 24°S to 26°S also display positive anomalies. In winter, a decline
in average temperature appears at 34°S to 36°S which corresponds to the eddy field below the Tasman Current
meander, and may indicate an upwelling of cold ocean waters from depth. Overall, January and June SST anomalies
suggest 2015 conditions which were significantly different to average patterns of the last five years. The monthly
variation in positive and negative anomalies appears to be influenced by the spatial characteristics of currents, and
the upwelling or down-welling characteristics of eddies.
Chlorophyll analysis of the AEC indicates the inland continental shelf as the most productive during both summer
and winter. Prime locations include Moreton and Harvey Bay, and the central NSW coast between 29°S and 33°S.
Roughan and Middleton (2002) suggest that these upwelling processes are driven by wind, continental shelf
intrusion of the EAC, diversion of the EAC off the coast, or EAC acceleration from variable bathymetry. In summer,
longer days provide increased sunlight for phytoplankton blooms, and if combined with north-easterly dominate
monsoon winds, the EAC intensifies which is reflected in upwelling processes (Berkelmans, Weeks & Steinberga
2010). The pattern of continental shelf upwelling and coastal productivity is similar in winter. Offshore however,
chlorophyll concentrations increase marginally over the entire Tasman Sea.
Chlorophyll anomalies for both months demonstrate a slight decline in concentrations for the greater part of the
offshore continental shelf. In January however, the inland coastal waters between 30°S to 33°S increase by up to
3.5mg/m3
. This location is just north of the highly populated and industrialized Sydney/Newcastle region, and may
represent the wet season nutrient influx from terrestrial run off and related phytoplankton blooms. Minor positive
anomalies are also located offshore at 34°S, which again corresponds to the eddy circulations below the Tasman
Current meander. During winter, continental shelf negative anomalies remain, but January positive anomalies of the
central coast no longer dominate. The 34°S positive anomalies of January are still present; however this trend has
extended over the majority of the Tasman Sea. This can relate to Tasman Sea eddy formation, and the deepening of
10. 42853288
9
surface mixing which causes low summer chlorophyll concentrations and blooms during autumn and spring (Ridgway
& Hill 2009).
Remotely Sensed and In Situ Data Comparison
Daily and monthly in situ data depict similar results at the surface and -20m samples, yet substantially lower
temperature at a depth of -63m. Generally, the monthly trend line follows daily temperatures; however the
resolution of the averaged data leads to a loss of maximum and minimum temperature fluctuations. This is also
illustrated in the daily and monthly chlorophyll comparisons. Such simplification does not represent the extensive
temporal dynamics of a given ocean location, however still provides a general insight to the average patterns of
change.
The comparison of SST MODIS data and in situ measurements revealed similar responses at the surface and a depth
of -20m. Remote sensing measurement of SST only capture the ocean surface, with penetration of 20 micrometres
for infrared and a few millimetres for microwave radiometers (Remote Sensing Systems 2016). The -63m in situ
temperature was significantly colder, which suggests a stratified ocean temperature gradient over depth. The
comparison for chlorophyll MODIS and in situ measurements indicated unpredictable accuracy at both depths, and
illustrates the variability of concentrations within the water column. Therefore, MODIS measurements for both the
SST and chlorophyll appear restricted to surface layer conditions.
Remote sensing allows data collection over extensive spatial and temporal resolutions which would be inaccessible
through in situ field sampling. However, there are a number of issues with measurements under the ocean surface.
Considering the dynamic nature of physical and biological parameters within the three dimensions of ocean
structure, field work is still required for initial sensor calibration and the collection of measurements at depth.
Overall, remote sensing increases the potential of large scaled global and regional research, and future sensor
technology and algorithm development will only increase application possibilities.
11. 42853288
10
References
Berkelmans, R, Weeks, SJ & Steinberga, CR 2010, 'Upwelling Linked to Warm Summers and Bleaching on
the Great Barrier Reef', Limnology and Oceanography, vol. 55, no. 6, pp. 2634-44.
Gyory, J, Mariano, A & Ryan, E 2013, Surface Currents in the Atlantic Ocean- The Malvinas Current, viewed
19th of May 2016, <http://oceancurrents.rsmas.miami.edu/atlantic/malvinas.html>.
Pandey, PC, Kumar, R, Varma, AK, Mathur, AK & Chaturvedi, N 2008, 'Remote Sensing Applications to
Coastal Oceanography', in Springer Netherlands, Dordrecht, pp. 45-67, DOI 10.1007/978-1-4020-8327-3_5,
<5okNEnoainqUod6mburnTe5hsOqgIRiMjfQW3392Fsi1P4BKxjTDw>.
Remote Sensing Systems 2016, Sea Surface Temperature, viewed 20th of May 2016,
<http://www.remss.com/measurements/sea-surface-temperature>.
Ridgway, K & Hill, K 2009, The East Australian Current, 978-1-921609-03-9, CSIRO Marine and Atmospheric
Research,, viewed 20 of May 2016.
Roughan, M & Middleton, JH 2002, 'A Comparison of Observed Upwelling Mechanisms off the East Coast of
Australia', Continental Shelf Research, vol. 22, no. 17, pp. 2551-72.
Valla, D & Piola, AR 2015, 'Evidence of Upwelling Events at the Northern Patagonian Shelf Break: Upwelling
at the Patagonian Shelf Break', Journal of Geophysical Research: Oceans, vol. 120, no. 11, pp. 7635-56.