Basic Civil Engineering first year Notes- Chapter 4 Building.pptx
Exploring the Census 2021 Maps from ONS - Student Guide.pdf
1. KEJ Geography
Exploring the Census 2021 Maps from ONS
Go to the website: https://www.ons.gov.uk/census/maps
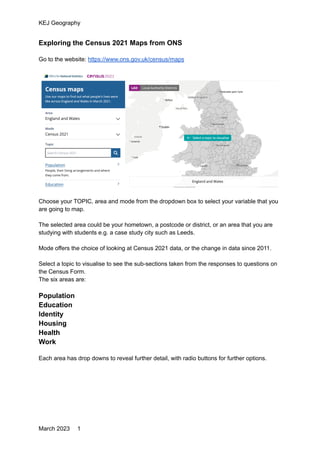
Choose your TOPIC, area and mode from the dropdown box to select your variable that you
are going to map.
The selected area could be your hometown, a postcode or district, or an area that you are
studying with students e.g. a case study city such as Leeds.
Mode offers the choice of looking at Census 2021 data, or the change in data since 2011.
Select a topic to visualise to see the sub-sections taken from the responses to questions on
the Census Form.
The six areas are:
Population
Education
Identity
Housing
Health
Work
Each area has drop downs to reveal further detail, with radio buttons for further options.
March 2023 1
2. KEJ Geography
E.g. Work
For most of these sub-sections (variables) there are radio buttons to make further selections
from within the data using radio buttons.
E.g. For Distance travelled to work, you will then be asked to select a distance.
For some of the variables, there are pandemic-related quality considerations which may
have changed the nature of the results from previous census data.
E.g. Distance travelled for work
https://www.ons.gov.uk/employmentandlabourmarket/peopleinwork/employmentandemploye
etypes/methodologies/traveltoworkqualityinformationforcensus2021
A choropleth shaded map will appear with data shown at LAD (Local authority district) level
Mousing over any area will show the percentages for that area for the chosen variable.
March 2023 2
3. KEJ Geography
Zooming in reveals more detail (granularity is the phrase used)
Top level: Local Authority Districts (LAD)
Next level: Middle Layer Super Output Area (MSOA)
Next level: Output Areas (OA)
The different ‘areas’ for which Census data are available are described here:
https://www.ons.gov.uk/methodology/geography/ukgeographies/censusgeographies/census2
021geographies#:~:text=Outputs%20from%20Census%202021%20are%20for%202021%20
LSOAs%20and%20are,on%20our%20Open%20Geography%20website.
There is some variation in the mapping depending on the variable.
Maps can be shared, downloaded and embedded under the Open Government License
which allows for free sharing.
The latter option would be good if you have a blog or website which allows embedding.
March 2023 3
4. KEJ Geography
From the HOME area, select Change since 2011 to see data presented in terms of
percentage change.
E.g.
-2.6pp is a 2.6% drop in the people in KIng’s Lynn and West Norfolk who were born in the
UK in this example.
Students may need to be guided through what that means in terms of migration etc.
Other mapping and data download options are available:
Custom Area Profiles can be produced here
https://www.ons.gov.uk/visualisations/customprofiles/draw/
Try this Dot Density map too
https://onsvisual.github.io/dot-density-demo/
Alan Parkinson
@GeoBlogs
March 2023 4