
Recommended
More Related Content
What's hot
What's hot (18)
Similar to Presentation on securitizations and interlinkedness and unpredictability in the financial system
Similar to Presentation on securitizations and interlinkedness and unpredictability in the financial system (20)
Recently uploaded
Recently uploaded (20)
Presentation on securitizations and interlinkedness and unpredictability in the financial system
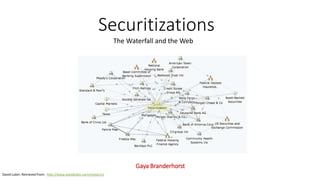
- 1. Securitizations Gaya Branderhorst The Waterfall and the Web David Lubin. Retrieved from: http://www.davidlubin.com/research/
- 2. Securitizations Basics (1) Andreas Jobst, A. (2008). Finance & Development. Back to Basics: What Is Securitization? Retrieved from: https://www.imf.org/external/pubs/ft/fandd/2008/09/.../basics.pdf
- 3. Securitizations Basics (2) Advantages • Ability of originator (e.g., a bank) to optimize balance sheet by removing assets risk form its balance. • Broader range of investors, because these don’t have to own an asset to be able to invest in it • Ability for investors to accurately select the level of risk that they want to expose themselves to (or at least, that’s the idea).
- 4. Problems identified after Global Financial Crisis • Originate to distribute (by originators) • Blind reliance on external Credit Ratings: many investors had no idea of the risks of the securitisation pieces they were holding, and on top of that: • failure of those ratings to adequately reflect the risks • Cliff effects in assigning capital charges, i.e., too low capital charges for high rated senior tranches, and too high capital charges for low rated tranches.
- 5. 0 200 400 600 800 1000 1200 1400 Huidige raamwerk Nieuwe raamwerk RWs in % of senior tranches (1 year maturity) RWs in % of senior tranches (5 year maturity) 0 200 400 600 800 1000 1200 1400 AAA AA A+ A- BBB BB+ BB- B CCC Huidige raamwerk Nieuwe raamwerk RWs in % of non-senior tranches (1 year maturity 0,10 tranchethickness) 0 200 400 600 800 1000 1200 1400 Huidige raamwerk Nieuwe raamwerk RWs in % of non-senior tranches (1 year maturity, 0,5 tranchethickness) 0 200 400 600 800 1000 1200 1400 Huidige raamwerk Nieuwe raamwerk Blue = old (current) framework Red = new (Basel III) framework Cliff effects in regulatory capital charges
- 6. Regulatory actions • Retention rules (already in effect) • Revise the Basel framework in securitisations to incorporate the mentioned lessons by reducing mechanistic reliance on external Credit Ratings, Overall increase and reduced cliff effects in capital charges, and increased risk-sensitivity. Read everything on the Basel III securitizations framework that will go into effect in 2018 here: http://www.bis.org/bcbs/publ/d303.htm http://www.bis.org/bcbs/publ/d374.pdf
- 7. Will it happen again? (1) Source: The Financial Times, 30 October 2008 p. 7 c. 1.
- 8. Merrill Lynch 2007 $ 92m 95% $730m JP Morgan 2007 $103m 99% $1.62bn Goldman Sachs 2007 $134m 95% $2.12bn Citigroup 2007 $163m 99% $2.5bn Source: Pablo Triana. The Number That Killed Us. E Books: p. 146 Will it happen again? (2)
- 9. Merrill Lynch 2007 $ 92m 95% $730m JP Morgan 2007 $103m 99% $1.62bn Goldman Sachs 2007 $134m 95% $2.12bn Citigroup 2007 $163m 99% $2.5bn Source: Pablo Triana. The Number That Killed Us. E Books: p. 146 Why is this..? $ 41bn $ 8.4bn $ 86bn $102bn Will it happen again? (3)
- 10. Will it happen again? (4) Causes of the GFC • Leverage in the system • Looking at risks in isolation and internally • Blind reliance on quantitative models that: • use past data only • Sometimes assume normal distributions and constant (co)variances where there is no basis to assume so
- 11. Will it happen again? (5)
- 12. Source: This Time is Different. Eight Centuries of Financial Folly. Carmen M. Reinhart & Kenneth S. Rogoff. Figure 10.1, p. 156 Will it happen again? (6)
- 13. The Interconnected & Changing World of Finance (1) 32 2 Total = 34% Liabilities Deposits & other accounts Capital & reserves Assets Cash & at call Acceptances & discounts Treasury bills & gilts Loans, advances & other Premises & other 17 4 1 6 6 David Sheppard (1971) The Growth and Rule of UK Financial Institutions 1880-1966 Adair Turner, In: What do Banks Do? What should they do? 17th March 2010, p.8 1964: UK banks’ aggregate balance sheets as % of GDP
- 14. Adair Turner, In: What do Banks Do? What should they do? 17th March 2010, p.8 UK banks’ aggregate balance sheets as % of GDP2007: 180 126 71 107 Total = 497% Liabilities Non-residents deposits (including from banks) Other Assets Market loans to non-residents (including banks) Investments 26 Repos 70 86 28 118 22 107 31 UK residents deposits Deposits from UK banks Capital & reserves Cash, central bank, T-bills, gilts Advances to UK & non-residents 2 20 Market loans to UK residents Market loans to UK banks Repos Other The Interconnected & Changing World of Finance (2)
- 15. Will it happen again? (7) • CAT bonds (in Europe) • Climate bonds • Second hand car loans (in the US) Low-key comedy clip about US second hand car loans and securitization: https://youtu.be/4U2eDJnwz_s
- 16. Solutions • Looking at risks in a network and in the system (instead of in isolation, as a company or at the risk) • Being more accurate and forward looking (instead of precise and dead-wrong). Source: Recent Advances in Modelling Systemic Risk Using Network Analysis, European Central Bank. January 2010, p.17 Source: The Financial Times, 9 October 2008, p.15
Editor's Notes
- The under title is a play on former Princeton professor Anne-Marie Slaugther’s “The chessboard and the web” , a book that came our earlier this year about the important role of network strategies in international relations.
- Securitizations in its simplest most basic form, consists of 2 steps. First, the party that wants to transfer risk —typically the risk of assets that this originating party is holding— sells these assets to an issuer. This issuer typically is a so called Special Purpose Vehicle (SPV), which is often nothing more than a shell company established specifically for the securitization deal, hence its name. Second, the issuer divides the underlying risk in certain hierarchical risk buckets. This process is called tranching, and the risk buckets are called tranches. Each tranche has a different level of risk associated with it and is sold separately to investors with various risk appetites. Both investment return and losses are allocated among the various tranches according to their seniority. When the risk of the assets in the SPV materializes, this risk is firstly allocated to the least senior (or: junior) tranche. This is also the tranche that pays the investor the most return if the risk does not materialize. The least risky tranche, the senior one, pays the lowest return.
- Securitization can have the advantages of making an asset more liquid by allowing a broader range of investors to indirectly invest in it. For example, typically only banks will own large pools of residential mortgages, as the issuing of mortgages is a specialized business. Yet, when a pools of residential mortgages is securitized, investors like pension funds and insurers can indirectly invest in these assets by buying notes in the tranches. Because of the tranching, investors can also more accurately select the level of risk that they want to expose themselves to.
- Originators were originating mortgages with the intent to sell off these mortgaes in a securitisation. This took away the incentive of banks to lend to cerditworthy parties. Investors did not know this, as they simply trusted the CRA’s to have done their homework. These CRA’s were paid to rate the securitizations by….the originators. On top of that, capital charges as setby regulators were too low, espeically for IRB banks. The use of VaR, their intrnal models, was also problematic, as we will discuss later.
- In the Basel II framework, the RW for AAA senior tranches was 7%. I’m assuming you are familiar with the calculation of regulatory capital. At the times, the required capital buffer was 8% times the RWA. A floor of 7% risk weight (RW) gives thus a capital charge of 0,56%. Less than $1 for every $100 in assets… you can see how this introduces leverage in the system. You can also see how the cliff effect works procyclical. One can see clearly here, that indeed the RWs in the new framework show a less steep increase when tranche quality deteriorates. Also one can see that for high quality, the red line (new) is significantly above the blue line (current).
- Retention ruls were a good way to align incentives of orignators again. Under these rules, the originator has to hold 5% of the unlderying pool on its balance. It can do this in a few different ways, but the crux stays the same. The Basel worstream that I was the Dutch representative in, worked on a new securitizations framework for 4 years. It was consulted twice, and published in December 2014. It will come into effect in 2018. This new framework has a different hierarchy of approaches (the same for SA and IRB banks this time), it has overal increased risk weights, and different risk drivers. It contains a floor of 20% RW, so now, a senior AAA note will bear a capital charge of 1,6% (versus the 0.56%). This still seems small, but it is also almost a tripling to before. Plus, the capital buffer has increased since the GFC, and banks now have to hold more than 8% (depending also on whether they are a SIFI). (The “if allowed in jursidiction” is there because Dodd-Frank forbids the use of external credit ratings.) Also includes a cap, which states that 1) total capital for all tranched held does not have to be higher than capital for underlyig pool and 2) RW of senior tranche doesn’t have to be higher than RW of underlying pool.
- Will this be enough? Well, let’s recap what actually happened in the Global Financial Crisis (GFC). Securitizations had up until 2007 shown few losses. Because banks’ internal models were and still are based on historical data, the capital charges were relatively low for these supposedly low risk securitizations. They became a popular instrument for many investors, and so over time more and more assets were securitized to satisfy demand, including high risk assets like subprime mortgages. When the credit risk of these subprime mortgages materialized, i.e., people started to default, the securitizations started to make losses and their market price dropped. This caused banks’ internal sell limits as determined by their models to break, which then compelled the banks to sell the assets, which depressed prices even more, causing other investors to sell securitizations, leading to more losses and intern sells limits to break, causing the sale of other assets, causing declines in overall market prices, causing more fire sales, causing liquidity to dry up, constituting crisis.
- Almost every bank at the times calculated their expected losses according to VaR.
- What’s this? A 27-standard deviation exception? An anomaly?
- So what were the real underlying factors that cause this to happen? In my opinion: Leverage in the system. This was due to too low capital charges, but also, some argue because of universal banking. This is why in the US, some senators and other politicians are calling to reinstall Glass-Stegall. (Who don’t discuss this in Europe because we are already overbanked, we can’t go back to that without breaking the economy). Other argue flash trade destabilizes markets as well, hence the call for a financial transaction tax. Looking at risks in isolation and internally: we assess risks in a 2 dimensional likelihood/severity plot. But we dot not take into consideration how risks influence eachother. For example, we were looking at credit risk, but the VaR limits the were broken were from market risks. We still have all these different Basel frameworks: credit, market, liquidity…. While in reality, these risks do not occur in isolation. Even within credit risk, individual borrowers are assessed on creditworthiness. But if a few people go bankrupt in an area, it might influence price drops in other houses, causing a domino effect. Lastly, using the past to predict the future. Usa of VaR models, for example: used past data only Sometimes assumed normal distributions and constant (co)variances where there was no basis to assume so
- So back to the question of whether it was an anomaly? This is from Harvard. The time that all those fancy models (Black-Scholes, VaR) were developed? The end of that flatline. Where relationships stayed so nicely the same. This is the time of the “end of history” optimism (Fukuyama). The Bretton Woods period, with fixed currencies, the gold standard, the baby-booming generation (broad base to pay pensions) and limited capital flows across borders. But are we there now?
- Similar picture for banking crisis only. The dotted line shows the capital mobility. Think about capital mobility as an indicator for…..? Financial interconnectedness.
- In the flatline period.
- Now.
- Back to the questions of whether the new securitization framework will be enough. There are several securitization products that are increasing in popularity. Catastrophe bonds were first issued in the mid 1990's, after major catastrophe events which hit the U.S. such as the Northridge earthquake and Hurricane Andrew hit the insurance industry with unprecedented losses at the time. Since then over 280 CAT bond transaction have taken place, according to Artemis, a European industry organizations for CAT bonds (2017a). The numbers of transactions as well as the total amount these have accumulated in the market, keep rising every year. The outstanding market size at the end of March 2017 was $27.19 billion, the largest outstanding amount of CAT bonds ever. CAT bonds are a kind of securitization. The originator is typically an insurer, and the underlying risk is does not come from financial assets but from the probability of a catastrophic event such as a hurricane, earthquake, or typhoon (Artemis, 2017b). This is precisely the reason that most of the financial sector argues that it is a great diversification tool. Regulators also actually tend to like it, because climate change can easily cause claims surpassing the insurance industry’s financial capacity. Historic losses on CAT bonds are very low. Recognize the picture by now? The same story goes for climate bonds: These bonds are issued with the specific goal of raising funding for climate change mitigation or adaptation related projects or programs. Such goals include clean energy, energy efficiency, as well as climate change adaptation projects. The certification organization for Climate Bonds, the Climate Bonds Initiative (CBI), estimates that the global market will grow to $151 billion this year. Governments need this private sector funding badly. They made an agreement in Paris around climate change (except for the US now, I guess) but most of them do not have the money to fund the energy transition from fossil to renewable by themselves. One of the lobby goals of the CBI is to….. Lower capital charges for climate bonds, just like Artemis is lobbying for a more favorable treatment for CAT bonds. Since rules for mortgage lending were tightened after the GFC, banks found other ways to attract consumer funding. Some claim this could be the new subprime bubble to burst. Will it? This depends on whether regulators will have learned their lesson AND if after-GFC regulations (Dodd-Frank) stay in place (Trump wants to repeal it).
- So, plenty of new products and financial regulations (or lack thereof) that can cause a new market bubble. Sticking our heads in the sand of our internal models and calculate appropriate capital charges all day long will not prevent that. This is true for all financial products, but especially so for complex ones, as these typically introduce leverage AND whose models can lull you into a false sense of precision. It is a tempting illusion to think that if you just work hard and think thing through, you’ll have control. But the biggest impacts on your business might come from the outside of your company, and outside of you sphere of influence. Still, you should be prepared.
- Based on latest in academic research in physics, economics, mathematics/network theory, and social science. It taps into the available knowledge within organization to arrive at the network. Because the latest academic science tells us that in absence of relevant or reliable data, a group of experienced experts are the best forecasters.