SlideShare a Scribd company logo
1 of 9
Download to read offline
Index and Products Comparison (31/05/2012)
Dated:                                                                           Performance in USD                           Sharpe
                             Gold Exposure                                                                       Volatility
12/06/2012                                                             5 year      3 year      1 year    YTD                   Ratio
BBG code:                                               Exposure*
PHAU LN EQUITY     ETFS Physical Gold                       C         131.96%     57.89%       1.51%    -0.47%    22.3%        0.06
SGOL US EQUITY     ETFS Physical Swiss Gold Shares           C         0.00%       0.00%       1.26%    -0.22%    21.5%        0.05
GBS LN EQUITY      Gold Bullion Securities                   C        131.99%     57.90%       1.49%    -0.39%    22.4%        0.06
GLD US EQUITY      SPDR Gold Trust                           C        131.34%     57.61%       1.28%    -0.24%    21.6%        0.05
IAU US EQUITY      iShares Gold Trust                        C        -76.81%     -84.20%      1.33%    -0.13%    21.5%        0.06


Dated:                                                                           Performance in USD                           Sharpe
                             Silver Exposure                                                                     Volatility
12/06/2012                                                             5 year      3 year      1 year    YTD                   Ratio
BBG code:                                               Exposure*
SIVR US EQUITY     ETFS Physical Silver Shares              C          0.00%       0.00%      -27.00%   0.11%     41.6%       -0.65
PHAG LN EQUITY     ETFS Physical Silver                      C        101.97%     75.98%      -26.86%   -0.83%    42.1%       -0.64
AGQ US EQUITY      ProShares Ultra Silver (x2)               C         0.00%      -28.31%     -80.35%   -5.16%    41.6%       -1.94
SLV US EQUITY      iShares Silver Trust                      C        -79.86%     74.27%      -27.19%   0.07%     41.6%       -0.66


Dated:                                                                           Performance in USD                           Sharpe
                           Palladium Exposure                                                                    Volatility
12/06/2012                                                             5 year      3 year      1 year    YTD                   Ratio
BBG code:                                               Exposure*
PALL US EQUITY     ETFS Physical Palladium Shares           C          0.00%       0.00%      -20.57%   -6.26%    41.6%       -0.48
IPDM LN EQUITY     iShares Physical Palladium                C         0.00%       0.00%      -22.53%   -6.98%    41.6%       -0.50
*Exposure: C = Commodities. Securities in grey belong to ETF Securities. Data Source: Bloomberg, ETFS
Dated:                                                                                             Performance in USD                        Sharpe
                                                             Global Agriculture Exposure                                                            Volatility
                 31/05/2012                                                                                   5 year    3 year   1 year     YTD                   Ratio

BBG code                BBG Index code            Passive:                                        Exposure*
AGRI LN EQUITY          AGRIT INDEX               S-NET ITG Global Agribusiness Index                  E      32.1%     23.1%    -15.6%     1.0%     26.6%       -0.59
FAGR LN EQUITY          DJUBAG3T INDEX            Dow Jones-UBS Forward Agriculture Index              C      39.7%     19.8%    -22.1%     -8.8%    18.9%       -1.18
AIGA LN EQUITY          DJUBAGTR INDEX            Dow Jones-UBS Agriculture Index                      C      18.2%     11.3%    -22.2%     -7.3%    19.9%       -1.12

                        DBAGIX INDEX              DBIQ Diversified Agriculture Index                   C      1.2%      -5.7%    -19.6%     -9.1%    33.8%       -0.58

                        SPAEREDT INDEX            S&P Global Agribusiness Index                        E                24.9%    -15.4%     -1.2%    24.4%       -0.64

                        DXAG INDEX                DAX Global Agribusiness Index                        E      29.4%     32.9%    -12.8%     -0.4%    24.8%       -0.52

                        RICIAGTR INDEX            Rogers International Index - Agriculture             C      -4.0%     5.0%     -24.0%     -8.2%    16.6%       -1.45

                        RIEHA INDEX               RICI Enhanced Agriculture Index                      C      30.8%     20.3%    -18.6%     -7.4%    14.8%       -1.26

                                                  Active:
                        WLDA2US LX EQUITY         Blackrock Global Agriculture Fund                   E+C                        -16.5%     -1.3%    25.1%       -0.66

                        SARAGAA LN EQUITY         Sarasin Funds ICVC - AgriSar Fund                    E                15.0%    -15.7%     1.3%     21.3%       -0.74

                        CAMGLAC LX EQUITY         Amundi Funds - Global Agriculture                    E                24.4%    -19.2%     -2.6%    23.2%       -0.83
                        SASAGAA LX EQUITY         Schroders Alternative Solutions - Agriculture        C      -1.0%     -0.4%    -23.9%     -7.5%    13.6%       -1.77
                        JBAGRDB LX EQUITY         Julius Baer Multistock - Agriculture Fund           E+C     0.0%      16.9%    -23.5%     -3.0%    22.0%       -1.07
                        BAGRAGA LN EQUITY         Baring Global Agriculture Fund                       E      0.0%      17.2%    -16.5%     1.6%     26.4%       -0.63
                        CFEAAGA LN EQUITY         CF Eclectica Agriculture Fund                       E+C     0.0%      12.6%    -16.9%     -0.5%    23.0%       -0.74
                        CSQAADP ID EQUITY         Castlestone Management Agriculture Fund              C      0.0%      -7.9%    -16.4%              12.8%       -1.30
                        ALAGDAT LX Equity         Allianz RCM Global Agriculture Trends                E      0.0%      37.3%    -13.6%     1.8%     28.5%       -0.48
                        DWIGAA2 LX EQUITY           DWS Invest Global Agribusiness                      E     -7.6%     30.2%    -18.2%     1.7%     24.9%       -0.74
*C = Commodities, E = Equities. Securities in grey belong to ETF Securities. Data Source: Bloomberg, ETFS
• DJ UBS offers 2 different types of indexes on Commodities:
  DJ UBS Commodity 3 months Forward Indexes provides exposure to futures returns 3 months further
  out on the futures curve than the Classic DJ UBS Commodity Indexes underlying contracts for front
  month
• Thus, the Classic is exposed to contracts approx 1-3 months from expiry, and the Forward Index is
  exposed to contracts approx 4-6 months from expiry
• Both indexes roll passively on fixed, regular and transparent schedule
• When the curve is in contango, the roll cost tends to be reduced when choosing an exposition to
  forward contracts instead of front month contracts
Agricultural Index Comparison


                                     Source: DB indexes, Dow Jones Indexes, ETFS


• Our Index is much weighted on Soybean, thus benefiting from the better than its peers performance
  and the momentum of the underlying
• Our index has no exposure to Cocoa; this is a very volatile commodity that has deeply
  underperformed last year
Dated:                                                                                          Performance in USD
                                                                            OIL Exposure                                                         Arab Spring   Iranian Oil                Sharpe
               31/05/2012                                                                               5 year    3 year     1 year     YTD        2011**      Sanctions+    Volatility    Ratio
                  BBG code                      Passive
   OILB LN
   EQUITY           OILB LN EQUITY              ETFS Brent 1 month                                      7.10%     41.00%     -6.10%    -3.40%      35.00%        -2.20%       23.70%      -0.26
   FCRU LN
    Equity          DJUBCL3T INDEX              Dow Jones-UBS Forward WTI Crude Oil Subindex             4.50%    7.60%      -16.30%   -12.80%     23.30%        -5.30%       28.70%      -0.57
                    DBOLIX INDEX                Powershares DB Oil Fund                                  -0.40%    2.10%     -17.00%   -12.90%     24.00%        -5.20%       27.00%      -0.63
                    USO US EQUITY               US OIL Fund                                             -33.40%   -10.40%    -17.90%   -14.40%     17.60%        -7.40%       28.80%      -0.63
                    SPGSCLTR INDEX              IPATH S&P GSCI CRUDE OIL ETN                            -36.50%    -8.40%    -17.20%   -14.10%     18.50%        -8.00%       30.10%      -0.57
                                                                ENERGY Basket Exposure
   AIGE LN
    Equity          DJUBENTR INDEX              Dow Jones-UBS Energy Subindex                           -65.30%   -36.80%    -31.80%   -16.60%     15.10%       -20.40%       22.50%      -1.42
   ENEF LN
    Equity          DJUBEN3T INDEX              Dow Jones-UBS Forward Energy Subindex                   -46.40%   -25.10%    -27.10%   -13.00%     19.30%       -15.20%       21.00%       -1.3
   AIGO LN
    Equity          DJUBPETR INDEX              Dow Jones-UBS Petroleum Subindex                        -22.20%   6.90%      -12.10%   -8.30%      21.30%        -4.70%       26.40%      -0.46
   FPET LN
    Equity          DJUBPE3T INDEX              Dow Jones-UBS Forward Petroleum Subindex                11.50%    17.90%     -12.20%   -8.00%     26.30%         -3.10%       25.60%      -0.48
                                                Active
                    MERENER LX EQUITY           Blackrock Global Funds - World Energy Fund              -20.50%   1.30%      -27.60%   -11.30%     13.90%       -16.40%       29.60%      -0.94
                    SCHGLAA LX EQUITY           Schroder International Selection - Global Energy Fund   -21.00%   -1.80%     -34.70%   -12.80%     15.40%       -14.60%       29.70%      -1.17
                    GUIGLEI LX EQUITY           Investec Global Energy Fund                             -17.50%   -1.90%     -28.20%    -8.50%     18.50%       -14.50%       33.80%      -0.84
                    ARTGLER LN EQUITY           Artemis Global Energy Fund                                                              4.70%                    -2.60%       23.90%      -0.01
                    BBOOSNRG INDEX              Bloomberg's Active Energy Index for Funds               -85.40%   -76.60%    -60.40%   -26.60%     -4.90%       -38.40%       31.20%      -1.94
Securities in grey belong to ETF Securities. Data Source: Bloomberg, ETFS
ETFS Energy DJ-UBSCI (Dow Jones-UBS Energy Subindex)


ETFS Petroleum DJ-UBSCI (Dow Jones-UBS Petroleum Subindex)
• DJ UBS offers 2 different types of indexes on Commodities:
  DJ UBS Commodity 3 months Forward Indexes provides exposure to futures returns 3 months further
  out on the futures curve than the Classic DJ UBS Commodity Indexes underlying contracts for front
  month
• Thus, the Classic is exposed to contracts approx 1-3 months from expiry, and the Forward Index is
  exposed to contracts approx 4-6 months from expiry
• Both indexes roll passively on fixed, regular and transparent schedule
• When the curve is in contango, the roll cost tends to be reduced when choosing an exposition to
  forward contracts instead of front month contracts
Dated:                                                                                              Performance in USD                                          Trailing 12
                                                                                                                                                                                   Month
                                                                 Global Income exposure
                                                                                                                                             01/08/2011-                Sharpe    Dividend
              31/05/2012                                                                        5 year      3 year     1 year       YTD      30/09/2011    Volatility    Ratio     Yield*
                   BBG code                   Passive
GDIV LN
Equity             DJGSDT INDEX               Dow Jones Global Select Dividend Index           -16.30%     45.60%     -12.70%     -2.90%       -10.40%      20.90%      -0.62       5.58
                   SDGP INDEX                 STOXX Global Select Dividend 100 Index           -43.20%     26.90%     -14.70%      -4.80%      -10.30%      17.30%      -0.86       5.99
                   MERGDATT INDEX             Mergent International Dividend Achievers Index   -17.90%     34.90%     -11.60%      -3.50%      -12.70%      22.30%      -0.53       3.98
                   SPGTGDOT INDEX             S&P Global Dividend Opportunities Index                      28.40%     -18.50%      -7.50%      -13.20%      21.70%      -0.86       7.33
                   WTGDHYTR INDEX             Wisdom Tree Global Equity Income Index                       25.80%     -14.30%      -3.70%      -12.40%      21.20%      -0.68       5.99

                                              Active
                   VERGLIS ID Equity          Veritas Global Equity Income Fund                 6.10%      38.50%      -6.10%        0.70%     -13.30%      19.60%      -0.32        4.8
                   MLGEEAU LX Equity          Blackrock Global Enhanced Equity Yield Fund      -20.10%     23.50%     -10.60%       -2.50%     -14.30%      19.90%      -0.54       9.73
                   SGBQTIA LN Equity          Schroder Global Equity Income Fund                           26.70%     -10.30%        0.20%     -13.10%      21.10%      -0.49       4.77
                   MGGDAIG LN Equity          M&G Global Dividend Fund                                     51.20%      -8.10%        1.70%     -13.20%      21.30%      -0.39       3.97
                   NEWGIII LN Equity          Newton Global Higher Income Fund                             41.10%      -4.30%        1.30%      -9.60%      16.50%      -0.27       5.51
                   LAZGEII LN Equity          Lazard Global Equity Income Fund                             31.70%     -10.30%        0.30%     -13.50%      21.40%      -0.49       5.74
                   BSET LN EQUITY             British Assets Trust PLC                          -25.80%    26.80%     -20.40%       -2.90%     -14.70%      27.40%      -0.75       5.91
                   HINT LN Equity             Henderson International Income Trust                                                   5.00%     -11.90%      16.30%      -0.01       1.73
                   MYI LN Equity              Murray International Trust PLC                     28.90%     51.80%       -6.60%      0.60%     -14.00%      22.70%       -0.3       4.51
                   STS LN Equity              Securities Trust of Scotland                      -16.10%     53.90%       -1.30%      4.10%      -9.10%      24.30%      -0.06       4.54
Securities in grey belong to ETF Securities. Data Source: Bloomberg, ETFS                      * Dividend Yield = Gross at 31/01/2012
ETFX-BofAML IVSTOXX ETF:VSTX LN <Equity> (Eurostoxx 50 Volatility ETF)

• Volatility serves as a good hedging tool when turmoil arises in the markets
• Last Euro zone’s peripheral debt worries have put the markets on the edge seeing volatility increasing heavily in
  that period
• Gaining exposure to our Volatility ETF since March 2011 has returned a 29.13% profitability, while hedging the
  portfolio during severe scenarios

More Related Content

What's hot

Dividend Weekly Stock Yield Rep12/13 By http://long-term-investments.blogspot...
Dividend Weekly Stock Yield Rep12/13 By http://long-term-investments.blogspot...Dividend Weekly Stock Yield Rep12/13 By http://long-term-investments.blogspot...
Dividend Weekly Stock Yield Rep12/13 By http://long-term-investments.blogspot...Dividend Yield
 
Dividend Weekly 45 2012 By http://long-term-investments.blogspot.com
Dividend Weekly 45 2012 By http://long-term-investments.blogspot.comDividend Weekly 45 2012 By http://long-term-investments.blogspot.com
Dividend Weekly 45 2012 By http://long-term-investments.blogspot.comDividend Yield
 
Dividend weekly 02 2013 By http://long-term-investments.blogspot.com
Dividend weekly 02 2013 By http://long-term-investments.blogspot.comDividend weekly 02 2013 By http://long-term-investments.blogspot.com
Dividend weekly 02 2013 By http://long-term-investments.blogspot.comDividend Yield
 
Dividend Weekly World 51 2012 by http://long-term-investments.blogspot.com
Dividend Weekly World 51 2012 by http://long-term-investments.blogspot.comDividend Weekly World 51 2012 by http://long-term-investments.blogspot.com
Dividend Weekly World 51 2012 by http://long-term-investments.blogspot.comDividend Yield
 
Dividend weekly 03 2013
Dividend weekly 03 2013Dividend weekly 03 2013
Dividend weekly 03 2013Dividend Yield
 
Copy Of Brydges Master 2010
Copy Of Brydges Master 2010Copy Of Brydges Master 2010
Copy Of Brydges Master 2010rbbrydges
 
Dividend Weekly 47/2012 By http://long-term-investments.blogspot.com
Dividend Weekly 47/2012 By http://long-term-investments.blogspot.comDividend Weekly 47/2012 By http://long-term-investments.blogspot.com
Dividend Weekly 47/2012 By http://long-term-investments.blogspot.comDividend Yield
 
Managing Abu Dhabi's $627 Billion Sovereign Wealth Fund (ADIA), Presentation ...
Managing Abu Dhabi's $627 Billion Sovereign Wealth Fund (ADIA), Presentation ...Managing Abu Dhabi's $627 Billion Sovereign Wealth Fund (ADIA), Presentation ...
Managing Abu Dhabi's $627 Billion Sovereign Wealth Fund (ADIA), Presentation ...Aaron Beydoun
 
Dividend Weekly No. 36/2013 By http://long-term-investments.blogspot.com
Dividend Weekly No. 36/2013 By http://long-term-investments.blogspot.comDividend Weekly No. 36/2013 By http://long-term-investments.blogspot.com
Dividend Weekly No. 36/2013 By http://long-term-investments.blogspot.comDividend Yield
 
Dividend Weekly - World Yield Report No. 22/2013 By http://long-term-investme...
Dividend Weekly - World Yield Report No. 22/2013 By http://long-term-investme...Dividend Weekly - World Yield Report No. 22/2013 By http://long-term-investme...
Dividend Weekly - World Yield Report No. 22/2013 By http://long-term-investme...Dividend Yield
 
Lincoln crowne copper gold weekly 08072013 : AUD impact on Sector
Lincoln crowne copper gold weekly  08072013 :  AUD impact on SectorLincoln crowne copper gold weekly  08072013 :  AUD impact on Sector
Lincoln crowne copper gold weekly 08072013 : AUD impact on SectorLincoln Crowne & Company
 
Dividend weekly 24 2013
Dividend weekly 24 2013Dividend weekly 24 2013
Dividend weekly 24 2013Dividend Yield
 
Dividend weekly 11 2013 By http://long-term-investments.blogspot.com
Dividend weekly 11 2013 By http://long-term-investments.blogspot.comDividend weekly 11 2013 By http://long-term-investments.blogspot.com
Dividend weekly 11 2013 By http://long-term-investments.blogspot.comDividend Yield
 
PCF Capital's Resources Thermometer - October 2015
PCF Capital's Resources Thermometer -  October 2015PCF Capital's Resources Thermometer -  October 2015
PCF Capital's Resources Thermometer - October 2015Darren Martin
 
Dividend Weekly 44/2012 By http://long-term-investments.blogspot.com/
Dividend Weekly 44/2012 By http://long-term-investments.blogspot.com/Dividend Weekly 44/2012 By http://long-term-investments.blogspot.com/
Dividend Weekly 44/2012 By http://long-term-investments.blogspot.com/Dividend Yield
 
Dividend Weekly 49 2012 By http://long-term-investments.blogspot.com
Dividend Weekly 49 2012 By http://long-term-investments.blogspot.comDividend Weekly 49 2012 By http://long-term-investments.blogspot.com
Dividend Weekly 49 2012 By http://long-term-investments.blogspot.comDividend Yield
 
PCF Capital Group - Resources Thermometer - April 2017
PCF Capital Group - Resources Thermometer - April 2017PCF Capital Group - Resources Thermometer - April 2017
PCF Capital Group - Resources Thermometer - April 2017Sam Main
 
Dividend weekly 31 2013 By http://long-term-investments.blogspot.com
Dividend weekly 31 2013 By http://long-term-investments.blogspot.comDividend weekly 31 2013 By http://long-term-investments.blogspot.com
Dividend weekly 31 2013 By http://long-term-investments.blogspot.comDividend Yield
 

What's hot (20)

Dividend Weekly Stock Yield Rep12/13 By http://long-term-investments.blogspot...
Dividend Weekly Stock Yield Rep12/13 By http://long-term-investments.blogspot...Dividend Weekly Stock Yield Rep12/13 By http://long-term-investments.blogspot...
Dividend Weekly Stock Yield Rep12/13 By http://long-term-investments.blogspot...
 
Dividend Weekly 45 2012 By http://long-term-investments.blogspot.com
Dividend Weekly 45 2012 By http://long-term-investments.blogspot.comDividend Weekly 45 2012 By http://long-term-investments.blogspot.com
Dividend Weekly 45 2012 By http://long-term-investments.blogspot.com
 
Dividend weekly 02 2013 By http://long-term-investments.blogspot.com
Dividend weekly 02 2013 By http://long-term-investments.blogspot.comDividend weekly 02 2013 By http://long-term-investments.blogspot.com
Dividend weekly 02 2013 By http://long-term-investments.blogspot.com
 
Dividend Weekly World 51 2012 by http://long-term-investments.blogspot.com
Dividend Weekly World 51 2012 by http://long-term-investments.blogspot.comDividend Weekly World 51 2012 by http://long-term-investments.blogspot.com
Dividend Weekly World 51 2012 by http://long-term-investments.blogspot.com
 
Dividend weekly 03 2013
Dividend weekly 03 2013Dividend weekly 03 2013
Dividend weekly 03 2013
 
Oz Metals 20150510
Oz Metals 20150510Oz Metals 20150510
Oz Metals 20150510
 
Copy Of Brydges Master 2010
Copy Of Brydges Master 2010Copy Of Brydges Master 2010
Copy Of Brydges Master 2010
 
Dividend Weekly 47/2012 By http://long-term-investments.blogspot.com
Dividend Weekly 47/2012 By http://long-term-investments.blogspot.comDividend Weekly 47/2012 By http://long-term-investments.blogspot.com
Dividend Weekly 47/2012 By http://long-term-investments.blogspot.com
 
Managing Abu Dhabi's $627 Billion Sovereign Wealth Fund (ADIA), Presentation ...
Managing Abu Dhabi's $627 Billion Sovereign Wealth Fund (ADIA), Presentation ...Managing Abu Dhabi's $627 Billion Sovereign Wealth Fund (ADIA), Presentation ...
Managing Abu Dhabi's $627 Billion Sovereign Wealth Fund (ADIA), Presentation ...
 
Dividend Weekly No. 36/2013 By http://long-term-investments.blogspot.com
Dividend Weekly No. 36/2013 By http://long-term-investments.blogspot.comDividend Weekly No. 36/2013 By http://long-term-investments.blogspot.com
Dividend Weekly No. 36/2013 By http://long-term-investments.blogspot.com
 
Dividend Weekly - World Yield Report No. 22/2013 By http://long-term-investme...
Dividend Weekly - World Yield Report No. 22/2013 By http://long-term-investme...Dividend Weekly - World Yield Report No. 22/2013 By http://long-term-investme...
Dividend Weekly - World Yield Report No. 22/2013 By http://long-term-investme...
 
Lincoln crowne copper gold weekly 08072013 : AUD impact on Sector
Lincoln crowne copper gold weekly  08072013 :  AUD impact on SectorLincoln crowne copper gold weekly  08072013 :  AUD impact on Sector
Lincoln crowne copper gold weekly 08072013 : AUD impact on Sector
 
Dividend weekly 24 2013
Dividend weekly 24 2013Dividend weekly 24 2013
Dividend weekly 24 2013
 
Dividend weekly 11 2013 By http://long-term-investments.blogspot.com
Dividend weekly 11 2013 By http://long-term-investments.blogspot.comDividend weekly 11 2013 By http://long-term-investments.blogspot.com
Dividend weekly 11 2013 By http://long-term-investments.blogspot.com
 
PCF Capital's Resources Thermometer - October 2015
PCF Capital's Resources Thermometer -  October 2015PCF Capital's Resources Thermometer -  October 2015
PCF Capital's Resources Thermometer - October 2015
 
Dividend Weekly 44/2012 By http://long-term-investments.blogspot.com/
Dividend Weekly 44/2012 By http://long-term-investments.blogspot.com/Dividend Weekly 44/2012 By http://long-term-investments.blogspot.com/
Dividend Weekly 44/2012 By http://long-term-investments.blogspot.com/
 
Dividend Weekly 49 2012 By http://long-term-investments.blogspot.com
Dividend Weekly 49 2012 By http://long-term-investments.blogspot.comDividend Weekly 49 2012 By http://long-term-investments.blogspot.com
Dividend Weekly 49 2012 By http://long-term-investments.blogspot.com
 
PCF Capital Group - Resources Thermometer - April 2017
PCF Capital Group - Resources Thermometer - April 2017PCF Capital Group - Resources Thermometer - April 2017
PCF Capital Group - Resources Thermometer - April 2017
 
Dividend weekly 31 2013 By http://long-term-investments.blogspot.com
Dividend weekly 31 2013 By http://long-term-investments.blogspot.comDividend weekly 31 2013 By http://long-term-investments.blogspot.com
Dividend weekly 31 2013 By http://long-term-investments.blogspot.com
 
Galloway Capital
Galloway CapitalGalloway Capital
Galloway Capital
 

Similar to Comparison analysis june 2012

Similar to Comparison analysis june 2012 (20)

Dividend Weekly Preview
Dividend Weekly PreviewDividend Weekly Preview
Dividend Weekly Preview
 
Fif
FifFif
Fif
 
Murchison Minerals Ltd (MUR) Stock Analysis
Murchison Minerals Ltd (MUR) Stock AnalysisMurchison Minerals Ltd (MUR) Stock Analysis
Murchison Minerals Ltd (MUR) Stock Analysis
 
Cob 20080617 1
Cob 20080617 1Cob 20080617 1
Cob 20080617 1
 
Cob 20080919 1
Cob 20080919 1Cob 20080919 1
Cob 20080919 1
 
CWEI Valuation Project
CWEI Valuation ProjectCWEI Valuation Project
CWEI Valuation Project
 
Irish life weekly investment bulletin
Irish life weekly investment bulletinIrish life weekly investment bulletin
Irish life weekly investment bulletin
 
Cob 20080728 1
Cob 20080728 1Cob 20080728 1
Cob 20080728 1
 
Allkem Limited (AKE) Stock Analysis
Allkem Limited (AKE) Stock AnalysisAllkem Limited (AKE) Stock Analysis
Allkem Limited (AKE) Stock Analysis
 
Analysis of Fund, Portfolio Creation and Var Analysis.
Analysis of Fund, Portfolio Creation and Var Analysis.Analysis of Fund, Portfolio Creation and Var Analysis.
Analysis of Fund, Portfolio Creation and Var Analysis.
 
Cob 20080722 1
Cob 20080722 1Cob 20080722 1
Cob 20080722 1
 
Nevada Copper Corp (NCU) Stock Analysis
Nevada Copper Corp (NCU) Stock AnalysisNevada Copper Corp (NCU) Stock Analysis
Nevada Copper Corp (NCU) Stock Analysis
 
Dividend Weekly World 16 2013 By http://long-term-investments.blogspot.com
Dividend Weekly World 16 2013 By http://long-term-investments.blogspot.comDividend Weekly World 16 2013 By http://long-term-investments.blogspot.com
Dividend Weekly World 16 2013 By http://long-term-investments.blogspot.com
 
Cob 20080709 1
Cob 20080709 1Cob 20080709 1
Cob 20080709 1
 
Cob 20080702 1
Cob 20080702 1Cob 20080702 1
Cob 20080702 1
 
International Investments
International InvestmentsInternational Investments
International Investments
 
Cob 20080717 1
Cob 20080717 1Cob 20080717 1
Cob 20080717 1
 
Cob 20080725 1
Cob 20080725 1Cob 20080725 1
Cob 20080725 1
 
Cob 20080616 1
Cob 20080616 1Cob 20080616 1
Cob 20080616 1
 
Cob 20080731 1
Cob 20080731 1Cob 20080731 1
Cob 20080731 1
 

More from Grupo Bursátil Mexicano

More from Grupo Bursátil Mexicano (7)

Vision de mercado y estrategias de inversion
Vision de mercado y estrategias de inversionVision de mercado y estrategias de inversion
Vision de mercado y estrategias de inversion
 
Product list usa_inv_prof
Product list usa_inv_profProduct list usa_inv_prof
Product list usa_inv_prof
 
Organigrama etfs latam 2012
Organigrama etfs latam 2012Organigrama etfs latam 2012
Organigrama etfs latam 2012
 
June 2012 monthly sales presentation usd mexico
June 2012   monthly sales presentation usd mexicoJune 2012   monthly sales presentation usd mexico
June 2012 monthly sales presentation usd mexico
 
Etf securities product list - eu002
Etf securities   product list - eu002Etf securities   product list - eu002
Etf securities product list - eu002
 
Conference ETFs commodities
Conference ETFs commoditiesConference ETFs commodities
Conference ETFs commodities
 
ETFs apalancados by Direxion
ETFs apalancados by DirexionETFs apalancados by Direxion
ETFs apalancados by Direxion
 

Recently uploaded

Call Girls Pune Just Call 9907093804 Top Class Call Girl Service Available
Call Girls Pune Just Call 9907093804 Top Class Call Girl Service AvailableCall Girls Pune Just Call 9907093804 Top Class Call Girl Service Available
Call Girls Pune Just Call 9907093804 Top Class Call Girl Service AvailableDipal Arora
 
Sales & Marketing Alignment: How to Synergize for Success
Sales & Marketing Alignment: How to Synergize for SuccessSales & Marketing Alignment: How to Synergize for Success
Sales & Marketing Alignment: How to Synergize for SuccessAggregage
 
Lucknow 💋 Escorts in Lucknow - 450+ Call Girl Cash Payment 8923113531 Neha Th...
Lucknow 💋 Escorts in Lucknow - 450+ Call Girl Cash Payment 8923113531 Neha Th...Lucknow 💋 Escorts in Lucknow - 450+ Call Girl Cash Payment 8923113531 Neha Th...
Lucknow 💋 Escorts in Lucknow - 450+ Call Girl Cash Payment 8923113531 Neha Th...anilsa9823
 
A DAY IN THE LIFE OF A SALESMAN / WOMAN
A DAY IN THE LIFE OF A  SALESMAN / WOMANA DAY IN THE LIFE OF A  SALESMAN / WOMAN
A DAY IN THE LIFE OF A SALESMAN / WOMANIlamathiKannappan
 
/:Call Girls In Jaypee Siddharth - 5 Star Hotel New Delhi ➥9990211544 Top Esc...
/:Call Girls In Jaypee Siddharth - 5 Star Hotel New Delhi ➥9990211544 Top Esc.../:Call Girls In Jaypee Siddharth - 5 Star Hotel New Delhi ➥9990211544 Top Esc...
/:Call Girls In Jaypee Siddharth - 5 Star Hotel New Delhi ➥9990211544 Top Esc...lizamodels9
 
Lowrate Call Girls In Sector 18 Noida ❤️8860477959 Escorts 100% Genuine Servi...
Lowrate Call Girls In Sector 18 Noida ❤️8860477959 Escorts 100% Genuine Servi...Lowrate Call Girls In Sector 18 Noida ❤️8860477959 Escorts 100% Genuine Servi...
Lowrate Call Girls In Sector 18 Noida ❤️8860477959 Escorts 100% Genuine Servi...lizamodels9
 
Eni 2024 1Q Results - 24.04.24 business.
Eni 2024 1Q Results - 24.04.24 business.Eni 2024 1Q Results - 24.04.24 business.
Eni 2024 1Q Results - 24.04.24 business.Eni
 
Regression analysis: Simple Linear Regression Multiple Linear Regression
Regression analysis:  Simple Linear Regression Multiple Linear RegressionRegression analysis:  Simple Linear Regression Multiple Linear Regression
Regression analysis: Simple Linear Regression Multiple Linear RegressionRavindra Nath Shukla
 
Progress Report - Oracle Database Analyst Summit
Progress  Report - Oracle Database Analyst SummitProgress  Report - Oracle Database Analyst Summit
Progress Report - Oracle Database Analyst SummitHolger Mueller
 
Call Girls in Mehrauli Delhi 💯Call Us 🔝8264348440🔝
Call Girls in Mehrauli Delhi 💯Call Us 🔝8264348440🔝Call Girls in Mehrauli Delhi 💯Call Us 🔝8264348440🔝
Call Girls in Mehrauli Delhi 💯Call Us 🔝8264348440🔝soniya singh
 
GD Birla and his contribution in management
GD Birla and his contribution in managementGD Birla and his contribution in management
GD Birla and his contribution in managementchhavia330
 
Call Girls In Connaught Place Delhi ❤️88604**77959_Russian 100% Genuine Escor...
Call Girls In Connaught Place Delhi ❤️88604**77959_Russian 100% Genuine Escor...Call Girls In Connaught Place Delhi ❤️88604**77959_Russian 100% Genuine Escor...
Call Girls In Connaught Place Delhi ❤️88604**77959_Russian 100% Genuine Escor...lizamodels9
 
VIP Kolkata Call Girl Howrah 👉 8250192130 Available With Room
VIP Kolkata Call Girl Howrah 👉 8250192130  Available With RoomVIP Kolkata Call Girl Howrah 👉 8250192130  Available With Room
VIP Kolkata Call Girl Howrah 👉 8250192130 Available With Roomdivyansh0kumar0
 
rishikeshgirls.in- Rishikesh call girl.pdf
rishikeshgirls.in- Rishikesh call girl.pdfrishikeshgirls.in- Rishikesh call girl.pdf
rishikeshgirls.in- Rishikesh call girl.pdfmuskan1121w
 
Call Girls In Radisson Blu Hotel New Delhi Paschim Vihar ❤️8860477959 Escorts...
Call Girls In Radisson Blu Hotel New Delhi Paschim Vihar ❤️8860477959 Escorts...Call Girls In Radisson Blu Hotel New Delhi Paschim Vihar ❤️8860477959 Escorts...
Call Girls In Radisson Blu Hotel New Delhi Paschim Vihar ❤️8860477959 Escorts...lizamodels9
 
7.pdf This presentation captures many uses and the significance of the number...
7.pdf This presentation captures many uses and the significance of the number...7.pdf This presentation captures many uses and the significance of the number...
7.pdf This presentation captures many uses and the significance of the number...Paul Menig
 
Insurers' journeys to build a mastery in the IoT usage
Insurers' journeys to build a mastery in the IoT usageInsurers' journeys to build a mastery in the IoT usage
Insurers' journeys to build a mastery in the IoT usageMatteo Carbone
 
Enhancing and Restoring Safety & Quality Cultures - Dave Litwiller - May 2024...
Enhancing and Restoring Safety & Quality Cultures - Dave Litwiller - May 2024...Enhancing and Restoring Safety & Quality Cultures - Dave Litwiller - May 2024...
Enhancing and Restoring Safety & Quality Cultures - Dave Litwiller - May 2024...Dave Litwiller
 
Intro to BCG's Carbon Emissions Benchmark_vF.pdf
Intro to BCG's Carbon Emissions Benchmark_vF.pdfIntro to BCG's Carbon Emissions Benchmark_vF.pdf
Intro to BCG's Carbon Emissions Benchmark_vF.pdfpollardmorgan
 
2024 Numerator Consumer Study of Cannabis Usage
2024 Numerator Consumer Study of Cannabis Usage2024 Numerator Consumer Study of Cannabis Usage
2024 Numerator Consumer Study of Cannabis UsageNeil Kimberley
 

Recently uploaded (20)

Call Girls Pune Just Call 9907093804 Top Class Call Girl Service Available
Call Girls Pune Just Call 9907093804 Top Class Call Girl Service AvailableCall Girls Pune Just Call 9907093804 Top Class Call Girl Service Available
Call Girls Pune Just Call 9907093804 Top Class Call Girl Service Available
 
Sales & Marketing Alignment: How to Synergize for Success
Sales & Marketing Alignment: How to Synergize for SuccessSales & Marketing Alignment: How to Synergize for Success
Sales & Marketing Alignment: How to Synergize for Success
 
Lucknow 💋 Escorts in Lucknow - 450+ Call Girl Cash Payment 8923113531 Neha Th...
Lucknow 💋 Escorts in Lucknow - 450+ Call Girl Cash Payment 8923113531 Neha Th...Lucknow 💋 Escorts in Lucknow - 450+ Call Girl Cash Payment 8923113531 Neha Th...
Lucknow 💋 Escorts in Lucknow - 450+ Call Girl Cash Payment 8923113531 Neha Th...
 
A DAY IN THE LIFE OF A SALESMAN / WOMAN
A DAY IN THE LIFE OF A  SALESMAN / WOMANA DAY IN THE LIFE OF A  SALESMAN / WOMAN
A DAY IN THE LIFE OF A SALESMAN / WOMAN
 
/:Call Girls In Jaypee Siddharth - 5 Star Hotel New Delhi ➥9990211544 Top Esc...
/:Call Girls In Jaypee Siddharth - 5 Star Hotel New Delhi ➥9990211544 Top Esc.../:Call Girls In Jaypee Siddharth - 5 Star Hotel New Delhi ➥9990211544 Top Esc...
/:Call Girls In Jaypee Siddharth - 5 Star Hotel New Delhi ➥9990211544 Top Esc...
 
Lowrate Call Girls In Sector 18 Noida ❤️8860477959 Escorts 100% Genuine Servi...
Lowrate Call Girls In Sector 18 Noida ❤️8860477959 Escorts 100% Genuine Servi...Lowrate Call Girls In Sector 18 Noida ❤️8860477959 Escorts 100% Genuine Servi...
Lowrate Call Girls In Sector 18 Noida ❤️8860477959 Escorts 100% Genuine Servi...
 
Eni 2024 1Q Results - 24.04.24 business.
Eni 2024 1Q Results - 24.04.24 business.Eni 2024 1Q Results - 24.04.24 business.
Eni 2024 1Q Results - 24.04.24 business.
 
Regression analysis: Simple Linear Regression Multiple Linear Regression
Regression analysis:  Simple Linear Regression Multiple Linear RegressionRegression analysis:  Simple Linear Regression Multiple Linear Regression
Regression analysis: Simple Linear Regression Multiple Linear Regression
 
Progress Report - Oracle Database Analyst Summit
Progress  Report - Oracle Database Analyst SummitProgress  Report - Oracle Database Analyst Summit
Progress Report - Oracle Database Analyst Summit
 
Call Girls in Mehrauli Delhi 💯Call Us 🔝8264348440🔝
Call Girls in Mehrauli Delhi 💯Call Us 🔝8264348440🔝Call Girls in Mehrauli Delhi 💯Call Us 🔝8264348440🔝
Call Girls in Mehrauli Delhi 💯Call Us 🔝8264348440🔝
 
GD Birla and his contribution in management
GD Birla and his contribution in managementGD Birla and his contribution in management
GD Birla and his contribution in management
 
Call Girls In Connaught Place Delhi ❤️88604**77959_Russian 100% Genuine Escor...
Call Girls In Connaught Place Delhi ❤️88604**77959_Russian 100% Genuine Escor...Call Girls In Connaught Place Delhi ❤️88604**77959_Russian 100% Genuine Escor...
Call Girls In Connaught Place Delhi ❤️88604**77959_Russian 100% Genuine Escor...
 
VIP Kolkata Call Girl Howrah 👉 8250192130 Available With Room
VIP Kolkata Call Girl Howrah 👉 8250192130  Available With RoomVIP Kolkata Call Girl Howrah 👉 8250192130  Available With Room
VIP Kolkata Call Girl Howrah 👉 8250192130 Available With Room
 
rishikeshgirls.in- Rishikesh call girl.pdf
rishikeshgirls.in- Rishikesh call girl.pdfrishikeshgirls.in- Rishikesh call girl.pdf
rishikeshgirls.in- Rishikesh call girl.pdf
 
Call Girls In Radisson Blu Hotel New Delhi Paschim Vihar ❤️8860477959 Escorts...
Call Girls In Radisson Blu Hotel New Delhi Paschim Vihar ❤️8860477959 Escorts...Call Girls In Radisson Blu Hotel New Delhi Paschim Vihar ❤️8860477959 Escorts...
Call Girls In Radisson Blu Hotel New Delhi Paschim Vihar ❤️8860477959 Escorts...
 
7.pdf This presentation captures many uses and the significance of the number...
7.pdf This presentation captures many uses and the significance of the number...7.pdf This presentation captures many uses and the significance of the number...
7.pdf This presentation captures many uses and the significance of the number...
 
Insurers' journeys to build a mastery in the IoT usage
Insurers' journeys to build a mastery in the IoT usageInsurers' journeys to build a mastery in the IoT usage
Insurers' journeys to build a mastery in the IoT usage
 
Enhancing and Restoring Safety & Quality Cultures - Dave Litwiller - May 2024...
Enhancing and Restoring Safety & Quality Cultures - Dave Litwiller - May 2024...Enhancing and Restoring Safety & Quality Cultures - Dave Litwiller - May 2024...
Enhancing and Restoring Safety & Quality Cultures - Dave Litwiller - May 2024...
 
Intro to BCG's Carbon Emissions Benchmark_vF.pdf
Intro to BCG's Carbon Emissions Benchmark_vF.pdfIntro to BCG's Carbon Emissions Benchmark_vF.pdf
Intro to BCG's Carbon Emissions Benchmark_vF.pdf
 
2024 Numerator Consumer Study of Cannabis Usage
2024 Numerator Consumer Study of Cannabis Usage2024 Numerator Consumer Study of Cannabis Usage
2024 Numerator Consumer Study of Cannabis Usage
 

Comparison analysis june 2012

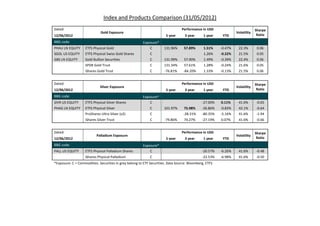
  • 1. Index and Products Comparison (31/05/2012) Dated: Performance in USD Sharpe Gold Exposure Volatility 12/06/2012 5 year 3 year 1 year YTD Ratio BBG code: Exposure* PHAU LN EQUITY ETFS Physical Gold C 131.96% 57.89% 1.51% -0.47% 22.3% 0.06 SGOL US EQUITY ETFS Physical Swiss Gold Shares C 0.00% 0.00% 1.26% -0.22% 21.5% 0.05 GBS LN EQUITY Gold Bullion Securities C 131.99% 57.90% 1.49% -0.39% 22.4% 0.06 GLD US EQUITY SPDR Gold Trust C 131.34% 57.61% 1.28% -0.24% 21.6% 0.05 IAU US EQUITY iShares Gold Trust C -76.81% -84.20% 1.33% -0.13% 21.5% 0.06 Dated: Performance in USD Sharpe Silver Exposure Volatility 12/06/2012 5 year 3 year 1 year YTD Ratio BBG code: Exposure* SIVR US EQUITY ETFS Physical Silver Shares C 0.00% 0.00% -27.00% 0.11% 41.6% -0.65 PHAG LN EQUITY ETFS Physical Silver C 101.97% 75.98% -26.86% -0.83% 42.1% -0.64 AGQ US EQUITY ProShares Ultra Silver (x2) C 0.00% -28.31% -80.35% -5.16% 41.6% -1.94 SLV US EQUITY iShares Silver Trust C -79.86% 74.27% -27.19% 0.07% 41.6% -0.66 Dated: Performance in USD Sharpe Palladium Exposure Volatility 12/06/2012 5 year 3 year 1 year YTD Ratio BBG code: Exposure* PALL US EQUITY ETFS Physical Palladium Shares C 0.00% 0.00% -20.57% -6.26% 41.6% -0.48 IPDM LN EQUITY iShares Physical Palladium C 0.00% 0.00% -22.53% -6.98% 41.6% -0.50 *Exposure: C = Commodities. Securities in grey belong to ETF Securities. Data Source: Bloomberg, ETFS
  • 2. Dated: Performance in USD Sharpe Global Agriculture Exposure Volatility 31/05/2012 5 year 3 year 1 year YTD Ratio BBG code BBG Index code Passive: Exposure* AGRI LN EQUITY AGRIT INDEX S-NET ITG Global Agribusiness Index E 32.1% 23.1% -15.6% 1.0% 26.6% -0.59 FAGR LN EQUITY DJUBAG3T INDEX Dow Jones-UBS Forward Agriculture Index C 39.7% 19.8% -22.1% -8.8% 18.9% -1.18 AIGA LN EQUITY DJUBAGTR INDEX Dow Jones-UBS Agriculture Index C 18.2% 11.3% -22.2% -7.3% 19.9% -1.12 DBAGIX INDEX DBIQ Diversified Agriculture Index C 1.2% -5.7% -19.6% -9.1% 33.8% -0.58 SPAEREDT INDEX S&P Global Agribusiness Index E 24.9% -15.4% -1.2% 24.4% -0.64 DXAG INDEX DAX Global Agribusiness Index E 29.4% 32.9% -12.8% -0.4% 24.8% -0.52 RICIAGTR INDEX Rogers International Index - Agriculture C -4.0% 5.0% -24.0% -8.2% 16.6% -1.45 RIEHA INDEX RICI Enhanced Agriculture Index C 30.8% 20.3% -18.6% -7.4% 14.8% -1.26 Active: WLDA2US LX EQUITY Blackrock Global Agriculture Fund E+C -16.5% -1.3% 25.1% -0.66 SARAGAA LN EQUITY Sarasin Funds ICVC - AgriSar Fund E 15.0% -15.7% 1.3% 21.3% -0.74 CAMGLAC LX EQUITY Amundi Funds - Global Agriculture E 24.4% -19.2% -2.6% 23.2% -0.83 SASAGAA LX EQUITY Schroders Alternative Solutions - Agriculture C -1.0% -0.4% -23.9% -7.5% 13.6% -1.77 JBAGRDB LX EQUITY Julius Baer Multistock - Agriculture Fund E+C 0.0% 16.9% -23.5% -3.0% 22.0% -1.07 BAGRAGA LN EQUITY Baring Global Agriculture Fund E 0.0% 17.2% -16.5% 1.6% 26.4% -0.63 CFEAAGA LN EQUITY CF Eclectica Agriculture Fund E+C 0.0% 12.6% -16.9% -0.5% 23.0% -0.74 CSQAADP ID EQUITY Castlestone Management Agriculture Fund C 0.0% -7.9% -16.4% 12.8% -1.30 ALAGDAT LX Equity Allianz RCM Global Agriculture Trends E 0.0% 37.3% -13.6% 1.8% 28.5% -0.48 DWIGAA2 LX EQUITY DWS Invest Global Agribusiness E -7.6% 30.2% -18.2% 1.7% 24.9% -0.74 *C = Commodities, E = Equities. Securities in grey belong to ETF Securities. Data Source: Bloomberg, ETFS
  • 3. • DJ UBS offers 2 different types of indexes on Commodities: DJ UBS Commodity 3 months Forward Indexes provides exposure to futures returns 3 months further out on the futures curve than the Classic DJ UBS Commodity Indexes underlying contracts for front month • Thus, the Classic is exposed to contracts approx 1-3 months from expiry, and the Forward Index is exposed to contracts approx 4-6 months from expiry • Both indexes roll passively on fixed, regular and transparent schedule • When the curve is in contango, the roll cost tends to be reduced when choosing an exposition to forward contracts instead of front month contracts
  • 4. Agricultural Index Comparison Source: DB indexes, Dow Jones Indexes, ETFS • Our Index is much weighted on Soybean, thus benefiting from the better than its peers performance and the momentum of the underlying • Our index has no exposure to Cocoa; this is a very volatile commodity that has deeply underperformed last year
  • 5. Dated: Performance in USD OIL Exposure Arab Spring Iranian Oil Sharpe 31/05/2012 5 year 3 year 1 year YTD 2011** Sanctions+ Volatility Ratio BBG code Passive OILB LN EQUITY OILB LN EQUITY ETFS Brent 1 month 7.10% 41.00% -6.10% -3.40% 35.00% -2.20% 23.70% -0.26 FCRU LN Equity DJUBCL3T INDEX Dow Jones-UBS Forward WTI Crude Oil Subindex 4.50% 7.60% -16.30% -12.80% 23.30% -5.30% 28.70% -0.57 DBOLIX INDEX Powershares DB Oil Fund -0.40% 2.10% -17.00% -12.90% 24.00% -5.20% 27.00% -0.63 USO US EQUITY US OIL Fund -33.40% -10.40% -17.90% -14.40% 17.60% -7.40% 28.80% -0.63 SPGSCLTR INDEX IPATH S&P GSCI CRUDE OIL ETN -36.50% -8.40% -17.20% -14.10% 18.50% -8.00% 30.10% -0.57 ENERGY Basket Exposure AIGE LN Equity DJUBENTR INDEX Dow Jones-UBS Energy Subindex -65.30% -36.80% -31.80% -16.60% 15.10% -20.40% 22.50% -1.42 ENEF LN Equity DJUBEN3T INDEX Dow Jones-UBS Forward Energy Subindex -46.40% -25.10% -27.10% -13.00% 19.30% -15.20% 21.00% -1.3 AIGO LN Equity DJUBPETR INDEX Dow Jones-UBS Petroleum Subindex -22.20% 6.90% -12.10% -8.30% 21.30% -4.70% 26.40% -0.46 FPET LN Equity DJUBPE3T INDEX Dow Jones-UBS Forward Petroleum Subindex 11.50% 17.90% -12.20% -8.00% 26.30% -3.10% 25.60% -0.48 Active MERENER LX EQUITY Blackrock Global Funds - World Energy Fund -20.50% 1.30% -27.60% -11.30% 13.90% -16.40% 29.60% -0.94 SCHGLAA LX EQUITY Schroder International Selection - Global Energy Fund -21.00% -1.80% -34.70% -12.80% 15.40% -14.60% 29.70% -1.17 GUIGLEI LX EQUITY Investec Global Energy Fund -17.50% -1.90% -28.20% -8.50% 18.50% -14.50% 33.80% -0.84 ARTGLER LN EQUITY Artemis Global Energy Fund 4.70% -2.60% 23.90% -0.01 BBOOSNRG INDEX Bloomberg's Active Energy Index for Funds -85.40% -76.60% -60.40% -26.60% -4.90% -38.40% 31.20% -1.94 Securities in grey belong to ETF Securities. Data Source: Bloomberg, ETFS
  • 6. ETFS Energy DJ-UBSCI (Dow Jones-UBS Energy Subindex) ETFS Petroleum DJ-UBSCI (Dow Jones-UBS Petroleum Subindex)
  • 7. • DJ UBS offers 2 different types of indexes on Commodities: DJ UBS Commodity 3 months Forward Indexes provides exposure to futures returns 3 months further out on the futures curve than the Classic DJ UBS Commodity Indexes underlying contracts for front month • Thus, the Classic is exposed to contracts approx 1-3 months from expiry, and the Forward Index is exposed to contracts approx 4-6 months from expiry • Both indexes roll passively on fixed, regular and transparent schedule • When the curve is in contango, the roll cost tends to be reduced when choosing an exposition to forward contracts instead of front month contracts
  • 8. Dated: Performance in USD Trailing 12 Month Global Income exposure 01/08/2011- Sharpe Dividend 31/05/2012 5 year 3 year 1 year YTD 30/09/2011 Volatility Ratio Yield* BBG code Passive GDIV LN Equity DJGSDT INDEX Dow Jones Global Select Dividend Index -16.30% 45.60% -12.70% -2.90% -10.40% 20.90% -0.62 5.58 SDGP INDEX STOXX Global Select Dividend 100 Index -43.20% 26.90% -14.70% -4.80% -10.30% 17.30% -0.86 5.99 MERGDATT INDEX Mergent International Dividend Achievers Index -17.90% 34.90% -11.60% -3.50% -12.70% 22.30% -0.53 3.98 SPGTGDOT INDEX S&P Global Dividend Opportunities Index 28.40% -18.50% -7.50% -13.20% 21.70% -0.86 7.33 WTGDHYTR INDEX Wisdom Tree Global Equity Income Index 25.80% -14.30% -3.70% -12.40% 21.20% -0.68 5.99 Active VERGLIS ID Equity Veritas Global Equity Income Fund 6.10% 38.50% -6.10% 0.70% -13.30% 19.60% -0.32 4.8 MLGEEAU LX Equity Blackrock Global Enhanced Equity Yield Fund -20.10% 23.50% -10.60% -2.50% -14.30% 19.90% -0.54 9.73 SGBQTIA LN Equity Schroder Global Equity Income Fund 26.70% -10.30% 0.20% -13.10% 21.10% -0.49 4.77 MGGDAIG LN Equity M&G Global Dividend Fund 51.20% -8.10% 1.70% -13.20% 21.30% -0.39 3.97 NEWGIII LN Equity Newton Global Higher Income Fund 41.10% -4.30% 1.30% -9.60% 16.50% -0.27 5.51 LAZGEII LN Equity Lazard Global Equity Income Fund 31.70% -10.30% 0.30% -13.50% 21.40% -0.49 5.74 BSET LN EQUITY British Assets Trust PLC -25.80% 26.80% -20.40% -2.90% -14.70% 27.40% -0.75 5.91 HINT LN Equity Henderson International Income Trust 5.00% -11.90% 16.30% -0.01 1.73 MYI LN Equity Murray International Trust PLC 28.90% 51.80% -6.60% 0.60% -14.00% 22.70% -0.3 4.51 STS LN Equity Securities Trust of Scotland -16.10% 53.90% -1.30% 4.10% -9.10% 24.30% -0.06 4.54 Securities in grey belong to ETF Securities. Data Source: Bloomberg, ETFS * Dividend Yield = Gross at 31/01/2012
  • 9. ETFX-BofAML IVSTOXX ETF:VSTX LN <Equity> (Eurostoxx 50 Volatility ETF) • Volatility serves as a good hedging tool when turmoil arises in the markets • Last Euro zone’s peripheral debt worries have put the markets on the edge seeing volatility increasing heavily in that period • Gaining exposure to our Volatility ETF since March 2011 has returned a 29.13% profitability, while hedging the portfolio during severe scenarios