analog-vs-digital-communication (concept of analog and digital).pptx
Chemical Engineering Technology Profile Column
1. Propylene Production via
Propane Dehydrogenation
Because natural gas supplies are significantly increasing due to
the rising exploitation of shale gas, mainly in the U.S., propane
prices are decreasing. Coupled with low propane prices, ethyl-
ene producers are shifting to lighter feedstocks (more ethane, less naph-
tha), which is decreasing yields of propylene in cracking operations.
The increasing demand for propylene and the availability of low-cost
feedstock make propane dehydrogenation an economically attractive
chemical route.
Propane, the main feedstock for propane dehydrogenation (PDH)
processes, can be obtained as a byproduct of petroleum refinery opera-
tions and can be recovered from propane-rich liquefied petroleum gas
(LPG) streams from natural-gas processing plants.
The PDH process
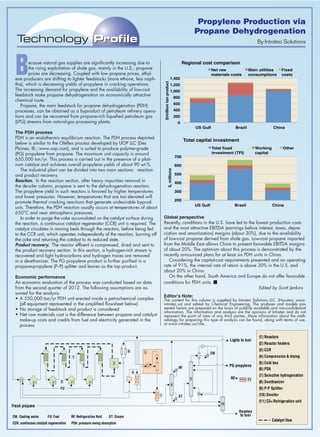
PDH is an endothermic equilibrium reaction. The PDH process depicted
below is similar to the Oleflex process developed by UOP LLC (Des
Plaines, Ill.; www.uop.com), and is suited to produce polymer-grade
(PG) propylene from propane. The maximum unit capacity is around
650,000 ton/yr. This process is carried out in the presence of a plati-
num catalyst and achieves overall propylene yields of about 90 wt.%.
The industrial plant can be divided into two main sections: reaction
and product recovery.
Reaction. In the reaction section, after heavy impurities removal in
the de-oiler column, propane is sent to the dehydrogenation reactors.
The propylene yield in such reactors is favored by higher temperatures
and lower pressures. However, temperatures that are too elevated will
promote thermal cracking reactions that generate undesirable byprod-
ucts. Therefore, the PDH reaction usually occurs at temperatures of about
650°C and near atmospheric pressures.
In order to purge the coke accumulated on the catalyst surface during
the reaction, a continuous catalyst regenerator (CCR) unit is required. The
catalyst circulates in moving beds through the reactors, before being fed
to the CCR unit, which operates independently of the reaction, burning off
the coke and returning the catalyst to its reduced state.
Product recovery. The reactor effluent is compressed, dried and sent to
the product recovery section. In this section, a hydrogen-rich stream is
recovered and light hydrocarbons and hydrogen traces are removed
in a de-ethanizer. The PG propylene product is further purified in a
propane-propylene (P–P) splitter and leaves as the top product.
Economic performance
An economic evaluation of the process was conducted based on data
from the second quarter of 2012. The following assumptions are as-
sumed for the analysis:
• A 550,000 ton/yr PDH unit erected inside a petrochemical complex
(all equipment represented in the simplified flowsheet below)
• No storage of feedstock and product is considered
• Net raw materials cost is the difference between propane and catalyst
make-up costs and credits from fuel and electricity generated in the
process
Global perspective
Recently, conditions in the U.S. have led to the lowest production costs
and the most attractive EBITDA (earnings before interest, taxes, depre-
ciation and amortization) margins (about 30%), due to the availability
of low-cost propane derived from shale gas. Low-cost propane imported
from the Middle East allows China to present favorable EBITDA margins
of about 20%. The optimism about this process is demonstrated by the
recently announced plans for at least six PDH units in China.
Considering the capital-cost requirements presented and an operating
rate of 91%, the internal rate of return is above 30% in the U.S. and
about 20% in China.
On the other hand, South America and Europe do not offer favorable
conditions for PDH units. ■
Edited by Scott Jenkins
Editor’s Note:
The content for this column is supplied by Intratec Solutions LLC. (Houston; www.
intratec.us) and edited by Chemical Engineering. The analyses and models pre-
sented herein are prepared on the basis of publicly available and non-confidential
information. The information and analysis are the opinions of Intratec and do not
represent the point of view of any third parties. More information about the meth-
odology for preparing this type of analysis can be found, along with terms of use,
at www.intratec.us/che.
0
200
400
600
800
1,000
1,200
1,400
US Gulf Brazil China
Regional cost comparison
Net raw
materials costs
Main utilities
consumptions
Fixed
costs
200
300
400
500
600
700
US Gulf Brazil China
$,millions
$/milliontonproduct
Total capital investment
Total fixed
investment (TFI)
Working
capital
Other
Catalyst flow
(1) Reactors
(2) Reactor heaters
(3) CCR
(4) Compression & drying
(5) Cold box
(6) PSA
(7) Selective hydrogenation
(8) Deethanizer
(9) P-P Splitter
(10) Deoiler
(11) C3= Refrigeration unit
Fresh propane
PG propylene
Heavies
to fuel
Lights to fuel
1
3
4
5
7
8
9
6
ST
RF
RF: Refrigeration fluid
11
2
10
FU
CW
CCR: continuous catalyst regeneration PSA: pressure-swing absorption
: Cooling water ST: SteamFU: Fuel
CW
RF
By Intratec Solutions