Forensic Biology & Its biological significance.pdf
Soil and Water Engineering 06
1. 1
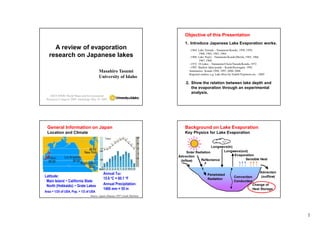
A review of evaporation
research on Japanese lakes
Masahiro Tasumi
University of Idaho
ASCE-EWRI World Water and Environmental
Resources Congress 2005, Anchorage May 19, 2005
Objective of this Presentation
~1964 Lake Towada – Yamamoto/Kondo, 1958, 1959,
1960, 1962, 1963, 1964
~1968 Lake Nojiri – Yamamoto/Kondo/Morita, 1965, 1966,
1967, 1968
~1972 18 Lakes – Yamamoto/Chein/Yasuda/Kondo, 1972
~1992 Shallow lakes/ponds – Kondo/Kuwagata, 1992
Summaries: Kondo 1994, 1997, 2000, 2004
Regional studies: e.g. Lake Biwa by Endoh/Tsujimoto etc. ~2005
1. Introduce Japanese Lake Evaporation works.
2. Show the relation between lake depth and
the evaporation through an experimental
analysis.
General Information on Japan
Location and Climate
Source: Japan Almanac 1997 (Asahi Shinbun)
Annual Tair:
15.6 o
C = 60.1 o
F
Annual Precipitation:
1400 mm = 55 in
Latitude:
Main Island ~ California State
North (Hokkaido) ~ Grate Lakes
Area = 1/25 of USA, Pop. = 1/2 of USA
Background on Lake Evaporation
Key Physics for Lake Evaporation
Longwave(in)
Longwave(out)
Evaporation
Sensible Heat
Convection
Conduction
Change of
Heat Storage
Advection
(outflow)
Advection
(inflow)
Solar Radiation
Reflectance
Penetrated
Radiation
2. 2
0
10
20
30
40
50
60
70
80
5 10 15 20 25 30
Water Temperature (C)
Depth(m)
2/17/04
5/15/04
8/17/04
11/14/04
Background on Lake Evaporation
Vertical Temperature Profile of Lake Biwa (Endoh, 2005)
Spring ~ Summer: Lake stores energy as heat
Fall ~ Winter: Lake discharges stored energy
Lake Avg. Depth 43m
Development of estimation method
Lake Towada/ Lake Nojiri (Yamamoto&Kondo 1956~68)
Pan
Tower for vertical
profiles of Tair, e, u
Wind-fieldPan-on-boat
(Photo: for Lake Nojiri Study)
Prevent Birds
asatTsEair
asHairp
qquCLLE
)TT(uCcH
CH, CE: Bulk Transfer Coefficients
Aerodynamic Equation
0
50
100
150
200
12 1 2 3 4 5 6 7 8 9 10 11
Month (Dec.1962-Nov.1963)
Evaporation(mm/mo.)
Tower (lake center) Tower (near shore)
Pan (ground)
Lake Towada (Yamamoto&Kondo 1958~64)
Lake Evaporation
Findings (deep lake):
1. Evaporation is high
in winter and low in
summer!
2. Evaporation pan
installed at land
nearby lake does not
tell anything!
Mean Lake Depth = 80 m
A
A
P
A: Aerodynamic Method
P: Pan Evaporation
0
20
40
60
80
100
120
140
1 2 3 4 5 6 7 8 9 10 11 12
Month
MonthlyEvaporation(mm/mo)
Lake Towada, d = 80 m Lake Biwa, d = 40 m
Lake Nojiri, d = 21 m Lake Kasumigaura, d = 3 m
*All Data by Aerodynamic Method
d = Mean Lake Depth
(Yamamoto et al., 1972)
Lake Evaporation in Japan (Kondo 1994)
Monthly Evaporation pattern is largely affected by
the mean lake depth.
3. 3
North Basin: Avg. Depth 43m
South Basin: Avg. Depth 4m
SAME weather condition.
Different evaporation
pattern.
Lake Biwa (Tsujimoto 1999)
North Basin
South Basin
Lake Biwa
All Data by Aerodynamic Method
Annual Evaporation (Kondo 1997)
Monthly E: f(lake depth)
Annual E: f(annual mean Tair)
Because:
Cold Tair = More H : Hot Tair = More E
Slope/Intercept in E vs. Tair line is not universal but is
a function of Rn, u, etc. (i.e. changes by region)
E (mm/yr) = 45 Tair + 225
(Bowen Ratio
= H/LE)
Experimental analysis
for impact of Lake
Depth
0
20
40
60
80
100
120
140
1 2 3 4 5 6 7 8 9 10 11 12
Month
MonthlyEvaporation(mm/mo)
Lake Towada, d = 80 m Lake Biwa, d = 40 m
Lake Nojiri, d = 21 m Lake Kasumigaura, d = 3 m
This simple experiment is for better understanding
of the “Evaporation-Depth” relation.
E(month)/E(year) = f(Depth)Assumption
Datum= 1/12 = 0.0833
for 0.1
)year(E
)month(E12
1Month
4. 4
12
1
Amplitude2
12
XshiftMonth
SinE(month)/E(year) =
Month = Month (i.e. values 1~12) for E(month)/E(year)
ratio calculation
Xshift = 0.001047D2 – 0.1542D + 8.903
Amplitude = 0.000009974D2 – 0.0006242D + 0.06515
where D is lake mean depth (m), Dmax = 80 m
Limitations:
(A) Basically for Japanese lakes, potentially for similar climate
mid-latitude lakes in northern hemisphere.
(B) “Month” +6 (i.e. add extra half year) if southern hemisphere.
(C)Not applicable to low and high latitude regions.
Equation Development Datum of the sine curve
-0.05
0.00
0.05
0.10
0.15
0.20
1 2 3 4 5 6 7 8 9 10 11 12
Month
E(month)/E(year)
Depth = 3 m: Lake Kasumigaura
Comparison (1)
-0.05
0.00
0.05
0.10
0.15
0.20
1 2 3 4 5 6 7 8 9 10 11 12
Month
E(month)/E(year)
Depth = 21 m: Lake Nojiri
Comparison (2)
-0.05
0.00
0.05
0.10
0.15
0.20
1 2 3 4 5 6 7 8 9 10 11 12
MonthE(month)/E(year)
Depth = 40 m: Lake Biwa
Comparison (3)
5. 5
-0.05
0.00
0.05
0.10
0.15
0.20
1 2 3 4 5 6 7 8 9 10 11 12
Month
E(month)/E(year)
Depth = 80 m: Lake Towada
Comparison (4)
-0.05
0.00
0.05
0.10
0.15
0.20
1 2 3 4 5 6 7 8 9 10 11 12
Month
E(month)/E(year)
ETr vs Estimated Lake E for Depth = 0 m
Comparison (5) ETr TwinFalls, Idaho 2000
-0.05
0.00
0.05
0.10
0.15
0.20
0.25
1 2 3 4 5 6 7 8 9 10 11 12
E(month)/E(year)
Estimate Evaporation from Lake Superior
(1) E(year) by Croley’s annual E-Tair relationship:
E(year) = 50 * 2.7oC + 430 = 565 (mm)
(2) Calculate E(month)/E(year) ratio using the developed
equation.
E (mm/yr) = 50 Tair + 430
Annual Tair vs. Annual E
Lake Superior Simulation (Croley et al.)
Given: Annual Tair = 2.7oC, D = 149 m
(by Croley et al., 1996, Case-BASE)
E(month)/E(year) for D = 149m
(i.e. use Dmax = 80m)
-20
0
20
40
60
80
100
120
1 2 3 4 5 6 7 8 9 10 11 12
Month
LatentHeat(W/m2)
Estimate Evaporation from Lake Superior
(Result)
Depth = 149 m: Lake Superior
(Croley et al., 1996, BASE case)
Good Agreement!
6. 6
CONCLUSION
1. In Japan, systematic lake evaporation studies have
been conducted since 1956 (Tohoku University).
2. Monthly lake evaporation strongly relates to lake
depth. The evaporation pattern is approximated by
sine curves for general Japanese lakes.
3. Annual lake evaporation strongly relates to the mean
Tair. On an annual basis, Bowen ratio is a strong
function of Tair when climate conditions are similar.
4. Refer to Allen and Tasumi, 2005 (this session), for
information on lake evaporation measurement and
aerodynamic equations for estimating lake
evaporation.
Questions?
Thanks to: Dr. J.Kondo, Dr. R.G.Allen, Mr. C. Robison