Ms excel anlysis tools instructions for project -simple format
•Download as DOC, PDF•
0 likes•167 views

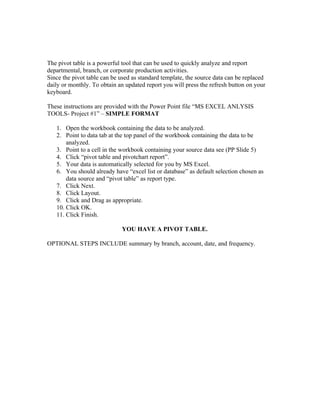
The document provides instructions for creating a pivot table in Microsoft Excel to analyze production data from departments, branches, or corporations. Pivot tables allow the source data to be replaced daily or monthly and refreshed to generate updated reports by pressing the refresh button. The 11 steps walk through selecting the data, choosing pivot table as the report type, laying out and dragging fields, and finishing to complete the pivot table. Optional steps further analyze the data by branch, account, date, and frequency.

Recommended
More Related Content
What's hot
What's hot (20)
Similar to Ms excel anlysis tools instructions for project -simple format
Similar to Ms excel anlysis tools instructions for project -simple format (20)
Recently uploaded
Recently uploaded (20)
Ms excel anlysis tools instructions for project -simple format
- 1. The pivot table is a powerful tool that can be used to quickly analyze and report departmental, branch, or corporate production activities. Since the pivot table can be used as standard template, the source data can be replaced daily or monthly. To obtain an updated report you will press the refresh button on your keyboard. These instructions are provided with the Power Point file “MS EXCEL ANLYSIS TOOLS- Project #1” – SIMPLE FORMAT 1. Open the workbook containing the data to be analyzed. 2. Point to data tab at the top panel of the workbook containing the data to be analyzed. 3. Point to a cell in the workbook containing your source data see (PP Slide 5) 4. Click “pivot table and pivotchart report”. 5. Your data is automatically selected for you by MS Excel. 6. You should already have “excel list or database” as default selection chosen as data source and “pivot table” as report type. 7. Click Next. 8. Click Layout. 9. Click and Drag as appropriate. 10. Click OK. 11. Click Finish. YOU HAVE A PIVOT TABLE. OPTIONAL STEPS INCLUDE summary by branch, account, date, and frequency.