Download to read offline
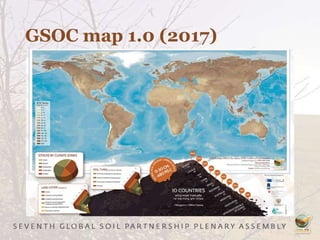
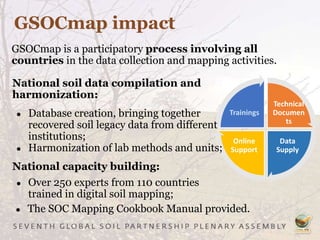

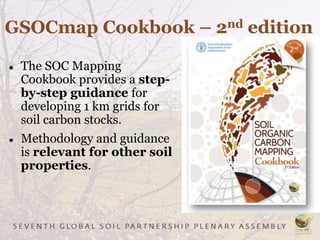
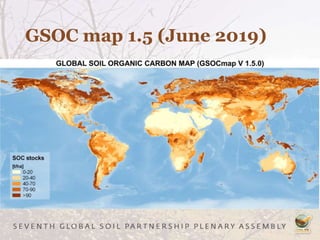
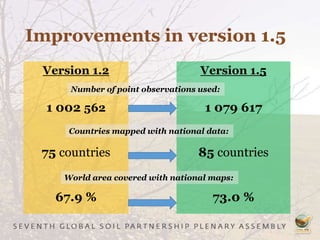
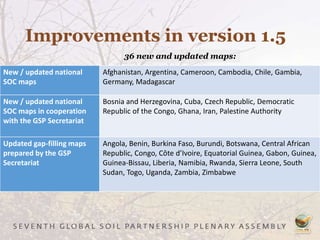
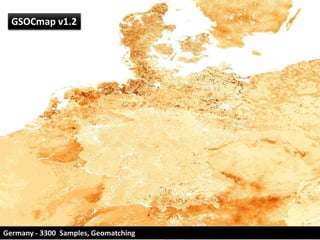
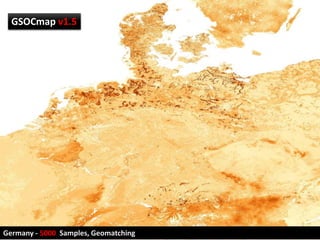
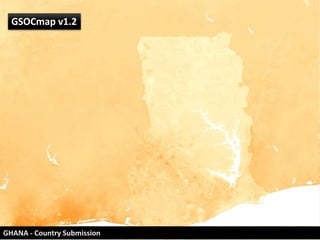
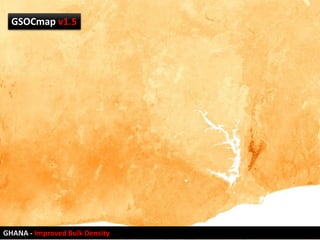
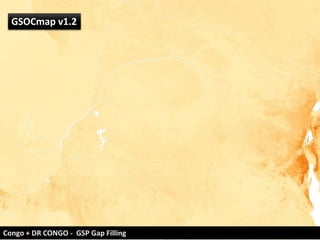
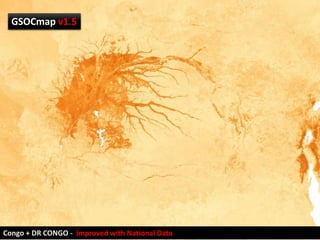
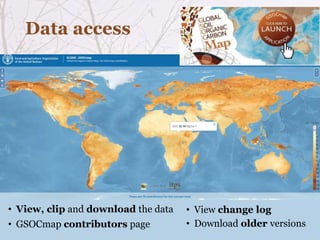
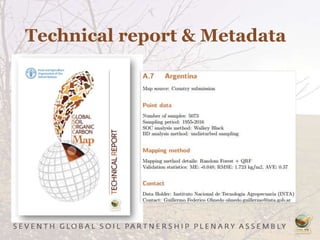
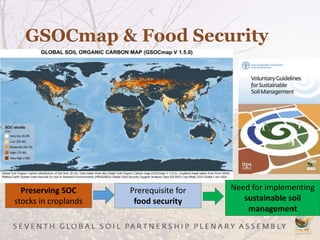

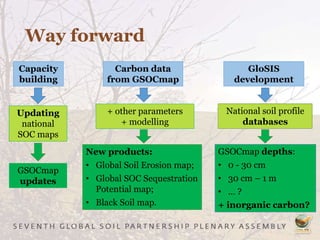


The Global Soil Organic Carbon Map (GSOCMap) was developed through collaboration among member countries as part of the Global Soil Information System, with its launch on December 5, 2017. The second edition of the GSOCMap Cookbook provides methodologies for soil carbon stock development, and updates were made in version 1.5 with more countries and data points. The initiative aims to aid countries in monitoring and reporting soil organic carbon stocks, thereby supporting Sustainable Development Goal 15.3.1.


