Epic research's weekly derivative market report 26th september 2016
•
0 likes•25 views

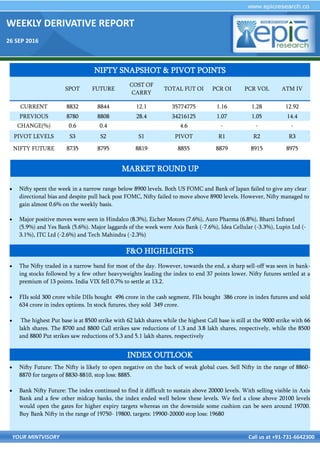
Nifty spent the week in a narrow range below 8900 levels. Both US FOMC and Bank of Japan failed to give any clear directional bias and despite pull back post FOMC, Nifty failed to move above 8900 levels. However, Nifty managed to gain almost 0.6% on the weekly basis.
![WEEKLY DERIVATIVE REPORT
26 SEP 2016
YOUR MINTVISORY Call us at +91-731-6642300
WEEKLY STRATEGY
i) TVS MOTORS FUTURE ii HEXAWARE FUTURE
Buy future around 345-347 Sell future around 199-200
View : Bullish View : Bearish
Strategy : Buy Future Strategy : Sell Future
Target1: 352 Target 2 : 355 Target1: 195 Target 2 : 192
Stop loss : 341 Stop loss : 202
Market Lot : 2000 ,CMP : 349 Market Lot : 200 ,CMP : 195.45
STOCK ANALYSIS
OPEN INTEREST ACTIVITY
LONG BUILD UP SHORT BUILD UP
SYMBOL OI (LOTS)
%
CHNG
PRICE %CHNG SYMBOL OI (LOTS)
%
CHNG
PRICE %CHNG
SRF 853.00 31.6 1785.00 9.40 BATAINDIA 3358.00 5.6 505.70 [1.6]
RELCAPITAL 7485.00 10.7 582.50 1.10 CESC 1244.00 3.5 645.15 [0.2]
BEL 4420.00 8.5 1248.50 0.10 NHPC 814.00 2.7 26.10 [2.8]
GODREJIND 860.00 0.8 434.80 1.30 AXISBANK 27907.00 1.3 558.50 [6.0]
IDFC 4646.00 0.7 61.25 0.20 AMBUJACEM 4466.00 1.1 258.90 [2.9]
OI addition : We saw long build-up in srf, rel capital, bel, godrej ind, idfc while short build-up was seen in bata in-
dia, cesc, nhpc, axisbank, ambujacem.
OI Shedding : We saw short covering in divis lab, glenmark, century tex, jubilant food, igl, whereas long closure
was seen in pfc, jswsteel, mind tree, pcjeweller, m&m.](data:image/gif;base64,R0lGODlhAQABAIAAAAAAAP///yH5BAEAAAAALAAAAAABAAEAAAIBRAA7)
Recommended
Recommended
More Related Content
What's hot
What's hot (20)
Similar to Epic research's weekly derivative market report 26th september 2016
Similar to Epic research's weekly derivative market report 26th september 2016 (17)
Recently uploaded
Recently uploaded (20)
Epic research's weekly derivative market report 26th september 2016
- 1. WEEKLY DERIVATIVE REPORT 26 SEP 2016 YOUR MINTVISORY Call us at +91-731-6642300 Nifty spent the week in a narrow range below 8900 levels. Both US FOMC and Bank of Japan failed to give any clear directional bias and despite pull back post FOMC, Nifty failed to move above 8900 levels. However, Nifty managed to gain almost 0.6% on the weekly basis. Major positive moves were seen in Hindalco (8.3%), Eicher Motors (7.6%), Auro Pharma (6.8%), Bharti Infratel (5.9%) and Yes Bank (5.6%). Major laggards of the week were Axis Bank (-7.6%), Idea Cellular (-3.3%), Lupin Ltd (- 3.1%), ITC Ltd (-2.6%) and Tech Mahindra (-2.3%) The Nifty traded in a narrow band for most of the day. However, towards the end, a sharp sell-off was seen in bank- ing stocks followed by a few other heavyweights leading the index to end 37 points lower. Nifty futures settled at a premium of 13 points. India VIX fell 0.7% to settle at 13.2. FIIs sold 300 crore while DIIs bought 496 crore in the cash segment. FIIs bought 386 crore in index futures and sold 634 crore in index options. In stock futures, they sold 349 crore. The highest Put base is at 8500 strike with 62 lakh shares while the highest Call base is still at the 9000 strike with 66 lakh shares. The 8700 and 8800 Call strikes saw reductions of 1.3 and 3.8 lakh shares, respectively, while the 8500 and 8800 Put strikes saw reductions of 5.3 and 5.1 lakh shares, respectively Nifty Future: The Nifty is likely to open negative on the back of weak global cues. Sell Nifty in the range of 8860- 8870 for targets of 8830-8810, stop loss: 8885. Bank Nifty Future: The index continued to find it difficult to sustain above 20000 levels. With selling visible in Axis Bank and a few other midcap banks, the index ended well below these levels. We feel a close above 20100 levels would open the gates for higher expiry targets whereas on the downside some cushion can be seen around 19700. Buy Bank Nifty in the range of 19750- 19800, targets: 19900-20000 stop loss: 19680 NIFTY SNAPSHOT & PIVOT POINTS SPOT FUTURE COST OF CARRY TOTAL FUT OI PCR OI PCR VOL ATM IV CURRENT 8832 8844 12.1 35774775 1.16 1.28 12.92 PREVIOUS 8780 8808 28.4 34216125 1.07 1.05 14.4 CHANGE(%) 0.6 0.4 4.6 - - - PIVOT LEVELS S3 S2 S1 PIVOT R1 R2 R3 NIFTY FUTURE 8735 8795 8819 8855 8879 8915 8975 F&O HIGHLIGHTS INDEX OUTLOOK MARKET ROUND UP
- 2. WEEKLY DERIVATIVE REPORT 26 SEP 2016 YOUR MINTVISORY Call us at +91-731-6642300 WEEKLY STRATEGY i) TVS MOTORS FUTURE ii HEXAWARE FUTURE Buy future around 345-347 Sell future around 199-200 View : Bullish View : Bearish Strategy : Buy Future Strategy : Sell Future Target1: 352 Target 2 : 355 Target1: 195 Target 2 : 192 Stop loss : 341 Stop loss : 202 Market Lot : 2000 ,CMP : 349 Market Lot : 200 ,CMP : 195.45 STOCK ANALYSIS OPEN INTEREST ACTIVITY LONG BUILD UP SHORT BUILD UP SYMBOL OI (LOTS) % CHNG PRICE %CHNG SYMBOL OI (LOTS) % CHNG PRICE %CHNG SRF 853.00 31.6 1785.00 9.40 BATAINDIA 3358.00 5.6 505.70 [1.6] RELCAPITAL 7485.00 10.7 582.50 1.10 CESC 1244.00 3.5 645.15 [0.2] BEL 4420.00 8.5 1248.50 0.10 NHPC 814.00 2.7 26.10 [2.8] GODREJIND 860.00 0.8 434.80 1.30 AXISBANK 27907.00 1.3 558.50 [6.0] IDFC 4646.00 0.7 61.25 0.20 AMBUJACEM 4466.00 1.1 258.90 [2.9] OI addition : We saw long build-up in srf, rel capital, bel, godrej ind, idfc while short build-up was seen in bata in- dia, cesc, nhpc, axisbank, ambujacem. OI Shedding : We saw short covering in divis lab, glenmark, century tex, jubilant food, igl, whereas long closure was seen in pfc, jswsteel, mind tree, pcjeweller, m&m.
- 3. WEEKLY DERIVATIVE REPORT 26 SEP 2016 YOUR MINTVISORY Call us at +91-731-6642300 Instrument Type Symbol Expiry Date Option Type Strike Price LTP Traded Volume (Contracts) Traded Value (Lakhs) OPTSTK RELIANCE 29SEP2016 CE 1,100 12.25 10,509 58,497.30 OPTSTK AXISBANK 29SEP2016 CE 580 3.70 7,288 51,264.96 OPTSTK AXISBANK 29SEP2016 CE 600 1.25 6,803 49,162.83 OPTSTK AXISBANK 29SEP2016 CE 590 2.00 5,985 42,645.28 OPTSTK DLF 29SEP2016 CE 160 1.40 5,945 48,160.45 MOST ACTIVE CALLS MOST ACTIVE PUTS Instrument Type Symbol Expiry Date Option Type Strike Price LTP Traded Volume (Contracts) Traded Value (Lakhs) OPTSTK AXISBANK 29SEP2016 PE 560 12.15 4,473 30,468.64 OPTSTK AXISBANK 29SEP2016 PE 570 18.00 3,405 23,712.28 OPTSTK AXISBANK 29SEP2016 PE 550 7.90 3,379 22,510.63 OPTSTK RELIANCE 29SEP2016 PE 1,100 10.60 3,073 17,066.67 OPTSTK RELIANCE 29SEP2016 PE 1,080 4.35 3,022 16,387.40 FII ACTIVITY (IN RS. CRORE) BUY SELL OPEN INTEREST AT THE END OF THE DATE DERIVATIVE PRODUCT NO.OF CON- TRACTS AMOUNT IN CRORES NO.OF COTRACTS AMOUNT IN CRORES NO. OF CONTRACTS AMOUNT IN CRORES INDEX FUTURES 30560 2120.35 25315 1734.69 479775 32490.21 INDEX OPTIONS 482713 34371.40 492401 35005.47 1380752 93829.32 STOCK FUTURES 138721 9521.88 144807 9871.27 939039 62910.17 STOCK OPTIONS 100642 7186.81 103179 7372.05 123415 8680.77
- 4. WEEKLY DERIVATIVE REPORT 26 SEP 2016 YOUR MINTVISORY Call us at +91-731-6642300 DISCLAIMER The information and views in this report, our website & all the service we provide are believed to be reliable, but we do not accept any responsibility (or liability) for errors of fact or opinion. Users have the right to choose the product/s that suits them the most. Sincere efforts have been made to present the right investment perspective. The information contained herein is based on analysis and up on sources that we consider reliable. This material is for personal information and based upon it & takes no responsibility. The information given herein should be treated as only factor, while making investment decision. The report does not provide individually tailor-made investment advice. Epic research recommends that investors independently evaluate particular investments and strategies, and encourages investors to seek the advice of a financial adviser. Epic research shall not be responsible for any transaction conducted based on the information given in this report, which is in violation of rules and regulations of NSE and BSE. The share price projections shown are not necessarily indicative of future price performance. The information herein, together with all estimates and forecasts, can change without notice. Analyst or any person related to epic re- search might be holding positions in the stocks recommended. It is understood that anyone who is browsing through the site has done so at his free will and does not read any views expressed as a recommendation for which either the site or its owners or anyone can be held responsible for Any surfing and reading of the information is the acceptance of this disclaimer. All Rights Reserved. Investment in equity & bullion mar- ket has its own risks. We, however, do not vouch for the accuracy or the completeness thereof. We are not responsible for any loss incurred whatsoever for any financial profits or loss which may arise from the recommendations above epic research does not purport to be an invitation or an offer to buy or sell any financial instrument. Our Clients (Paid or Unpaid), any third party or anyone else have no rights to forward or share our calls or SMS or Report or Any Information Provided by us to/with anyone which is received directly or indirectly by them. If found so then Serious Legal Actions can be taken. PRICE VOLUME OI MARKET RISING UP UP STRONG RISING DOWN DOWN WEAK DECLINING UP UP WEAK DECLINING DOWN DOWN STRONG GENERAL RULES FOR OPEN INTEREST & VOLUME