GPR Modeling and Image Regression
•Download as DOCX, PDF•
0 likes•34 views

system architecture

Recommended
More Related Content
What's hot
What's hot (20)
Similar to GPR Modeling and Image Regression
Similar to GPR Modeling and Image Regression (20)
Recently uploaded
Recently uploaded (20)
GPR Modeling and Image Regression
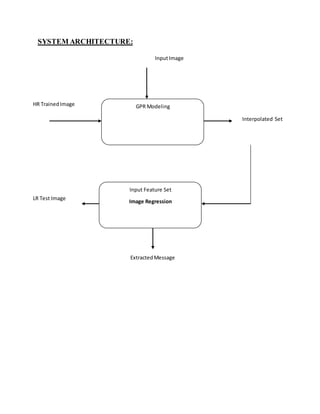
- 1. SYSTEM ARCHITECTURE: GPR Modeling Input Feature Set Image Regression HR TrainedImage InputImage Interpolated Set LR Test Image ExtractedMessage
- 2. BLOCK DIAGRAM: Active Sampling SENDER Login Details Login Query image GPR Model LR test Image HR output HR Image Set Regression within Interpolate d image set
- 3. DATA FLOW DIAGRAM: Pixel Division: If the pixel values are actually vectors rather than scalar values (e.g. for color images) than the individual components (e.g. red, blue and green components)are simply divided separately to producethe output value.
- 4. Pixel Estimation: Pixel Estimation is the process offinding an estimate, or approximation, which is a value that is usable for some purposeeven if input data may be incomplete, uncertain, or unstable. The value is nonetheless usable because it is derived from the best information available. Optimal Value Transfer: Gradient Profile Sharpness Model:Edge sharpness metric is extracted as the eccentricity of gradient profile description models, which considerboth the gradient magnitude and spatial scattering of gradient profile. Interpolated Image: An interpolation technique that reduces the visual distortion caused by the fractional zoom calculation is the bilinear interpolation algorithm, where the fractional part of the pixel address is used to compute a weighted average of pixel brightness values over a small neighborhood of pixels in the sourceimage. Regression:A measure of the relation between the mean value of one variable (e.g. output) and corresponding values of other variables (e.g. time and cost). HR Output: Your art needs to be a 300 dpi (dots per inch) high-resolution jpg, tif, or eps file. An eps format is common for logos. You may submit an eps image. Do not submit a pngimage. A “dot”(also known as a “pixel”) describes the number of discrete points that can be captured by digital cameras.
- 6. SEQUENCE DIAGRAM: Image as input Pixel Estimate GPS Model Interpolated Image Analysis Getfiles() Feature Set() Active Sample() LRTestImage() HR image
- 8. CollaborationDiagram: Image as input Pixel Estimate Data GPS Model Using Subset 1: Getfiles() 2: SetPPMproperties 3: Feature Extract() Interpolated ImageHR Output Image 4: LR Test Image() 5: Regression