Download to read offline
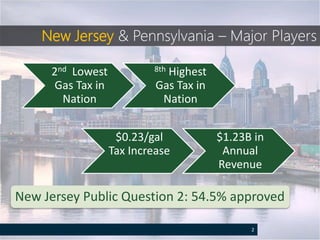
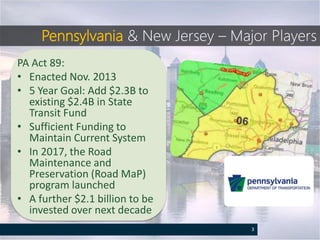
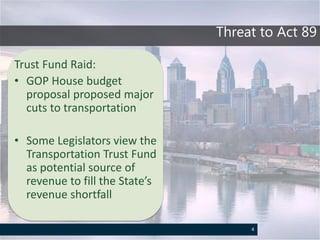
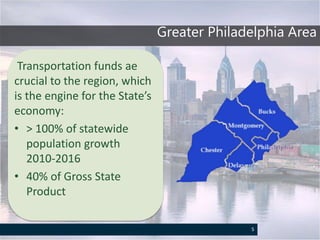
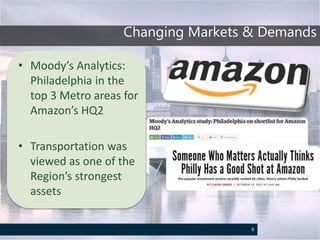
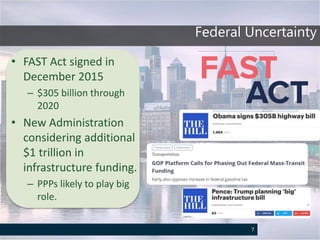
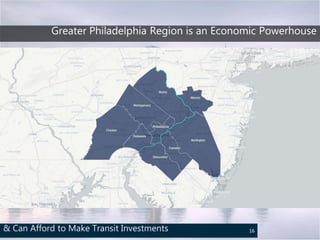
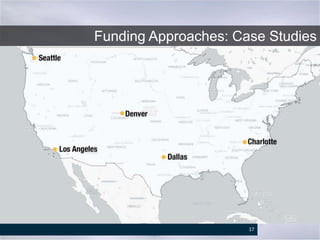
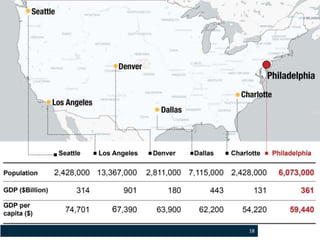
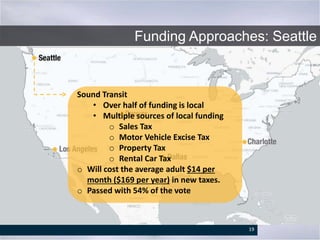

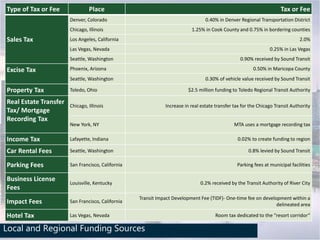
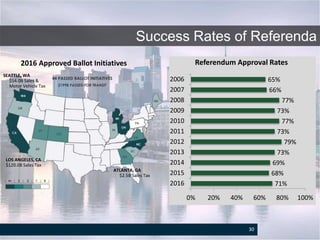
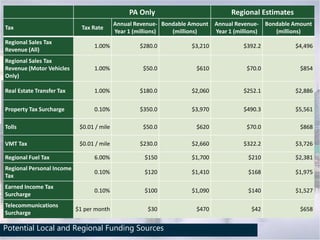
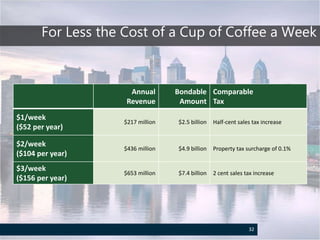

The document discusses transportation funding in New Jersey and Pennsylvania, focusing on changes such as a gas tax increase and initiatives like Pennsylvania's Act 89 aimed at enhancing transit funding. It highlights the critical role of the Greater Philadelphia area's transportation infrastructure in supporting economic growth, along with funding challenges and the impact of changing market conditions, including increases in ridesharing. It also presents various funding approaches from different U.S. cities, emphasizing the necessity for a shared vision for effective investment in infrastructure.


![Transit policy utsc presentation june 24 [compatibility mode]](https://cdn.slidesharecdn.com/ss_thumbnails/transitpolicyutscpresentation-june24compatibilitymode-150908121123-lva1-app6892-thumbnail.jpg?width=640&height=640&fit=bounds)