SlideShare a Scribd company logo
1 of 18
Download to read offline
Exploratory assessment of groundwater vulnerability
to pollution in Abi, southeastern Nigeria, using geophysical
and geological techniques
Anthony E. Akpan & Ebong D. Ebong &
Chimezie N. Emeka
Received: 16 March 2014 /Accepted: 17 February 2015 /Published online: 4 March 2015
# Springer International Publishing Switzerland 2015
Abstract The geophysical-based integrated electrical
conductivity (IEC) and the groundwater hydraulic con-
finement–overlying strata–depth to water table (GOD)
techniques were used to assess vulnerability levels of
aquifers and the extent of aquifer protection in Abi,
Nigeria. The IEC indices was generated from
constrained one dimensional (1D) inversion of vertical
electrical sounding (VES) and two dimensional (2D)
electrical resistivity tomography (ERT) data, acquired
randomly in the area. The GOD indices were sourced
from existing geologic data within the area. Results
showed that IEC values vary from <0.1 S in the weakly
protected areas to >2.0 S in the strongly protected areas.
The GOD indices vary from <0.3 in the lowly vulnera-
ble areas to 0.6 in the highly vulnerable areas. Thus, the
groundwater resources in the area need to be properly
managed for sustainability and such management prac-
tices have been suggested.
Keywords Electrical resistivity. Contamination .
Vulnerability. IEC . GOD . Abi, Nigeria
Introduction
The groundwater resource in the central parts of Cross
River State in Nigeria is the only source of potable water
for domestic and other uses especially in the dry season
when majority of the surface water resources usually dry
up. Generalised studies have continued to capture the
groundwater system within the area as being capable of
producing potable water that can satisfy the water needs
of the people (Edet and Okereke 2002; Akpan et al.
2013). Recently, anthropogenic contaminants are chal-
lenging the potable status of the groundwater resource in
many parts of Abi. Most of these contaminants are of
human origin from faeces while others originate from
micro- and macro-industrial waste and modern practices
of soil productivity enhancement by farmers who dom-
inate the entire population of the area (Akpan et al.
2013). Considering the intricate nature of vertical water
flow and contaminant transport, faeces from unsewered
sanitary facilities, find their way as Faecal Coliform in
groundwater. The process through which this occurs,
involves the colloidal suspension of faecal materials
with water driven by gravity through permeable forma-
tions and preferential structures such as pores of the
lenticular porous sandy or silty materials, fractures and
joints which are predominant pathways of groundwater
transport in the area (Akpan et al. 2013; Ebong et al.
2014).Values of Faecal and Total Coliform of the range
9.2–19.0 and 20–45 per 100 ml of water respectively
has been observed in some communities within the
study area (Mhomho Technologies & Environmental
Services Ltd 2013; Ebong 2014). Other media through
Environ Monit Assess (2015) 187: 156
DOI 10.1007/s10661-015-4380-2
A. E. Akpan (*) :E. D. Ebong
Applied Geophysics Programme, University of Calabar, PMB
1115, Calabar, Nigeria
e-mail: anthonyakpan@yahoo.com
A. E. Akpan
e-mail: anthonyakpan@unical.edu.ng
C. N. Emeka
Department of Geology, University of Calabar, PMB 1115,
Calabar, Nigeria
which contaminants can be transported to the aquifer
horizons by natural processes includes; advection, dif-
fusion and dispersion (Ezzy et al. 2006). The rate and
quantity of contaminants that can be discharged into the
aquifer horizon depend on the hydraulic conductivity
(or permeability) of the vadose zone materials, depth to
water table, groundwater recharge and groundwater
flow media (Foster et al. 2002) Studies have shown that
aquifer systems overlain by thin and porous materials,
lack adequate protection and are susceptible to contam-
ination (Okiongbo and Akpofure 2012). In such areas,
the pores of the sandy or silty materials may serve as
pathways through which contaminants are transported
to the aquifer, since they are not optimally equipped
with the capacity to resist the continuous downward
movement of the contaminants (Sorensen et al. 2005).
Conversely, thick impermeable clay aquitards have the
capacity to strongly resist such movements and can thus
offer sufficient protection to the aquifer (Braga et al.
2006; Gemail et al. 2011).
In the study area, environmentalists are currently
expressing concerns over remediation cost; the eventual
results in the event of full-blown contamination and the
difficulty of controlling the adverse effects of such con-
tamination since majority of water users are tapping
water from the same source (i.e. aquifer) sometimes at
very shallow depths of ~25 m. These shallow aquifers
are localised and heterogeneous due to the blocking of
groundwater flow paths by sandstone hills (Akpan et al.
2013). In most communities, tectonically induced inter-
connected fractures within shaly materials that lack high
filtering capacity as their sandy counterparts are the only
channels of water circulation (Okereke et al. 1998; Raju
and Reddy 1998; Akpan et al. 2013; Ebong et al. 2014).
The circulations of water within these fractured aquifers
are localised (Akpan et al. 2013) hence, will require site-
specific investigations. Such investigations are neces-
sary in order to, not only gain insight into the level of
aquifer protection but also assess the potability status of
the aquifers. Information generated from such investi-
gations are useful in maintaining the quality status of the
aquifers as well as management of the groundwater
resources (Ezzy et al. 2006).
Good understanding of the spatial distribution of the
lithological properties and thicknesses of the overlying
vadose zone materials can be used in assessing the
vulnerability of aquifers. Since the various overlying
lithological materials have different physical character-
istics, geophysical techniques such as the electrical
resistivity, seismic refraction and ground penetration
radar can be used to map the distribution and spatial
spread of these materials. These methods are known to
be economical and less time-consuming (Ebong et al.
2014). The electrical resistivity technique can be used to
infer the distribution of shallow lithological materials
from the variations in resistivity of such materials, since
impermeable argillite-dominated lithologic unit are
characterised by low resistivity values in contrast to
arenite-dominated lithologic units that will be more
resistive (Gemail et al. 2011). The aquifers in most parts
are very shallow and highly vulnerable to contamination
especially in areas overlain by arenaceous materials.
This study is aimed at using electrical resistivity infor-
mation and geological data to
1. assess the level of protection that the fractured and
sandy aquifers in Abi area are current enjoying
2. assess their levels of vulnerability to contamination
3. generate aquifer vulnerability map for the area
4. suggest measures for efficient management and sus-
tenance of groundwater quality.
Hence, this pilot investigation will provide a frame-
work for planning and controlling of human activities on
the land surface within the area.
Aquifer vulnerability assessment
Aquifer vulnerability assessment seeks to quantify the
sensitivity of an aquifer system to groundwater degra-
dation due to human activities. It is an intrinsic property
of the groundwater system that depends on the sensitiv-
ity of the system to the human influence on the surface
and/or natural events (Vrba and Zaporozec 1994;
Almasri 2008). The vulnerability of groundwater cannot
be measured directly; hence, it is a complex function of
the hydrogeologic parameters prevalent within the area
of interest which can serve as protection to the underly-
ing aquifer system or pathways of contaminant transport
(Gogu and Dassargues 2000). It could also be assessed
from the standpoints of analogue models and parametric
systems (Conrad et al. 2002).
Arising from the increasing trends in groundwater
contamination studies, several techniques have been
developed for quantitative assessment of aquifer vulner-
ability to contamination by surface, or near surface
pollutants (Casas et al. 2008). These techniques use
156 Page 2 of 18 Environ Monit Assess (2015) 187: 156
information generated from hydrologic, geophysical
and GIS data either in stand-alone basis or in integrated
form to assess the vulnerability of aquifer to contamina-
tion (Neshat et al. 2013). These techniques include the
DRASTIC and its modified varieties that uses seven
hydrological parameters in assessing aquifer vulnerabil-
ity and environmental deterioration (Aller et al. 1987;
Leone et al. 2009; Javadi et al. 2011), the aquifer vul-
nerability index (AVI) method (Draoui et al. 2007;
Ducci and Sellerino 2012; Fraga et al. 2013; Edet
2014), the IEC (Kirsch et al. 2003; Casas et al. 2008),
the groundwater hydraulic confinement–overlying stra-
ta–depth to water table (GOD) method (Foster 1987;
Foster et al. 2002) and SINTACS (Civita and De Maio
1997; Sinkevich et al. 2005; Yin et al. 2012). The DRAS
TIC method is the most widely used in spite of the large
amount of hydrogeological data involved. The
geophysical-based IEC and the GOD techniques use
less number of data but can generate acceptable results
thus, making both techniques popular choices for pre-
liminary evaluation of aquifer vulnerability (Draoui
et al. 2007; Fraga et al. 2013). The IEC and GOD
techniques were used in this pilot study.
Aquifer vulnerability maps show areas of low and
high aquifer vulnerabilities which are vital tools for the
construction of groundwater contamination risk maps
(Perles Roselló et al. 2009; Kirsch 2006). Generally, the
parameters necessary for assessing aquifer vulnerability
depend on the hydrogeological characteristics of the
vadose zone which may encourage or impede contam-
inant transport and on the theory of stratified conductors
(Henriet 1976). Since hydrogeologic conditions such as
permeability of the vadose zone overlying aquifer sys-
tems differ based on geologic settings, the degree of
protection offered to the aquifers will definitely vary.
Thus, different vulnerability ratings will be assigned to
the various aquifers, based on the characteristics of the
vadose zone materials (Casas et al. 2008).
Many researchers have adopted the AVI technique in
assessing the vulnerability of the aquifers to surface
contaminants. The AVI approach uses hydraulic resis-
tance (HR) to the vertical flow of water through the
vadose zone in quantifying aquifer vulnerability (Van
Stempvoort et al. 1992). HR can be computed from
Eq. (1) as
HR ¼
Xn
i ¼ 1
hi
ki
ð1Þ
where hi and ki are thickness and hydraulic conductivity
of the ith layer above the aquifer respectively. In arena-
ceous materials, k values are usually of the range 10−5
–
10−1
m/s and are higher than their argillaceous counter-
parts by several orders of magnitude (Freeze and Cheery
1976; Kirsch 2006). Eq. (1) is based on the assumption
that each layer is intact and multiple layers are perpen-
dicular to the flow direction. In the field, layers are not
perfectly intact due to geologic complexities; hence,
preferential pathways exist which could alter laboratory
measured HR values of geologic materials. Since HR
observations depend on the thickness and lithologic
composition of the local materials in the vadose zone
(Gemail et al. 2011), geophysical techniques such as
electrical resistivity can be used to map their spatial
distribution (Kirsch 2006).
For unconsolidated detrital materials where the bulk
resistivity of the protective layer depends on effective
porosity and quantity of clay as matrix, effective poros-
ity will thus be a dominant factor that controls the value
of HR. Conversely, values of HR for clay dominated
protective layer will depend on the clay content.
Therefore, the magnitude of HR generated from
Eq. (1) will be proportional to the clay content of the
geologic materials (Kirsch 2006). From Eq. (1), HR has
the dimension of time and can be used to estimate the
vertical travel time of water from the surface to the top
of the aquifer (Van Stempvoort et al. 1992). According
to Kirsch (2006), travel time estimates made from the
HR approach are usually crude estimates since influenc-
ing factors such as hydraulic gradient, diffusion and
sorption capacity are ignored in such computations.
Based on the dependence of HR on the lithological
and physical characteristics of the protective layers, the
k term in Eq. (1) can be replaced by the electrical
resistivity (ρ) or its inverse, conductivity (σ ¼ 1
ρ) of the
layer. By this approach, the observed HR results will be
equivalent to the integrated electrical conductivity (IEC)
or geophysical-based protective index (GPI) parameter.
Thus
IEC ¼
Xn
i¼1
hi
ρi
¼
Xn
i¼1
hi  σi ð2Þ
IEC can also be used to assess the vulnerability of
aquifers to surface contamination (Casas et al. 2008).
Ordinarily, the computation of the IEC values is sup-
posed to be a simple arithmetic operation provided hi
and ρi are available from either quantitative
Environ Monit Assess (2015) 187: 156 Page 3 of 18 156
interpretation of resistivity sounding, tomographic data
or other sources such as wireline logs, time domain
electromagnetics and geological data. Since quantitative
interpretation of resistivity sounding or tomographic
data is usually not possible due to constraints imposed
by the problem of equivalence, longitudinal conduc-
tance (S) can be used to suppress the associated inter-
pretational ambiguities (Casas et al. 2008). According to
Maillet (1947) and Niwas and Singhal (1981), the lon-
gitudinal conductance, which is one of the Dar Zarrouk
parameters is defined as
S ¼
Xn
i¼1
hi
ρi
ð3Þ
Thus, groundwater circulating in aquifers overlain by
thick lowly resistive geologic formation will have stron-
ger protection from surface pollutants (Casas et al. 2008;
Gemail et al. 2011) and vice versa. The conventional
unit of the IEC is the mho (Ω−1
) otherwise called the
siemens (S).
The acronym GOD in hydrogeology stands for three
dominant contaminant attenuating parameters. The let-
ter G expresses the level of groundwater hydraulic con-
finement and it measures the extent of hydraulic con-
finement of the water circulating within the aquifers.
Since the aquifer can be either fully or partially con-
fined, the hydraulic confinement parameter apportions
varying vulnerability levels to the aquifer. Thus, numer-
ical values assigned to G are such that for unconfined
and fully confined aquifers, G values lie between 1 and
0. The letter O in the acronym represents the bulk nature
of the overlying strata. The O term describes the char-
acter of the materials overlying the aquifers with respect
to their capacity to impede the flow of contaminants.
Values assigned to the O parameter, usually tend to 0 if
the vadose zone materials are dominated by impervious
argillites such as clays, shales, silty sands and fresh
basement rocks such as granite. For arenaceous and
other permeable materials such as loose sands, gravels
and porous limestone materials, weights assigned to the
letter O usually approaches 1. Finally, the letter D in the
acronym represents the depth to the groundwater table.
This parameter is important in assessing the travel time
of the contaminants from the surface or near surface to
the aquifer. Weights assigned to the D parameter in-
creases as the depth to the groundwater decreases.
Since the GOD technique is the product of composite
parameters, final vulnerability ratings for different geo-
logic materials are as shown in Fig. 1.
Physiography of study area
Abi LGA (Fig. 2a) is located between latitudes 5.76° N
and 6.02° N of the Equator and longitudes 7.93° E and
8.71° E of the Greenwich Meridian in Cross River State,
Nigeria (Figs. 2b). Ikwo and Afikpo Local Government
Areas (LGAs) in Ebonyi State bound Abi in the north
and west respectively. It is bordered in the northeast by
Yakurr and Obubra LGAs and bounded in the south by
Biase LGA. Two dominant climatic conditions, the wet
and dry seasons are common in the area. These condi-
tions depict a humid climatic condition with relative
humidity of ~80 %, annual precipitation of ~2,200 mm
and temperatures dropping to as low as 23 °C in the wet
season and rising to ~35 °C in the dry season. The wet
season starts in March when moisture-enriched tropical
maritime air mass that originates from the Atlantic
Ocean blows northward across the area. The air mass
usually begins the gradual process of temporal cessation
of continuous blowing activity in the area around
October which marks the end of the rainy season.
Water levels in both the groundwater and surface water
resources in the area usually attain maximum elevations
above the datum (i.e. mean sea level) in the rainy season.
Sudden increase in aridity, ambient temperature and heat
usually mark the beginning of the dry season in the
month of November and these harsh conditions will
persist till March. The beginning of the dry season
marks the arrival of the tropical continental air mass that
blow southward from the Sahara Desert across the area.
Most of the surface water resources usually dry up in the
dry season leading to severe water scarcity in the entire
area.
Hydrogeology
The dimension of the southward flowing Cross River
which crosses Abi LGA is ~56 km long and ~0.2 km
wide. The Cross River and its tributaries drain the entire
area (Figs. 2a). Abi is located in the middle course of the
river regime where it exhibits a sluggish and meander-
ing flow pattern with huge sand deposits at the beaches.
Some lakes including the Ijum and Ekpon Azogor
Lakes and a few artificial ponds also contributed to the
156 Page 4 of 18 Environ Monit Assess (2015) 187: 156
draining of the area. Rainfall is the primary source of
recharge for the numerous water resources in the area.
The volume of water and the amount of sediments that
the Cross River transports across the area is season
dependent. The volume of water in the rivers, streams
and other surface water resources in the area usually
drop to all-seasons low at the peak of the dry season and
water flow in the Cross River is normally restricted to
narrow channels in the riverbed. During the wet season,
there is usually a rapid rise in water levels in the Cross
River and its tributaries, probably due to bank filtration,
flooding, seepage from ponds and direct infiltration of
rainwater most of which forms the bulk of groundwater
recharges in the entire area during the season.
Evapotranspiration is usually high in most of the elevat-
ed areas, thus leaving the groundwater in a predomi-
nantly slightly acidic state (Egboka and Okpoko 1984).
The slightly acidic groundwater usually seeps out of the
hills in the rainy season thereby causing the acidic water
to mix with the other water resources in the area.
Geology, stratigraphy and tectonics of the study area
Abi area is located in the Ikom Mamfe Embayment
(IME) in central Cross River State. The IME is located
between Latitudes 5°15′ N and 6°30′ N of the Equator
and between Longitudes 7°45′ E and 8°45′ E of the
Greenwich Meridian and is the NW–SE splay segment
of the NE–SW trending Benue Trough. The basin ex-
tends laterally into parts of Western Cameroun where it
covers an estimated area of ~2016 km2
(Eseme et al.
2002). The IME appears to be a contiguous part of the
Lower Benue Trough (LBT) (Ukaegbu and Akpabio
2009) and is bounded in the west by the Abakaliki
Anticlinorium, to the east and northeast by the Obudu
None
Overflowing
Unconfined
(covered)
Unconfined
Confined
0.0 0.2 0.4 0.6
Semi-confined
1.0
Lacustrine/
estuarine
clays
Residual
soils
Alluvial silts,
loess, glacial
till
Aeolian
sands
Alluvial and
fluvio-glacial
sands
Alluvial-fan
gravels
UNCONSOLIDATED
(sediments)
Mudstones Siltstones Sandstones
Chalky
CONSOLIDATED
(porous rocks)Shales Volcanic tuffs
Limestones
Calcarenites
Igneous/metamorphic
formations and older
volcanics
Recent
volcanic
lavas
Calcretes +
karst limestones
CONSOLIDATED
dense rocks
0.4 0.5 0.6 0.7 0.8 0.9 1.0
20-50m
5-20m
<-5m
>-50m
Alldepths
0.6 0.7 0.8 0.19.0
0.0 0.1 0.2 0.3 0.4 0.5 0.6 0.7 0.8 0.9 1.0
NEGLIGIBLE LOW MODERATE HIGH EXTREME
AQUIFER
POLLUTION
VULNERABILITY
DEPTH TO GROUNDWATER
TABLE (unconfined)
OR STRIKE (confined)
OVERLYING STRATA
(lithological character
and degree of consolidationof
vadose zone or confining beds)
GROUNDWATER
CONFINEMENT
Fig. 1 The GOD vulnerability index for various geologic materials (Adapted from Foster et al. 2002)
Environ Monit Assess (2015) 187: 156 Page 5 of 18 156
Plateau and the Cameroun Volcanic Line and in the
southeastern part by the Oban Massif (Fig. 3a). It is
characterised by low relief and gently undulating topog-
raphy (Eseme et al. 2002) and covers some communities
in Abi, Ikom, Obubra, Biase and Yakurr LGA of Cross
River State (Figs 3b). Deposition of the Asu River
Group (ARG) on the crystalline basement that underlies
the IME and parts of the LBT has been reported to have
commenced in the Albian time. This deposition marks
the first marine incursion into the area. Migmatitic and
granitic gneisses and schists with some pegmatitic in-
trusions in some locations dominate the basement ma-
terials. The gneisses are usually foliated with some pink
feldspartic materials and vary from black to white horn-
blende. The dominant strike of regional geologic struc-
tures is NE–SW although some occasional N–S swings
have also been reported (Ekwueme et al. 1995; Eseme
et al. 2002). Impervious shales, limestones, sand lenses,
sandstone intercalations and ammonites dominate the
sediments within the ARG (Odigi and Amajor 2009).
Late Albian–Cenomanian thick flaggy impervious cal-
careous and non-calcareous black shales; siltstone and
sandstones dominated Eze-Aku Group (EAG) overlies
the ARG. According to Murat (1972), the sediments of
EAG were deposited under marine condition in a tecton-
ically controlled basin. The regressive and transgressive
cycles of the marine incursion was marked with the de-
position of sandstone, other detrital sediments and argilla-
ceous materials. Brackish marsh and highly fossiliferous
pro-deltaic facies of Late Campanian-Early Maastrichtian
Nkporo Shales Formation (NSF) overlie the EAG (Reijers
and Nwajide 1998). Deposition of the sediments of the
NSF reflects a funnel-shaped shallow marine setting that
graded into channelled low-energy marsh.
Dense, fine-grained and sometimes dark coloured
Tertiary volcanic rocks (e.g. basalts and dolerites) in-
trude these Cretaceous lithostratigraphic units in some
locations. It has been opined that these post Cretaceous
and other low-grade metamorphic activities originated
from the adjoining Cameroun Volcanic Province (CVP).
Fig. 2 Geological map of Abi LGA (a) showing locations of VES stations and ERT profiles. Insert: Map of Nigeria (b) showing location of
Abi LGA
156 Page 6 of 18 Environ Monit Assess (2015) 187: 156
These activities resulted in immense alterations in the
primary lithological and physical properties (e.g. porosity,
resistivity) of the overlying Cretaceous lithostratigraphic
units. Thus, the overlying Cretaceous materials are occa-
sionally highly baked, domed and seriously deformed in
many locations (Benkhelil et al. 1975; Offodile 1975).
Tectonic-induced episodes of compressional/
tensional regimes that occurred in Cenomanian and
Santonian times caused significant alterations in the sed-
imentary rocks such as folding and realigning of the
sediments in a predominantly NE–SW direction. These
deformations produce multiple folds and fractures paral-
lel to the fold axis. These episodic tectonic disturbances
led to the formation of the Abakaliki Anticlinorium and
the Afikpo Syncline (Onwualu et al. 2012). In many
locations, the sandstones in the Eze-Aku Group form
ridges that averagely strike at N40o
E and dip between
20° and 68° (Egboka and Uma 1986).
Materials and methods
VES data acquisition and analysis
Physical properties (e.g. electrical resistivity, dielectric
constant and acoustic impedance) of geologic materials
that over- and underlie aquifers are expected to show
reasonable contrast such that a carefully organised elec-
trical resistivity investigation can be used to map their
spatial distribution. From the analysis and interpretation
of such data constrained with geologic and lithologic
information, the distribution of such materials can be
inferred from the discontinuities in the electrical signa-
tures (Casas et al. 2008; Gemail et al. 2011).
Consequently, an experimental design that centres on
electrical resistivity mapping was planned and executed
in the study area.
Electrical resistivity method is a geophysical explo-
ration tool that can be employed in mapping the spatial
distribution of resistivity of earth materials from ob-
served potential differences induced when electrical
current is passed through them via a pair of pointed
electrodes (the current electrodes). The resistivity
methods adopted in the data acquisition in this study
comprise vertical electrical sounding (VES) that was
randomly performed in 40 well-distributed stations
spread across the entire area and five 2D ERT profiles
(Fig. 2a). The VES field procedure was performed using
the Schlumberger electrode array. The choice of the
Schlumberger array was informed by its suitability for
mapping shallow- and deep-seated structures, since
electrodes are expanded on logarithmic basis. For the
purpose of mapping very shallow resistivity variations,
minimum current electrode spacing (AB) was 2 m while
in some locations, field constraints such as the undulat-
ing topography and settlement pattern restricted maxi-
mum current electrode spacing to vary between 500 and
600 m. The corresponding potential electrode spacing
varied from 0.5 m for the minimum electrode spacing to
40 m for the maximum electrode spacing. As is typical
of the VES procedure performed with the Schlumberger
array, the current electrode spacing were increased after
Fig. 3 Generalised geological map of Nigeria showing location of study area (A) and (B) digital elevation map of Abi LGA
Environ Monit Assess (2015) 187: 156 Page 7 of 18 156
each acceptable resistance reading and their correspond-
ing potential electrode spacing were increased only when
necessary. In all cases, the MN spacing was such that AB/
2≥5MN/2, so as to validate the potential gradient assump-
tion (Keller and Frischknecht 1966; Dobrin and Savit
1988). Contact resistance problems were severe in the
dry season in some locations but its effect was minimised
by repeated wetting of the electrode positions. The tech-
nique of re-designing the data sheet such that all cross
over points take on integer multiple of their original values
was adopted. This was necessary to aid visual conversion
and comparison of acquired data. The converted data at
the cross over points were checked to ensure that they
satisfy preset repeatability conditions prior to recording
otherwise, measurements were repeated.
The raw apparent resistance data were transformed to
the apparent resistivity domain and smoothened to re-
move noisy data where necessary. Manual interpretation
procedure that involves the matching of field curves
with theoretically prepared curves was performed
(Orellana and Mooney 1966; Rijkswaterstaat 1969).
Partial curve matching procedure was adopted in gener-
ating preliminary layer parameters from the field curve.
The starting model of the inversion process consists
of the raw VES data and the initial layer parameters
generated from the manual procedure. The RESIST
modelling code (Vender Velpen 1988) was used in the
computer aided inverse modelling phase. In the process
of inverting the raw input data, the RESIST code auto-
matically computed theoretical data from the prelimi-
nary layer parameters generated in the manual interpre-
tation phase. A subroutine program within the RESIST
code compares the theoretical data with the raw field
data, computes and displays the difference between the
two sets of data using the root mean square error
(RMSE) technique. Borehole lithologic data near the
VES points obtained from the Cross River State Rural
Water Supply and Sanitation Agency (CRS-RUWATSS
A) were used to provide constraints during the inversion
process to reduce ambiguities in the interpretation stage.
The initial RMSE values were reduced to acceptable
values that suit the starting models by performing a
couple of iterations. The inverse modelling produced
models that best fit the data in a least squares sense
using ridge regression (Inman 1975). Typical VES
curves obtained after the inverse modelling exercise
are shown in Fig. 4.
IECs were computed from the observed layer param-
eters (thicknesses and resistivities) using Eq. (2) and the
results were contoured (Fig. 5a) using SURFER 11
contouring software from Golden Software Inc., USA.
In addition, the inverted results of the Schlumberger
soundings were combined, gridded using the Kriging
method and contoured to generate the resistivity cross-
sections (Fig. 6a and b) that closely approximate the
shallow lithographic sequence in the area. The choice of
the Kriging method was informed by its ability to min-
imise the variance of the estimation error (Van Beers and
Kleijnen 2003; Jassim and Altaany 2013).
ERT data acquisition and analysis
Multi-electrode data were acquired along the profiles
indicated in Fig. 2a using a SAS 1000 model of ABEM
resistivity metre and the ES 10-64 switching unit. The
choice of the 2-D ERT technique was informed by the
desire to generate a laterally extensive (>100 m) high-
resolution subsurface image of the area (Chambers et al.
2011). Such subsurface images were expected to serve
as a visual aid to the pattern of resistivity changes within
the shallow subsurface. The ERT profiles were posi-
tioned along fairly planar ground surfaces in order to
reduce effects of topography on the data. The ERT
imaging was performed using the Wenner electrode
array that is reputed for its capacity to generate data with
high signal to noise ratio (Loke et al. 2003).
Minimum electrode spacing (a) was 3 m while the
maximum was 11 m. Electrical contacts between the
ground and the electrodes were carefully checked and it
was observed that majority of the electrodes have con-
tact resistances that vary between 200 and 300 Ωm. This
range of contact resistances have been reported by
Wilkinson et al. (2010), to be excellent for proper trans-
mission of electrical current into the ground. Water and
brine were used to improve contact resistances between
the ground and the electrodes where necessary.
The reciprocal error (RPE) technique that involves
interchange of the current and potential electrode cable
was adopted for in situ data quality assessment. The
RPE was computed using Eq. (4) with 5 % set as the
maximum acceptable value
e ¼ 100
ρn−ρrj j
ρn þ ρr
ð4Þ
The RPE was observed to be less than 5 % in many
locations but where occasional swings were observed,
measurements were repeated.
156 Page 8 of 18 Environ Monit Assess (2015) 187: 156
The ERT data were further filtered and the
RES2DINV software (Loke and Barker 1996; Loke
et al. 2003) was used to model the data. The
RES2DINV software is equipped with codes that enable
Fig. 4 Model VES curves observed at a Egboronyi, b Adadama 1, c Agbara and d Ilike Communities. Insert: Correlation of borehole
lithologs with inverted VES results
Fig. 5 Observed vulnerability maps generated from a IEC and b GOD techniques
Environ Monit Assess (2015) 187: 156 Page 9 of 18 156
the computer to execute finite difference modelling and
non-linear smoothness-constrained least-squares opti-
mization procedures. Thus, the software can calculate
apparent resistivity and the resistivity values of the
model blocks respectively (de Groot-Hedlin and
Constable 1990). In the process of executing the sub-
routine commands, the RES2DINV subdivides the sub-
surface into rectangular grids that are equal in number to
the number of data points and iteratively adjusts the
resistivity model of each block by minimising the dif-
ference between the observed and the calculated resis-
tivity values. It eventually transforms the measured ERT
data into an approximate picture of the true subsurface
resistivity distribution and geometry (Olayinka and
Yaramanci 2000). This procedure is known to produce
smooth variations in subsurface resistivity distribution
with depth (Loke et al. 2003) especially in areas with
geologic constraints. The RMSE technique was also
adopted in quantifying the difference between the theo-
retical and the observed data sets, which was iteratively
minimised until a satisfactory fit was obtained. Samples
of the ERT-derived subsurface images are shown in
Fig. 7.
The GOD data acquisition
Relevant information on the nature and spatial distribution
of the confining materials in the area were sourced from
the geologic map of Abi LGA (Fig. 2a). Results obtained
from the 1D and 2D modelling of resistivity data were
used in assessing the vertical continuity of the various
lithologic units. After ascertaining the confining conditions
of the aquifers in the entire area using geophysical and
geological information, numerical values that vary be-
tween 0.2 and 0.4 were assigned to the G parameter.
Generally, low values were assigned to G because imper-
vious materials that range from consolidated materials such
as shalestones, siltstones sandstones and claystones to
thick argillaceous materials such as clays, shales and silts
overlie over 85 % of the entire area. The lineament map of
the area (Fig. 8) was used to provide constraints on the
Fig. 6 Resistivity cross-sections
generated along profiles a A–A′
and b B–B′
156 Page 10 of 18 Environ Monit Assess (2015) 187: 156
numerical values assigned to G. Where lineaments were
observed, a value of 5 was assigned to the G parameter.
Impervious arenaceous sandstones, argillites and their
deformed counterparts dominate the geology. Therefore,
the indices for the O parameter were made to vary be-
tween 0.4 and 0.7. Static water level (SWL) observations
from 40 boreholes in the area were used in selecting
values of the D parameter. The SWL data were observed
to vary between 2 m in Adadama Community and ~17 m
at Igoni-Igoni Community. Locations with SWLs below
5 m were assigned D index value of 0.9 while locations
where SWL variations were observed to vary between 5
and 20 m were assigned D index of 0.8 in accordance
with the classification of Foster et al. (2002) (Fig. 1). The
GOD indices were averaged, gridded and contoured on
Abi map (Fig. 5b) in order to assess its spatial variation.
The two maps (IEC and GOD) are shown in Fig. 5.
Results and discussions
The inferred shallow surface electrostratigraphy and
layer parameters (Table 1) generated from the inversion
process were in good agreement with available borehole
lithologic logs closest to some of the VES stations
(Fig. 4).
Litho- and hydro-resistivity cross-sections
The two VES-derived resistivity cross-sections
(Fig. 6a, b) capture the shallow subsurface of the area
as being dominated by thickly bedded argillaceous and
arenaceous materials that are characterised by low resis-
tivity (ρ<150 Ωm) value. The argillites are usually
capped by some more resistive (ρ>700 Ωm) sandstone
materials with variable thicknesses. The sandstone
Fig. 7 Representative subsurface images generated using the ERT technique
Environ Monit Assess (2015) 187: 156 Page 11 of 18 156
materials are exposed extensively in many communities
in the area. In the north–south profile (Fig. 6a), the
sandstone materials are characterised by high resistivi-
ties (ρ>1,000 Ωm) and thicknesses that do reach 5 m in
some locations. These materials are underlain by thickly
bedded argillites whose vertical continuity is occasion-
ally truncated by some more resistive sandy materials
(ρ>100 Ωm). These sandy materials are characterised
by variable thicknesses and are saturated with site-
dependent discharge rate. According to Akpan et al.
(2013) and Petters (1989), this sandy horizon has low–
high groundwater yield and is the dominant source of
potable water in the area. The overlying sandstones and
the adjoining clayey materials form the protective cap
that seals the interbedded sandy materials from surface
contaminants. The overlying sandstones and argilla-
ceous materials and the underlying argillaceous mate-
rials also serve as the confining units for the aquifers.
The level of aquifer confinement is site dependent due to
the abundance of subsurface structural discontinuities
such as fractures (Fig. 6a) appearing to exert significant
influence on them. These structural discontinuities (e.g.
fractures and joints) serve as preferential pathways for
contaminant transport.
The thickness of the interbedded sandy aquifers
varies with spatial location and its resistivity values
seem to depend on the extent of saturation, composition
of the saturating fluid andlithological composition. Near
the surface where the sandy materials are fairly sorted
and the pores are air filled, resistivity values were high
(ρ>700 Ωm) compared to the sandy materials at deeper
depths where the pores are water filled. Underlying the
sandy materials are sets of moderately resistive argilla-
ceous materials with vertical continuity that extends
beyond 70 m. Thus, the sandy aquifers exist in a ful-
ly–partially confined state though at shallow depth.
In the NE–SW oriented AA′ resistivity profile that
runs through the NSF (Fig. 6b), high resistivity (ρ>
1,000 Ωm) arenaceous materials with south-west in-
creasing thickness, cap the entire lithostratigraphic se-
quence. From the beginning of the profile to ~8 km, the
sandstone materials are ~1 m in vertical extent while
their thickness increased to ~15 m in the other part of the
profile. Moderately consolidated argillaceous materials
(ρ<200 Ωm) with variable thicknesses directly underlie
the sandstone materials. From the northeastern section
up to ~5 km along the profile, argillaceous materials
dominate the entire lithostratigraphic sequence.
Fig. 8 Lineament map of Abi,
Nigeria
156 Page 12 of 18 Environ Monit Assess (2015) 187: 156
Table 1 Summary of layer parameters generated from the inversion of VES data
S/no. Location coordinates Layer resistivity (Ω. m) Estimated depth to bottom (m)
Longitude (°) Latitude (°) VES Points ρ1 ρ2 ρ3 ρ4 ρ5 h1 h2 h3 h4
1 8.0975 5.9407 VES1 261.3 15.8 6.9 52.8 466.1 0.7 4.3 22.4 20.0
2 8.0837 5.9346 VES2 176.2 54.9 20.8 115.6 – 1.4 3.9 30.6 –
3 8.0897 5.9370 VES3 546.1 53.8 73.8 160.5 – 1.3 15.3 29.2 –
4 8.0848 5.9312 VES4 149.3 18.5 23.7 2.2 35.9 1.4 5.3 10.3 21.0
5 8.0999 5.9249 VES5 232.0 1,186.0 1,444.8 263.0 329.5 1.4 3.9 33.0 16.0
6 8.0968 5.9293 VES6 1,583.0 252.7 896.9 135.8 147.2 2.9 4.4 9.7 62.9
7 8.0827 5.9304 VES7 519.5 101.2 44.8 58.5 – 1.4 4.7 32.7 –
8 8.0828 5.9286 VES8 1,425.8 27.9 10.2 246.4 – 1.0 1.8 18.7 –
9 8.0319 5.9069. VES9 490.0 112.2 27.3 17.5 – 2.0 4.5 33.4 –
10 8.0384 5.9115 VES10 148.4 265.5 19.4 60.5 – 1.2 1.6 60.0 –
11 8.0124 5.9963 VES11 2,262.9 55.9 12.3 21.5 88.2 1.0 0.9 61.0 10.8
12 8.0211 5.9938 VES12 762.1 79.8 286.0 62.7 178.2 1.6 4.9 14.0 16.2
13 8.0268 5.9947 VES13 33.8 59.8 405.1 30.4 122.7 3.0 1.2 7.7 35.2
14 8.0453 5.9920 VES14 448.6 100.3 68.9 56.5 155.3 1.1 2.2 11.8 13.9
15 8.0159 5.9907 VES15 209.5 25.6 97.6 – – 2.1 14.9 – –
16 8.0198 5.9276 VES16 370.7 1,881.2 419.3 60.2 88.1 0.7 2.7 18.7 33.3
17 8.0368 5.9453 VES17 313.0 121.8 17.1 86.3 267.0 1.6 5.5 21.3 14.4
18 8.0470 5.9021 VES18 1,277.0 303.8 98.5 271.5 562.0 1.1 6.7 14.8 19.8
19 8.0356 5.8697 VES19 289.4 85.6 15.9 98.8 – 1.4 6.1 39.0 –
20 8.0286 5.8631 VES20 654.0 27.9 10.6 72.2 – 1.3 2.6 31.0 –
21 8.0119 5.8367 VES21 447.3 858.6 120.6 745.9 60.4 1.5 1.9 5.5 16.3
22 7.9654 5.8476 VES22 249.3 66.2 11.4 25.6 – 0.9 19.3 61.3 –
23 7.9646 5.8496 VES23 346.6 76.6 415.5 13.5 – 1.8 2.8 6.7 –
24 7.9939 5.8838 VES24 500.5 3,886.4 602.7 804.4 – 1.2 23.6 51.3 –
25 8.0025 5.8765 VES25 4,567.8 9,404.1 1,690.2 338.2 458.4 1.3 2.6 24.1 36.1
26 8.0035 5.8791 VES2626 408.6 9,520.9 843.4 155.5 521.1 0.6 1.9 22.0 23.7
27 8.1598 5.9400 VES27 129.0 38.2 13.6 24.0 – 2.4 5.7 24.0 –
28 8.1603 5.9429 VES28 155.2 66.2 16.2 50.0 – 1.3 6.1 32.8 –
29 8.1609 5.9443 VES29 350.7 384.6 73.2 21.4 – 5.8 4.8 16.3 –
30 8.1459 5.9370 VES30 1,071.1 15,164.2 2,207.9 55.2 88.6 0.4 1.3 12.9 28.0
31 8.1167 5.9362 VES31 94.1 359.2 771.9 164.0 – 1.3 8.0 31.5 –
32 8.1194 5.9339 VES32 3,481.9 23,137.2 541.5 165.8 – 1.0 3.0 29.4 –
33 8.1148 5.9338 VES33 507.7 3, 409.5 111.6 359.5 13.2 0.6 1.7 14.3 11.6
34 8.1128 5.9321 VES34 545.3 203.8 380.0 90.3 – 2.8 4.5 41.9 –
35 8.1486 5.9575 VES35 244.1 9.6 35.1 4.4 29.6 1.4 4.9 5.8 9.6
36 8.0810 5.9405 VES36 1,318.6 309.0 17.7 32.8 99.3 2.0 4.1 8.7 8.5
37 8.0958 5.9539 VES37 207.1 17.7 52.3 11.8 54.0 1.6 9.8 14.5 30.2
38 7.9694 5.8194 VES38 2,474.5 8, 623.6 363.6 428.7 – 1.2 7.2 43.4 –
39 7.9568 5.8260 VES39 654.0 27.9 10.6 72.2 – 1.3 2.6 31.0 –
40 7.9702 5.8047 VES40 2,832.2 1, 124.5 183.0 879.1 – 0.6 6.5 15.3 –
Environ Monit Assess (2015) 187: 156 Page 13 of 18 156
However, from ~5 km to the end of the profile, moderate
resistivity (ρ<600 Ωm) sandstone materials were ob-
served to intercalate with the argillaceous materials.
These intercalating sandy materials are saturated at shal-
low depth range of ~20 to 55 m. Thus, the shallow
aquifers exist under partially to fully confined conditions.
Three representative ERT images of the area are
shown in Fig 7. The shallow subsurface image of ERT
1 located in the NSF shows moderately resistive sandy
materials (ρ>100 Ωm) with nearly uniform thickness
(~3 m) which cap the lithostratigraphic sequence. These
overlying arenaceous materials lie almost horizontal to
the underlying argillaceous materials. Low–moderate
resistivity (ρ<100 Ωm) argillaceous materials that dom-
inate the shallow subsurface image underlie the sand-
stones materials. These shaly materials extend beyond
15 m. The low resistivity (ρ<10 Ωm) associated with
these materials seem to be indicative of an area where
wastewater from cassava processing mills accumulates.
The subsurface image from ERT 2 (Fig. 7) that was
also stationed in the NSF show that, low resistivity (ρ<
50 Ωm) nearly parallel argillaceous materials overlie the
lithostratigraphic sequence. The clayey materials are
~5 m in thickness from the beginning up to ~40 m along
the profile. From ~40 m point, thickness of the argilla-
ceous materials increases to~12 m. Relatively high
resistivity (ρ>75 Ωm) arenaceous materials underlie
the clayey materials and dominate the entire image
beyond 17 m. These results show that the aquifers are
moderately protected since thin impermeable argilla-
ceous and consolidated arenaceous materials overlie
them. ERT 2 correlates strongly with results of VES
17 and the lithologic log of a close borehole (Fig. 7).
ERT 3 (Fig. 7) that was positioned in the EAG shows
that high resistivity (ρ>1,000 Ωm) arenaceous materials
that are in direct contact with some conducting clayey
materials dominate the subsurface from ~27 m to the
end of the profile. These arenaceous materials dip gently
eastward and are over 10 m thick in some locations.
Moderately resistive sandy–clay (ρ<800 Ωm) are dom-
inant from the beginning of the profile up to 27 m. The
high resistivity values suggest that the sandy–clay exist
in a highly deformed state.
Aquifer protection based on IEC and GOD indices
The aquifers in the study area, which are major source of
potable water for the people, are shallow (≤50 m) and
therefore the level of protection offered by the vadose
zone materials need to be established quantitatively. The
spatial distribution of IEC values and GOD indices in the
area are shown in Fig. 5 a, b. Observed values of the IEC
and the GOD indices were compared (Table 2) and the
IEC showed better representation and correlates with
geology. The resistivity cross-sections (Fig. 6) were also
used to assess the thickness of the vadose zone in the area.
IEC values range from <0.1 S for the weakly
protected aquifers to >2.0 S for strongly protected aqui-
fers. The pattern of IEC variation in the area is unsys-
tematic because it appears to be independent of factors
such as properties of the soil, net recharge and charac-
teristics of the unsaturated layer (Casas et al. 2008) that
are known to influence IECs. Rather, IEC values show
strong dependence on depth to the aquifer, which in turn
depends on the paleotectonic disturbances in the area
(Onwualu et al. 2012). These paleotectonic activities
seem to be a dominant factor that dictates the behaviour
of many geological structures in the area including the
dominant course of the Cross River. In some communi-
ties, e.g. Usumutong and Ebom in the southeastern
region, Itigidi at the centre, Ekureku in the northern part,
Adadama and Igbo Imabana in the northeastern part
(Figs. 2a, 3b and 8) where fractured materials overlie
the aquifer horizon (Ebong et al. 2014), the aquifers
were observed to be weakly-fairly protected with IEC
values varying between 0.1 and ~0.4 S.
The GOD indices vary from <0.30 in the lowly
vulnerable areas to 0.65 in the highly vulnerable areas.
The values of the GOD indices show that the aquifers in
Abi have moderate-high vulnerability to contamination.
This observation corroborates with the IEC results
(Table 2). Although laterally extensive impermeable
materials overlie aquifers in Abi, the lack of reasonable
thickness for proper contaminant attenuation by natural
process in many locations and fracturing of the overly-
ing consolidated materials (Fig. 8) can provide prefer-
ential pathways through which contaminants get to the
aquifers. In some isolated areas where the vadose zone
materials are reasonably thick, the vertical flow of
Table 2 General vulnerability and protective capacity classes
IEC (S) Protective capacity GOD Vulnerability rating
>2.0 Strong <0.3 Low
1.1–2.0 Moderate 0.3–0.5 Moderate
0.1–1.0 Fair 0.5–0.7 High
<0.1 Weak >0.7 Extreme
156 Page 14 of 18 Environ Monit Assess (2015) 187: 156
contaminants can be impeded by mechanical, physico-
chemical, microbiological and other natural processes.
These areas are located on topographic highs (Fig. 3b)
that incidentally correspond to regions of groundwater
recharge. Here, surficial contaminants and water migrate
into deeper layers through fractures (Akpan et al. 2013).
These fractures are characterised by large pore spaces
that naturally lacks the capacity to attenuate contami-
nants (Ebong et al. 2014). Most of the communities
where these weakly protected aquifers abound are loca-
tions where the farmers also practice yield enhancement
farming methods. Thus, with the high elevations and
steepness of slope, topographically induced flow gradi-
ent will drive surface water that are contaminated with
fertilizer, pesticides or other contaminants downhill into
the low lying areas (Akpan et al. 2013) thereby reducing
the rate at which contaminants infiltrate into the aquifer
horizon. However, during such downhill flows, the ten-
dency of the contaminated water to be driven into the
aquifer horizon via fractures and joints is certain al-
though at low rates and so can be neglected.Aquifer
protection based on the IEC in other communities varies
from 1.1 to ~2.6 S depicting a group of moderate to
strongly protected aquifers. These groups of aquifers are
dominant in the northern, southern, southeastern, south-
western and central parts of the study area (Fig. 5a)
where the EAG and NSF are dominant. Within these
geologic formations, the aquifers consist of sandy/
gravelly materials that are overlain by thick imperme-
able clayey/shaly materials and their metamorphosed
varieties. The impermeable and thick clay overburden
materials which are charaterised by low hydraulic con-
ductances serve as natural filters to any percolating fluid
(Sharma and Baranwal 2005; Yadav and Singh 2007;
Ebong et al. 2014). These materials reduce the rate of
movement of the fluid through them hence, increasing
their residence time and offering better protection to the
underlying aquifers.
Suggested management practices
Potential management practices for sustaining the aqui-
fers are as follows;
1. Faecal and total coliforms are human borne contam-
inant. Their menace can be minimised by the adop-
tion of good sanitary practices. Therefore, massive
education and reorientation on sanitary habits will be
the most powerful tool needed to curb its menace.
2. If inorganic chemical fertilizers especially those
enriched with nitrogenous compounds must be ap-
plied to the soils, the quantity, type and the time of
application must be carefully managed. This ap-
proach is the most practical, most acceptable and
standard practice in minimising groundwater con-
tamination resulting from the application of fertil-
izers, thereby sustaining groundwater quality within
such areas. The number of times that nitrogenous
fertilizers must be applied to the farm per season
must be properly regulated (Yadav and Wall 1998).
3. Other less harmful sources of soil nitrogen includ-
ing the use of organic substances to improve soil
fertility and consequently, crop yield should be con-
sidered (Waskom 1994).
4. The period of application of inorganic fertilizers
must be carefully planned so that it does not coin-
cide with the peak period of leaching, which in the
area will coincide with the peak period of rainfall of
June and July. Thus, fertilizer application must be
done at the period of maximum crop uptake.
5. The current practice of shifting cultivation, which is
the dominant system of farming, should be
sustained in spite of its short coming. This method
has the capacity of restoring lost soil fertility natu-
rally before the next cultivation period.
6. Industrialists should be encouraged to embrace en-
vironmental friendly methods of waste management
such as waste recycling in order to reduce their
impacts on the environment.
Conclusion
This study was embarked upon to quantitatively rate the
level of protection that will be of advantage or otherwise
to the fractured shales/sandy aquifers, which are the
major sources of potable water for the people in Abi-
Nigeria. Abi area was selected because it is an area
where inorganic wastes resulting from soil productivity
enhancement techniques and micro-industrial activities
are prevalent. The geophysical data used were the elec-
trical resistivity data generated from forty VES and five
100 m long 2-D ERT profiles. The geological data used
include the generalised geological, borehole lithologic
and tectonic information of the area. Both manual and
computer modelling techniques were adopted in
converting the measured field data to their geologic
Environ Monit Assess (2015) 187: 156 Page 15 of 18 156
equivalents using borehole lithologic data as constraints.
Interpreted layer resistivities and thicknesses were used
in computing the geophysical protective index (or IEC)
for lithologies that overlie the aquifers.
Results show that the composition of the aquifer
horizon varies from fractured shales –fractured sand-
stones to sandy/gravelly materials in the EAG and
NSF dominated areas. The aquifers exist under partially
confined to fully confined conditions. The composition
of the overlying materials varies from argillaceous ma-
terials in the EAG and NSF dominated areas to consol-
idated sandstones and shalestone materials. Thus, the
protection capacity offered by the overlying materials to
the aquifer varies from weak to strong depending on the
composition of the overlying materials that in many
cases, depends on the paleo-tectonic events of the area.
The weakly–fairly protected aquifers with IEC values
varying from 0.1 to ~0.4 S were dominant in locations
where fractured shales and other detrital materials domi-
nate the aquifer horizons. Impermeable consolidated
sandstones and/or shalestone materials overlie such aqui-
fers at very shallow depths. Most of the communities
where these aquifers abound are located on the elevated
parts of the study area. The overlying impermeable ma-
terials will reduce the rate of infiltration of contaminated
surface water and consequently increase their residence
time, thereby, strengthening surface runoff downhill.
The moderate–strongly protected aquifers are the
sandy/gravelly dominated aquifers in the EAG and NSF
areas characterised by IEC values that range between 1.1
and 2.6 S. The EAG and the NSF occupy the low lying
parts of the study area and aquifers are deeply buried at
depths below 40 m. Impermeable argillaceous materials
dominate the protective layers. Although locations where
these aquifers abound are areas where various forms of
farming practices including crop rotation that encourages
the use of artificial soil fertility enhancers is being prac-
ticed. The overlying clayey materials are thick enough to
naturally attenuate the contaminants and allow only good
quality water to get to the aquifer horizon. Finally, vul-
nerability mapping based on IEC and GOD techniques
are cost effective and efficient techniques for exploratory
assessment of aquifer protection and management as
these two are suited for regional investigations.
Acknowledgments The authors are grateful to the University of
Calabar, Calabar-Nigeria that provided the resources, which the
authors used in conducting the research. The contributions and
suggestions from the anonymous reviewers are gratefully
acknowledged.
References
Akpan, A. E., Ugbaja, A. N., & George, N. J. (2013). Integrated
geophysical, geochemical and hydrogeological investigation
of shallow groundwater resources in parts of the Ikom-
Mamfe Embayment and the adjoining areas in Cross River
State, Nigeria. Journal of Environmental Earth Sciences, 70,
1435–1456.
Aller, L, Bennet, T, Lehr, J.H., Petty, R.J., & Hackett, G. (1987).
DRASTIC: a standardized system for evaluating ground
water pollution potential using hydrogeologic settings. US
EPA, 600/2-87–035.
Almasri, M. N. (2008). Assessment of intrinsic vulnerability to
contamination for Gaza coastal aquifer, Palestine. Journal of
Environmental Management, 88, 577–593.
Benkhelil, M. G., Ponsard, J. F., & Saugy, L. (1975). The Bornu-
Benue Trough, the Niger Delta and its Offshore: Tectono-
sedimentary reconstruction during the Cretaceous and
Tertiary from geophysical data and geology. In C. A.
Kogbe (Ed.), Geology of Nigeria (pp. 277–309). Lagos:
Elizabethan Press.
Braga, A. C., Filho, W. M., & Dourado, J. C. (2006). Resistivity
(DC) method applied to aquifer protection studies. Revista
Brasileira de Geofisica, 24(4), 573–581.
Casas, A., Himi, M., Diaz, Y., Pinto, V., Font, X., & Tapias, J. C.
(2008). Assessing aquifer vulnerability to pollutants by elec-
trical resistivity tomography (ERT) at a nitrate vulnerable
zone in NE Spain. Environmental Geology, 54, 515–520.
Chambers, J. E., Wilkinson, P. B., Kuras, O., Ford, J. R., Gunn, D.
A., Meldrum, P. I., Pennington, C. V. L., Weller, A. L.,
Hobbs, P. R. N., & Ogilvy, R. D. (2011). Three-
dimensional geophysical anatomy of an active landslide in
Lias Group mudrocks, Cleveland basin, UK.
Geomorphology, 125(4), 472–484.
Civita, M., & De Maio, M. (1997). SINTACS Un sistema
parametricoper la valutazione e la cartografia per la
valutazione della vulnerabilit’a degli acquiferi
all’inquinamento, Metodologia e automazione. Bologna:
Pitagora Ed. 191.
Conrad, J., Hughes, S. & Weaver, J. (2002). Map production. In
Zaporozec, A. (Ed.), Groundwater contamination inventory:
a methodological guide (pp. 75-98). International
Hydrological Programme-VI, No. 2, UNESCO.
de Groot-Hedlin, C., & Constable, S. (1990). Occam’s inversion to
generate smooth, two dimensional models from
magnetotelluric data. Geophysics, 55, 1613–1624.
Dobrin, M. B., & Savit, C. H. (1988). Introduction to geophysical
prospecting (4th ed.). New York: McGraw-Hill Book
Company.
Draoui, M., Vias, J., Andreo, B., Targuist, K., & Stitou el MessarI,
J. (2007). A comparative study of four vulnerability mapping
methods in a detritic aquifer under Mediterranean climatic
conditions. Environmental Geology, 54, 455–463.
Ducci, D., & Sellerino, M. (2012). Vulnerability mapping of
groundwater contamination based on 3D lithostratigraphical
models of porous aquifers. Journal of Science of the Total
Environment, 447, 315–322.
Ebong, E. D. (2014). Hydrogeophysical and Physco-chemical
investigation of the Presbyterian Primary School Ekureku
Be Water borehole, Ekureku, Abi Local Government Area,
156 Page 16 of 18 Environ Monit Assess (2015) 187: 156
Cross River State. Unpublished Technical Report submitted
to Cross River State Community Development and Water
Supply Agency.
Ebong, E. D., Akpan, A. E., & Onwuegbuche, A. A. (2014).
Estimation of geohydraulic parameters from fractured shales
and sandstone aquifers of Abi (Nigeria) using electrical re-
sistivity and hydrogeologic measurements. Journal of
African Earth Sciences, 96, 99–109.
Edet, A. E. (2014). An aquifer vulnerability assessment of the
Benin Formation aquifer, Calabar, southeastern Nigeria,
using DRASTIC and GIS approach. Journal of
Environmental Earth Sciences, 71(4), 1747–1765.
Edet, A. E., & Okereke, C. S. (2002). Delineation of shallow
groundwater aquifers in the Coastal Plain Sands area
(Southern Nigeria) using surface resistivity and
hydrogeological data. Journal of African Earth Sciences,
35, 433–443.
Egboka, B. C. E., & Okpoko, E. I. (1984). Gully erosion in the
Agulu-Nanka region of Anambra State, Nigeria. Changes in
African Hydrology and Water Resources (Proceedings of the
Harare Symposium, July 1984). IAHS Publication No 144.
Egboka, B. C., & Uma, K. O. (1986). Hydrogeochemistry, con-
taminant transport and Tectonic effects in the Okposi-Uburu
salt lake area of Imo state, Nigeria. Hydrological Science
Journal, 31(2), 205–221.
Ekwueme, B. N., Nyong, E. E., & Petters, S. W. (1995).
Geological excursion guide book to Oban Massif.
Southeastern Nigeria: Calabar Flank and Mamfe
Embayment.
Eseme, E., Agyingi, C. M., & Foba-Tendo, J. (2002).
Geochemistry and genesis of brine emanations from
Cretaceous strata of the Mamfe Basin, Cameroon. Journal
of African Earth Sciences, 35, 467–476.
Ezzy, T. R., Cox, M., O’Rourke, A. J., & Huftile, G. (2006).
Groundwater flow modeling within a coastal alluvial plain
setting using a high-resolution hydrofacies approach: Bells
Creek plain, Australia. Hydrogeology Journal, 14, 675–688.
Foster, S. (1987). Fundamental concepts in aquifer vulnerability,
pollution risk and protection strategy. In W. Van
Duijvenbooden & H. G. Van-Waegeningh (Eds.),
Vulnerability of soil and groundwater to pollutants (pp. 69–
86). The Hague: Hydrological Research.
Foster, S. S. D., Hirata, R., Gomes, D., D'Elia, M., & Paris, M.
(2002). Groundwater quality protection: a guide for water
utilities, municipal authorities and environment agencies
(secondth ed.). Washington, DC: World Bank.
Fraga, C. M., Fernandes, L. F. S., Pacheco, F. A. L., Reis, C., &
Moura, J. P. (2013). Exploratory assessment of groundwater
vulnerability to pollution in the Sordo River Basin, Northeast
of Portugal. REM: R. Esc. Minas, Ouro Preto, 66(1), 49–58.
Freeze, R. A., & Cherry, J. A. (1979). Groundwater. Englewood
Cliffs. New Jersey: Prentice-Hall Inc. 604 p.
Gemail, K. S., El-Shishtawy, A. M., El-Alfy, M., Ghoneim, M. F.,
& Abd El-Bary, M. (2011). Assessment of aquifer vulnera-
bility to industrial waste water using resistivity measure-
ments. A case study along El-Gharbyia main drain, Nile
Delta, Egypt. Journal of Applied Geophysics, 75, 140–150.
Gogu, R. C., & Dassargues, A. (2000). Current trends and future
challenges in groundwater vulnerability assessment using
overlay and index methods. Environmental Geology, 39,
549–559.
Henriet, J. P. (1976). Direct applications of the Dar Zarrouk
parameters in ground water surveys. Geophysical
Prospecting, 24, 344–353.
Jassim, F. A., & Altaany, F. A. (2013). Image interpolation using
Kriging technique for spatial data. Canadian Journal on
Image Processing and Computer Vision, 4(2), 16–21.
Javadi, S., Kavehkar, N., Mousavizadeh, M. H., & Mohammadi,
K. (2011). Modification of DRASTIC model to map ground-
water vulnerability to pollution using nitrate measurements in
agricultural areas. Journal of Agricultural Science and
Technology, 13(2), 239–249.
Keller, G. V., & Frischknecht, F. C. (1966). Electrical methods in
geophysical prospecting. Oxford: Pergamon Press. 519 p.
Kirsch, R., Sengpiel, K., & Voss, W. (2003). The use of electrical
conductivity mapping in the definition of an aquifer vulner-
ability index. Near Surface Geophysics, 1, 3–20.
Kirsch, R. (2006). Groundwater geophysics: a tool for hydrogeol-
ogy. Springer-Verlag Berlin Hendelberg. 493p.
Leone, A., Ripa, M. N., Uricchio, V., Dek, L., & Vargay, Z. (2009).
Vulnerability and risk evaluation of agricultural nitrogen
pollution for Hungary’s main aquifer using DRASTIC and
GLEAMS models. Journal of Environmental Management,
90(10), 2969–2978.
Loke, M. H., & Barker, R. D. (1996). Practical techniques for rapid
least-squares inversion of apparent resistivity pseudosections
using a quasi-Newton method. Geophysical Prospecting, 44,
131–152.
Loke, M. H., Acworth, I., & Dahlin, T. (2003). A comparison of
smooth and blocky inversion methods in 2D electrical imag-
ing surveys. Exploration Geophysics, 34, 182–187.
Maillet, R. (1947). The fundamental equations of electric
prospecting. Geophysics 12, 529–556.
Mhomho Technologies & Environmental Services Ltd (2013).
Drilling, construction of a one unit motorised water supply
borehole and water quality analyses in Agbara-Ekureku. A
Technical Report No. 123, pp. 23.
Murat, R. C. (1972). Stratigraphy and Paleogeography of the
cretaceous and lower tertiary in southern Nigeria. In T. F. J.
Dessauvagie & A. J. Whiteman (Eds.), African geology (pp.
251–266). Ibadan: Univ. Press, Ibadan.
Neshat, A., Pradhan, B., Pirasteh, S., & Shafri, H. Z. M. (2013).
Estimating groundwater vulnerability to pollution using a
modified DRASTIC model in the Kerman agricultural area,
Iran. Environmental Earth Sciences. doi:10.1007/s12665-
013-2690-7.
Niwas, S., & Singhal, D. C. (1981). Estimation of aquifer trans-
missivity from Dar Zarrouck parameters in porous media.
Journal of Hydrology, 50, 393–399.
Odigi, M. I., & Amajor, L. C. (2009). Geochemical characteriza-
tion of Cretaceous sandstones from the Southern Benue
Trough, Nigeria. Chinese Journal of Geochemistry, 28,
044–054.
Offodile, M. E. (1975). A review of the geology and Cretaceous of
the Benue Valley. In C. A. Kogbe (Ed.), Geology of Nigeria
(pp. 375–376). Lagos: Elizabethen Press.
Okereke, C. S., Esu, E. O., & Edet, A. E. (1998). Determination of
potential groundwater sites using geological and geophysical
techniques in the Cross River State, southeastern Nigeria.
Journal of African Earth Sciences, 27(1), 149–163.
Okiongbo, K. S., & Akpofure, E. (2012). Determination of aquifer
properties and groundwater vulnerability mapping using
Environ Monit Assess (2015) 187: 156 Page 17 of 18 156
geoelectric method in Yenagoa City and its environs in
Bayelsa State, South South Nigeria. Journal of Water
Resource and Protection, 4, 354–362.
Olayinka, A. I., & Yaramanci, U. (2000). Assessment of the
reliability of 2D inversion of apparent resistivity data.
Geophysical Prospecting, 48(2), 293–316.
Onwualu, J. N., Ukaegbu, V. U., & Okengwu, K. O. (2012).
Source region inhomogeneity in igneous suite of Ishiagu,
Southern Benue Trough, Nigeria. Archives of Applied
Science Research, 4(2), 923–934.
Orellana, E., & Mooney, A. M. (1966). Master curve and tables
for vertical electrical sounding over layered structures.
Escuela, Spain: Interciencia.
Perles Roselló, M. J., Vías Martínez, J. M., & Andreo Navarro, B.
(2009). Vulnerability of human environment to risk: case of
groundwater contamination risk. Environment International,
3, 325–335.
Petters, S. W. (1989). A regional hydrogeological study of rural
water supply options for planning and implementation of
phase II rural water programme in Cross River State.
Unpublished Technical Report submitted to DFFRI, Cross
River State, pp 97.
Raju, N. J., & Reddy, T. V. K. (1998). Fracture pattern and
electrical resistivity studies for groundwater exploration.
Environmental Geology, 34(2–3), 175–182.
Reijers, T. J. A., & Nwajide, C. S., (1998). Geology of the
Southern Anambra Basin. Unpublished Report for Chevron
Nigeria Limited, Anambra Basin Field Course, p. 66.
Rijkswaterstaat, (1969). Standard Graphs for Resistivity
Prospecting, European Association of Exploration
Geophysicists, The Netherlands, The Hague.
Sharma, S. P., & Baranwal, V. C. (2005). Delineation of
groundwater-bearing fracture zones in a hard rock integrating
very low frequency electromagnetic and resistivity data.
Journal of Applied Geophysics, 57, 155–166.
Sinkevich, M. G., Walter, M. T., Lembo, A. J., Jr., Richards, B. K.,
Peranginangin, N., Aburime, S. A., & Steenhuis, T. S.
(2005). A GIS-based ground water contamination risk as-
sessment tool for pesticides. Ground Water Monitoring &
Remediation, 25(4), 82–91.
Sorensen, K. I., Auken, E., Christensen, N., & Pellerin, L. (2005).
An integrated approach for hydrogeophysical investigations:
new technologies and a case history. In D. K. Bulter (Ed.),
Near-surface Geophysics (pp. 585–597). Tulsa: Society of
Exploration Geophysicists.
Ukaegbu, V. U., & Akpabio, I. O. (2009). Geology and stratigra-
phy of middle cretaceous sequences Northeast of Afikpo
Basin, Lower Benue Trough, Nigeria. Pacific Journal of
Science and Technology, 103, 518–256.
Van Beers, W. C. M., & Kleijnen, J. P. C. (2003). Kriging for
interpolation in random simulation. Journal of Operational
Research Society, 54, 255–262.
Van Stempvoort, D., Ewert, L., & Wassenaar, L. A. (1992). A
method for groundwater protection mapping in the Prairie
Provinces of Canada, Canada, PPWB Report No. 114.
Saskatoon: National Hydreogeology Research Institute.
Vender Velpen, B. P. A. (1988). A computer processing package
for D.C. Resistivity interpretation for an IBM compatibles,
ITC JouR, Natherlands Vol-4.
Vrba, J., & Zaporozec, A. (1994). Guidebook on mapping ground-
water vulnerability. Verlag Heinz Heise, Hannover, Germany,
International contributions to hydrogeology, 16, p 131.
Waskom, R. M. (1994). Best management practices for nitrogen
fertilization. Bulletin #XCM-172, University Cooperative
Extension, Colorado State University.
Wilkinson, P. B., Meldrum, P. I., Kuras, O., Chambers, J. E.,
Holyoake, S. J., & Ogilvy, R. D. (2010). High-resolution
electrical resistivity tomography monitoring of a tracer test
in a confined aquifer. Journal of Applied Geophysics, 70,
268–276.
Yadav, G. S., & Singh, S. K. (2007). Integrated resistivity surveys
for delineation of fractures for ground water exploration in
hard rock areas. Journal of Applied Geophysics, 62(3), 301–
312.
Yadav, S. N., & Wall, D. B. (1998). Benefit-cost analysis of best
management practices implemented to control nitrate con-
tamination of groundwater. Water Resources Research,
34(3), 497–504.
Yin, L., Zhang, E., Wang, X., Wenninger, J., Dong, J., Guo, L., &
Huang, J. (2012). A GIS-based DRASTIC model for
assessing groundwater vulnerability in the Ordos Plateau,
China. Environmental Earth Sciences, 69(1), 171–185.
156 Page 18 of 18 Environ Monit Assess (2015) 187: 156

More Related Content

What's hot

The International Journal of Engineering and Science (The IJES)
The International Journal of Engineering and Science (The IJES)The International Journal of Engineering and Science (The IJES)
The International Journal of Engineering and Science (The IJES)theijes
 
Hidrodinamica Cardoso&motta marques 2009aeco
Hidrodinamica Cardoso&motta marques 2009aecoHidrodinamica Cardoso&motta marques 2009aeco
Hidrodinamica Cardoso&motta marques 2009aecoCaline Gally
 
Assessment of infiltration rate under different drylands types in unter iwes ...
Assessment of infiltration rate under different drylands types in unter iwes ...Assessment of infiltration rate under different drylands types in unter iwes ...
Assessment of infiltration rate under different drylands types in unter iwes ...Alexander Decker
 
THE EFFECT OF GEOTECHNICAL PROPERTIES ON THE BEARING CAPACITY OF SELECTED SOI...
THE EFFECT OF GEOTECHNICAL PROPERTIES ON THE BEARING CAPACITY OF SELECTED SOI...THE EFFECT OF GEOTECHNICAL PROPERTIES ON THE BEARING CAPACITY OF SELECTED SOI...
THE EFFECT OF GEOTECHNICAL PROPERTIES ON THE BEARING CAPACITY OF SELECTED SOI...IAEME Publication
 
Analysis of Microstructural Properties of Pliocene Aquifer in the Benin Forma...
Analysis of Microstructural Properties of Pliocene Aquifer in the Benin Forma...Analysis of Microstructural Properties of Pliocene Aquifer in the Benin Forma...
Analysis of Microstructural Properties of Pliocene Aquifer in the Benin Forma...IOSR Journals
 
11.[40 51]correlates in groundwater quality parameters and textural classes o...
11.[40 51]correlates in groundwater quality parameters and textural classes o...11.[40 51]correlates in groundwater quality parameters and textural classes o...
11.[40 51]correlates in groundwater quality parameters and textural classes o...Alexander Decker
 
Initial core descript teachers
Initial core descript teachersInitial core descript teachers
Initial core descript teachersUmassGeo
 
An Integrative Decision Support System for Managing Water Resources under Inc...
An Integrative Decision Support System for Managing Water Resources under Inc...An Integrative Decision Support System for Managing Water Resources under Inc...
An Integrative Decision Support System for Managing Water Resources under Inc...National Institute of Food and Agriculture
 
The role of site investigation
The role of site investigationThe role of site investigation
The role of site investigationAngelo Indelicato
 
Evaluation of physico chemical quality of water stored in underground reinfor...
Evaluation of physico chemical quality of water stored in underground reinfor...Evaluation of physico chemical quality of water stored in underground reinfor...
Evaluation of physico chemical quality of water stored in underground reinfor...IAEME Publication
 
Tank model to see the effect of land use changes on runoff, infiltration and ...
Tank model to see the effect of land use changes on runoff, infiltration and ...Tank model to see the effect of land use changes on runoff, infiltration and ...
Tank model to see the effect of land use changes on runoff, infiltration and ...Alexander Decker
 
Evaluation of Heterogeneous Aquifers in Crystalline Rocks from Resistivity So...
Evaluation of Heterogeneous Aquifers in Crystalline Rocks from Resistivity So...Evaluation of Heterogeneous Aquifers in Crystalline Rocks from Resistivity So...
Evaluation of Heterogeneous Aquifers in Crystalline Rocks from Resistivity So...theijes
 

What's hot (20)

The International Journal of Engineering and Science (The IJES)
The International Journal of Engineering and Science (The IJES)The International Journal of Engineering and Science (The IJES)
The International Journal of Engineering and Science (The IJES)
 
Hidrodinamica Cardoso&motta marques 2009aeco
Hidrodinamica Cardoso&motta marques 2009aecoHidrodinamica Cardoso&motta marques 2009aeco
Hidrodinamica Cardoso&motta marques 2009aeco
 
Assessment of infiltration rate under different drylands types in unter iwes ...
Assessment of infiltration rate under different drylands types in unter iwes ...Assessment of infiltration rate under different drylands types in unter iwes ...
Assessment of infiltration rate under different drylands types in unter iwes ...
 
THE EFFECT OF GEOTECHNICAL PROPERTIES ON THE BEARING CAPACITY OF SELECTED SOI...
THE EFFECT OF GEOTECHNICAL PROPERTIES ON THE BEARING CAPACITY OF SELECTED SOI...THE EFFECT OF GEOTECHNICAL PROPERTIES ON THE BEARING CAPACITY OF SELECTED SOI...
THE EFFECT OF GEOTECHNICAL PROPERTIES ON THE BEARING CAPACITY OF SELECTED SOI...
 
Hp2002
Hp2002Hp2002
Hp2002
 
Analysis of Microstructural Properties of Pliocene Aquifer in the Benin Forma...
Analysis of Microstructural Properties of Pliocene Aquifer in the Benin Forma...Analysis of Microstructural Properties of Pliocene Aquifer in the Benin Forma...
Analysis of Microstructural Properties of Pliocene Aquifer in the Benin Forma...
 
20320140503012
2032014050301220320140503012
20320140503012
 
Structure Index
Structure IndexStructure Index
Structure Index
 
11.[40 51]correlates in groundwater quality parameters and textural classes o...
11.[40 51]correlates in groundwater quality parameters and textural classes o...11.[40 51]correlates in groundwater quality parameters and textural classes o...
11.[40 51]correlates in groundwater quality parameters and textural classes o...
 
Initial core descript teachers
Initial core descript teachersInitial core descript teachers
Initial core descript teachers
 
Nl 59-17-(15)d-509
Nl 59-17-(15)d-509Nl 59-17-(15)d-509
Nl 59-17-(15)d-509
 
Ijciet 10 02_097
Ijciet 10 02_097Ijciet 10 02_097
Ijciet 10 02_097
 
An Integrative Decision Support System for Managing Water Resources under Inc...
An Integrative Decision Support System for Managing Water Resources under Inc...An Integrative Decision Support System for Managing Water Resources under Inc...
An Integrative Decision Support System for Managing Water Resources under Inc...
 
The role of site investigation
The role of site investigationThe role of site investigation
The role of site investigation
 
Initial Core Descriptions
Initial Core DescriptionsInitial Core Descriptions
Initial Core Descriptions
 
attachment(5)[1]
attachment(5)[1]attachment(5)[1]
attachment(5)[1]
 
Evaluation of physico chemical quality of water stored in underground reinfor...
Evaluation of physico chemical quality of water stored in underground reinfor...Evaluation of physico chemical quality of water stored in underground reinfor...
Evaluation of physico chemical quality of water stored in underground reinfor...
 
Tank model to see the effect of land use changes on runoff, infiltration and ...
Tank model to see the effect of land use changes on runoff, infiltration and ...Tank model to see the effect of land use changes on runoff, infiltration and ...
Tank model to see the effect of land use changes on runoff, infiltration and ...
 
Evaluation of Heterogeneous Aquifers in Crystalline Rocks from Resistivity So...
Evaluation of Heterogeneous Aquifers in Crystalline Rocks from Resistivity So...Evaluation of Heterogeneous Aquifers in Crystalline Rocks from Resistivity So...
Evaluation of Heterogeneous Aquifers in Crystalline Rocks from Resistivity So...
 
Chapter 3
Chapter 3Chapter 3
Chapter 3
 

Similar to Aquifer polution vulnerability assessment for abi paper

Experimental evaluation of two-layer air bubble curtains to prevent seawater ...
Experimental evaluation of two-layer air bubble curtains to prevent seawater ...Experimental evaluation of two-layer air bubble curtains to prevent seawater ...
Experimental evaluation of two-layer air bubble curtains to prevent seawater ...EhsanKahrizi3
 
Geo Environmental Investigation of Abuad Dumpsite, Southwestern Nigeria
Geo Environmental Investigation of Abuad Dumpsite, Southwestern NigeriaGeo Environmental Investigation of Abuad Dumpsite, Southwestern Nigeria
Geo Environmental Investigation of Abuad Dumpsite, Southwestern NigeriaIJERA Editor
 
Application Of Resistivity For Groundwater, Hydrogeology and Pollution Research
Application Of Resistivity For Groundwater, Hydrogeology and Pollution ResearchApplication Of Resistivity For Groundwater, Hydrogeology and Pollution Research
Application Of Resistivity For Groundwater, Hydrogeology and Pollution ResearchOmokpariolaElshalom
 
Research Inventy : International Journal of Engineering and Science
Research Inventy : International Journal of Engineering and ScienceResearch Inventy : International Journal of Engineering and Science
Research Inventy : International Journal of Engineering and Scienceinventy
 
Simulation of sediment transport to Sawah rice fields by applying the water e...
Simulation of sediment transport to Sawah rice fields by applying the water e...Simulation of sediment transport to Sawah rice fields by applying the water e...
Simulation of sediment transport to Sawah rice fields by applying the water e...Eric Takyi Atakora , Ph.D (candidate)
 
Ecological indicators
Ecological indicatorsEcological indicators
Ecological indicatorsTaha Gorji
 
Journal of Environmental & Earth Sciences | Vol.2, Iss.1 April 2020
Journal of Environmental & Earth Sciences | Vol.2, Iss.1 April 2020Journal of Environmental & Earth Sciences | Vol.2, Iss.1 April 2020
Journal of Environmental & Earth Sciences | Vol.2, Iss.1 April 2020Bilingual Publishing Group
 
Combined Geophysical And Geotechnical Techniques For Assessment Of Foundation...
Combined Geophysical And Geotechnical Techniques For Assessment Of Foundation...Combined Geophysical And Geotechnical Techniques For Assessment Of Foundation...
Combined Geophysical And Geotechnical Techniques For Assessment Of Foundation...IRJESJOURNAL
 
NIFA-BARD Collaborative: Rapid Hydrophobicity Sensing and Computing through M...
NIFA-BARD Collaborative: Rapid Hydrophobicity Sensing and Computing through M...NIFA-BARD Collaborative: Rapid Hydrophobicity Sensing and Computing through M...
NIFA-BARD Collaborative: Rapid Hydrophobicity Sensing and Computing through M...National Institute of Food and Agriculture
 
H03503045055
H03503045055H03503045055
H03503045055theijes
 

Similar to Aquifer polution vulnerability assessment for abi paper (20)

Article ebong
Article ebongArticle ebong
Article ebong
 
proposal dadu.pptx
proposal dadu.pptxproposal dadu.pptx
proposal dadu.pptx
 
Ijciet 10 01_014
Ijciet 10 01_014Ijciet 10 01_014
Ijciet 10 01_014
 
A033301010
A033301010A033301010
A033301010
 
Experimental evaluation of two-layer air bubble curtains to prevent seawater ...
Experimental evaluation of two-layer air bubble curtains to prevent seawater ...Experimental evaluation of two-layer air bubble curtains to prevent seawater ...
Experimental evaluation of two-layer air bubble curtains to prevent seawater ...
 
Ikard et al 2013a
Ikard et al 2013aIkard et al 2013a
Ikard et al 2013a
 
Geo Environmental Investigation of Abuad Dumpsite, Southwestern Nigeria
Geo Environmental Investigation of Abuad Dumpsite, Southwestern NigeriaGeo Environmental Investigation of Abuad Dumpsite, Southwestern Nigeria
Geo Environmental Investigation of Abuad Dumpsite, Southwestern Nigeria
 
Application Of Resistivity For Groundwater, Hydrogeology and Pollution Research
Application Of Resistivity For Groundwater, Hydrogeology and Pollution ResearchApplication Of Resistivity For Groundwater, Hydrogeology and Pollution Research
Application Of Resistivity For Groundwater, Hydrogeology and Pollution Research
 
Research Inventy : International Journal of Engineering and Science
Research Inventy : International Journal of Engineering and ScienceResearch Inventy : International Journal of Engineering and Science
Research Inventy : International Journal of Engineering and Science
 
Simulation of sediment transport to Sawah rice fields by applying the water e...
Simulation of sediment transport to Sawah rice fields by applying the water e...Simulation of sediment transport to Sawah rice fields by applying the water e...
Simulation of sediment transport to Sawah rice fields by applying the water e...
 
Ecological indicators
Ecological indicatorsEcological indicators
Ecological indicators
 
M.Sc. Thesis Published
M.Sc. Thesis PublishedM.Sc. Thesis Published
M.Sc. Thesis Published
 
Ijetr042178
Ijetr042178Ijetr042178
Ijetr042178
 
Go2511931200
Go2511931200Go2511931200
Go2511931200
 
Go2511931200
Go2511931200Go2511931200
Go2511931200
 
Journal of Environmental & Earth Sciences | Vol.2, Iss.1 April 2020
Journal of Environmental & Earth Sciences | Vol.2, Iss.1 April 2020Journal of Environmental & Earth Sciences | Vol.2, Iss.1 April 2020
Journal of Environmental & Earth Sciences | Vol.2, Iss.1 April 2020
 
Combined Geophysical And Geotechnical Techniques For Assessment Of Foundation...
Combined Geophysical And Geotechnical Techniques For Assessment Of Foundation...Combined Geophysical And Geotechnical Techniques For Assessment Of Foundation...
Combined Geophysical And Geotechnical Techniques For Assessment Of Foundation...
 
Ijciet 06 10_004
Ijciet 06 10_004Ijciet 06 10_004
Ijciet 06 10_004
 
NIFA-BARD Collaborative: Rapid Hydrophobicity Sensing and Computing through M...
NIFA-BARD Collaborative: Rapid Hydrophobicity Sensing and Computing through M...NIFA-BARD Collaborative: Rapid Hydrophobicity Sensing and Computing through M...
NIFA-BARD Collaborative: Rapid Hydrophobicity Sensing and Computing through M...
 
H03503045055
H03503045055H03503045055
H03503045055
 

Recently uploaded

VIP Call Girls Service Chaitanyapuri Hyderabad Call +91-8250192130
VIP Call Girls Service Chaitanyapuri Hyderabad Call +91-8250192130VIP Call Girls Service Chaitanyapuri Hyderabad Call +91-8250192130
VIP Call Girls Service Chaitanyapuri Hyderabad Call +91-8250192130Suhani Kapoor
 
Mumbai Call Girls, 💞 Prity 9892124323, Navi Mumbai Call girls
Mumbai Call Girls, 💞  Prity 9892124323, Navi Mumbai Call girlsMumbai Call Girls, 💞  Prity 9892124323, Navi Mumbai Call girls
Mumbai Call Girls, 💞 Prity 9892124323, Navi Mumbai Call girlsPooja Nehwal
 
webinaire-green-mirror-episode-2-Smart contracts and virtual purchase agreeme...
webinaire-green-mirror-episode-2-Smart contracts and virtual purchase agreeme...webinaire-green-mirror-episode-2-Smart contracts and virtual purchase agreeme...
webinaire-green-mirror-episode-2-Smart contracts and virtual purchase agreeme...Cluster TWEED
 
Sustainable Clothing Strategies and Challenges
Sustainable Clothing Strategies and ChallengesSustainable Clothing Strategies and Challenges
Sustainable Clothing Strategies and ChallengesDr. Salem Baidas
 
See How do animals kill their prey for food
See How do animals kill their prey for foodSee How do animals kill their prey for food
See How do animals kill their prey for fooddrsk203
 
VIP Call Girl Gorakhpur Aashi 8250192130 Independent Escort Service Gorakhpur
VIP Call Girl Gorakhpur Aashi 8250192130 Independent Escort Service GorakhpurVIP Call Girl Gorakhpur Aashi 8250192130 Independent Escort Service Gorakhpur
VIP Call Girl Gorakhpur Aashi 8250192130 Independent Escort Service GorakhpurSuhani Kapoor
 
Determination of antibacterial activity of various broad spectrum antibiotics...
Determination of antibacterial activity of various broad spectrum antibiotics...Determination of antibacterial activity of various broad spectrum antibiotics...
Determination of antibacterial activity of various broad spectrum antibiotics...Open Access Research Paper
 
ENVIRONMENTAL LAW ppt on laws of environmental law
ENVIRONMENTAL LAW ppt on laws of environmental lawENVIRONMENTAL LAW ppt on laws of environmental law
ENVIRONMENTAL LAW ppt on laws of environmental lawnitinraj1000000
 
(ZARA) Call Girls Talegaon Dabhade ( 7001035870 ) HI-Fi Pune Escorts Service
(ZARA) Call Girls Talegaon Dabhade ( 7001035870 ) HI-Fi Pune Escorts Service(ZARA) Call Girls Talegaon Dabhade ( 7001035870 ) HI-Fi Pune Escorts Service
(ZARA) Call Girls Talegaon Dabhade ( 7001035870 ) HI-Fi Pune Escorts Serviceranjana rawat
 
(ANIKA) Call Girls Wagholi ( 7001035870 ) HI-Fi Pune Escorts Service
(ANIKA) Call Girls Wagholi ( 7001035870 ) HI-Fi Pune Escorts Service(ANIKA) Call Girls Wagholi ( 7001035870 ) HI-Fi Pune Escorts Service
(ANIKA) Call Girls Wagholi ( 7001035870 ) HI-Fi Pune Escorts Serviceranjana rawat
 
VIP Call Girls Service Bandlaguda Hyderabad Call +91-8250192130
VIP Call Girls Service Bandlaguda Hyderabad Call +91-8250192130VIP Call Girls Service Bandlaguda Hyderabad Call +91-8250192130
VIP Call Girls Service Bandlaguda Hyderabad Call +91-8250192130Suhani Kapoor
 
(RIYA) Kalyani Nagar Call Girls Just Call 7001035870 [ Cash on Delivery ] Pun...
(RIYA) Kalyani Nagar Call Girls Just Call 7001035870 [ Cash on Delivery ] Pun...(RIYA) Kalyani Nagar Call Girls Just Call 7001035870 [ Cash on Delivery ] Pun...
(RIYA) Kalyani Nagar Call Girls Just Call 7001035870 [ Cash on Delivery ] Pun...ranjana rawat
 
VIP Call Girls Mahadevpur Colony ( Hyderabad ) Phone 8250192130 | ₹5k To 25k ...
VIP Call Girls Mahadevpur Colony ( Hyderabad ) Phone 8250192130 | ₹5k To 25k ...VIP Call Girls Mahadevpur Colony ( Hyderabad ) Phone 8250192130 | ₹5k To 25k ...
VIP Call Girls Mahadevpur Colony ( Hyderabad ) Phone 8250192130 | ₹5k To 25k ...Suhani Kapoor
 
Hi FI Call Girl Ahmedabad 7397865700 Independent Call Girls
Hi FI Call Girl Ahmedabad 7397865700 Independent Call GirlsHi FI Call Girl Ahmedabad 7397865700 Independent Call Girls
Hi FI Call Girl Ahmedabad 7397865700 Independent Call Girlsssuser7cb4ff
 

Recently uploaded (20)

Model Call Girl in Rajiv Chowk Delhi reach out to us at 🔝9953056974🔝
Model Call Girl in Rajiv Chowk Delhi reach out to us at 🔝9953056974🔝Model Call Girl in Rajiv Chowk Delhi reach out to us at 🔝9953056974🔝
Model Call Girl in Rajiv Chowk Delhi reach out to us at 🔝9953056974🔝
 
Call Girls In R.K. Puram 9953056974 Escorts ServiCe In Delhi Ncr
Call Girls In R.K. Puram 9953056974 Escorts ServiCe In Delhi NcrCall Girls In R.K. Puram 9953056974 Escorts ServiCe In Delhi Ncr
Call Girls In R.K. Puram 9953056974 Escorts ServiCe In Delhi Ncr
 
VIP Call Girls Service Chaitanyapuri Hyderabad Call +91-8250192130
VIP Call Girls Service Chaitanyapuri Hyderabad Call +91-8250192130VIP Call Girls Service Chaitanyapuri Hyderabad Call +91-8250192130
VIP Call Girls Service Chaitanyapuri Hyderabad Call +91-8250192130
 
Mumbai Call Girls, 💞 Prity 9892124323, Navi Mumbai Call girls
Mumbai Call Girls, 💞  Prity 9892124323, Navi Mumbai Call girlsMumbai Call Girls, 💞  Prity 9892124323, Navi Mumbai Call girls
Mumbai Call Girls, 💞 Prity 9892124323, Navi Mumbai Call girls
 
webinaire-green-mirror-episode-2-Smart contracts and virtual purchase agreeme...
webinaire-green-mirror-episode-2-Smart contracts and virtual purchase agreeme...webinaire-green-mirror-episode-2-Smart contracts and virtual purchase agreeme...
webinaire-green-mirror-episode-2-Smart contracts and virtual purchase agreeme...
 
Sustainable Clothing Strategies and Challenges
Sustainable Clothing Strategies and ChallengesSustainable Clothing Strategies and Challenges
Sustainable Clothing Strategies and Challenges
 
See How do animals kill their prey for food
See How do animals kill their prey for foodSee How do animals kill their prey for food
See How do animals kill their prey for food
 
VIP Call Girl Gorakhpur Aashi 8250192130 Independent Escort Service Gorakhpur
VIP Call Girl Gorakhpur Aashi 8250192130 Independent Escort Service GorakhpurVIP Call Girl Gorakhpur Aashi 8250192130 Independent Escort Service Gorakhpur
VIP Call Girl Gorakhpur Aashi 8250192130 Independent Escort Service Gorakhpur
 
Determination of antibacterial activity of various broad spectrum antibiotics...
Determination of antibacterial activity of various broad spectrum antibiotics...Determination of antibacterial activity of various broad spectrum antibiotics...
Determination of antibacterial activity of various broad spectrum antibiotics...
 
ENVIRONMENTAL LAW ppt on laws of environmental law
ENVIRONMENTAL LAW ppt on laws of environmental lawENVIRONMENTAL LAW ppt on laws of environmental law
ENVIRONMENTAL LAW ppt on laws of environmental law
 
Gandhi Nagar (Delhi) 9953330565 Escorts, Call Girls Services
Gandhi Nagar (Delhi) 9953330565 Escorts, Call Girls ServicesGandhi Nagar (Delhi) 9953330565 Escorts, Call Girls Services
Gandhi Nagar (Delhi) 9953330565 Escorts, Call Girls Services
 
(ZARA) Call Girls Talegaon Dabhade ( 7001035870 ) HI-Fi Pune Escorts Service
(ZARA) Call Girls Talegaon Dabhade ( 7001035870 ) HI-Fi Pune Escorts Service(ZARA) Call Girls Talegaon Dabhade ( 7001035870 ) HI-Fi Pune Escorts Service
(ZARA) Call Girls Talegaon Dabhade ( 7001035870 ) HI-Fi Pune Escorts Service
 
(ANIKA) Call Girls Wagholi ( 7001035870 ) HI-Fi Pune Escorts Service
(ANIKA) Call Girls Wagholi ( 7001035870 ) HI-Fi Pune Escorts Service(ANIKA) Call Girls Wagholi ( 7001035870 ) HI-Fi Pune Escorts Service
(ANIKA) Call Girls Wagholi ( 7001035870 ) HI-Fi Pune Escorts Service
 
Green Banking
Green Banking Green Banking
Green Banking
 
VIP Call Girls Service Bandlaguda Hyderabad Call +91-8250192130
VIP Call Girls Service Bandlaguda Hyderabad Call +91-8250192130VIP Call Girls Service Bandlaguda Hyderabad Call +91-8250192130
VIP Call Girls Service Bandlaguda Hyderabad Call +91-8250192130
 
Sexy Call Girls Patel Nagar New Delhi +918448380779 Call Girls Service in Del...
Sexy Call Girls Patel Nagar New Delhi +918448380779 Call Girls Service in Del...Sexy Call Girls Patel Nagar New Delhi +918448380779 Call Girls Service in Del...
Sexy Call Girls Patel Nagar New Delhi +918448380779 Call Girls Service in Del...
 
(RIYA) Kalyani Nagar Call Girls Just Call 7001035870 [ Cash on Delivery ] Pun...
(RIYA) Kalyani Nagar Call Girls Just Call 7001035870 [ Cash on Delivery ] Pun...(RIYA) Kalyani Nagar Call Girls Just Call 7001035870 [ Cash on Delivery ] Pun...
(RIYA) Kalyani Nagar Call Girls Just Call 7001035870 [ Cash on Delivery ] Pun...
 
Hot Sexy call girls in Nehru Place, 🔝 9953056974 🔝 escort Service
Hot Sexy call girls in Nehru Place, 🔝 9953056974 🔝 escort ServiceHot Sexy call girls in Nehru Place, 🔝 9953056974 🔝 escort Service
Hot Sexy call girls in Nehru Place, 🔝 9953056974 🔝 escort Service
 
VIP Call Girls Mahadevpur Colony ( Hyderabad ) Phone 8250192130 | ₹5k To 25k ...
VIP Call Girls Mahadevpur Colony ( Hyderabad ) Phone 8250192130 | ₹5k To 25k ...VIP Call Girls Mahadevpur Colony ( Hyderabad ) Phone 8250192130 | ₹5k To 25k ...
VIP Call Girls Mahadevpur Colony ( Hyderabad ) Phone 8250192130 | ₹5k To 25k ...
 
Hi FI Call Girl Ahmedabad 7397865700 Independent Call Girls
Hi FI Call Girl Ahmedabad 7397865700 Independent Call GirlsHi FI Call Girl Ahmedabad 7397865700 Independent Call Girls
Hi FI Call Girl Ahmedabad 7397865700 Independent Call Girls
 

Aquifer polution vulnerability assessment for abi paper

  • 1. Exploratory assessment of groundwater vulnerability to pollution in Abi, southeastern Nigeria, using geophysical and geological techniques Anthony E. Akpan & Ebong D. Ebong & Chimezie N. Emeka Received: 16 March 2014 /Accepted: 17 February 2015 /Published online: 4 March 2015 # Springer International Publishing Switzerland 2015 Abstract The geophysical-based integrated electrical conductivity (IEC) and the groundwater hydraulic con- finement–overlying strata–depth to water table (GOD) techniques were used to assess vulnerability levels of aquifers and the extent of aquifer protection in Abi, Nigeria. The IEC indices was generated from constrained one dimensional (1D) inversion of vertical electrical sounding (VES) and two dimensional (2D) electrical resistivity tomography (ERT) data, acquired randomly in the area. The GOD indices were sourced from existing geologic data within the area. Results showed that IEC values vary from <0.1 S in the weakly protected areas to >2.0 S in the strongly protected areas. The GOD indices vary from <0.3 in the lowly vulnera- ble areas to 0.6 in the highly vulnerable areas. Thus, the groundwater resources in the area need to be properly managed for sustainability and such management prac- tices have been suggested. Keywords Electrical resistivity. Contamination . Vulnerability. IEC . GOD . Abi, Nigeria Introduction The groundwater resource in the central parts of Cross River State in Nigeria is the only source of potable water for domestic and other uses especially in the dry season when majority of the surface water resources usually dry up. Generalised studies have continued to capture the groundwater system within the area as being capable of producing potable water that can satisfy the water needs of the people (Edet and Okereke 2002; Akpan et al. 2013). Recently, anthropogenic contaminants are chal- lenging the potable status of the groundwater resource in many parts of Abi. Most of these contaminants are of human origin from faeces while others originate from micro- and macro-industrial waste and modern practices of soil productivity enhancement by farmers who dom- inate the entire population of the area (Akpan et al. 2013). Considering the intricate nature of vertical water flow and contaminant transport, faeces from unsewered sanitary facilities, find their way as Faecal Coliform in groundwater. The process through which this occurs, involves the colloidal suspension of faecal materials with water driven by gravity through permeable forma- tions and preferential structures such as pores of the lenticular porous sandy or silty materials, fractures and joints which are predominant pathways of groundwater transport in the area (Akpan et al. 2013; Ebong et al. 2014).Values of Faecal and Total Coliform of the range 9.2–19.0 and 20–45 per 100 ml of water respectively has been observed in some communities within the study area (Mhomho Technologies & Environmental Services Ltd 2013; Ebong 2014). Other media through Environ Monit Assess (2015) 187: 156 DOI 10.1007/s10661-015-4380-2 A. E. Akpan (*) :E. D. Ebong Applied Geophysics Programme, University of Calabar, PMB 1115, Calabar, Nigeria e-mail: anthonyakpan@yahoo.com A. E. Akpan e-mail: anthonyakpan@unical.edu.ng C. N. Emeka Department of Geology, University of Calabar, PMB 1115, Calabar, Nigeria
  • 2. which contaminants can be transported to the aquifer horizons by natural processes includes; advection, dif- fusion and dispersion (Ezzy et al. 2006). The rate and quantity of contaminants that can be discharged into the aquifer horizon depend on the hydraulic conductivity (or permeability) of the vadose zone materials, depth to water table, groundwater recharge and groundwater flow media (Foster et al. 2002) Studies have shown that aquifer systems overlain by thin and porous materials, lack adequate protection and are susceptible to contam- ination (Okiongbo and Akpofure 2012). In such areas, the pores of the sandy or silty materials may serve as pathways through which contaminants are transported to the aquifer, since they are not optimally equipped with the capacity to resist the continuous downward movement of the contaminants (Sorensen et al. 2005). Conversely, thick impermeable clay aquitards have the capacity to strongly resist such movements and can thus offer sufficient protection to the aquifer (Braga et al. 2006; Gemail et al. 2011). In the study area, environmentalists are currently expressing concerns over remediation cost; the eventual results in the event of full-blown contamination and the difficulty of controlling the adverse effects of such con- tamination since majority of water users are tapping water from the same source (i.e. aquifer) sometimes at very shallow depths of ~25 m. These shallow aquifers are localised and heterogeneous due to the blocking of groundwater flow paths by sandstone hills (Akpan et al. 2013). In most communities, tectonically induced inter- connected fractures within shaly materials that lack high filtering capacity as their sandy counterparts are the only channels of water circulation (Okereke et al. 1998; Raju and Reddy 1998; Akpan et al. 2013; Ebong et al. 2014). The circulations of water within these fractured aquifers are localised (Akpan et al. 2013) hence, will require site- specific investigations. Such investigations are neces- sary in order to, not only gain insight into the level of aquifer protection but also assess the potability status of the aquifers. Information generated from such investi- gations are useful in maintaining the quality status of the aquifers as well as management of the groundwater resources (Ezzy et al. 2006). Good understanding of the spatial distribution of the lithological properties and thicknesses of the overlying vadose zone materials can be used in assessing the vulnerability of aquifers. Since the various overlying lithological materials have different physical character- istics, geophysical techniques such as the electrical resistivity, seismic refraction and ground penetration radar can be used to map the distribution and spatial spread of these materials. These methods are known to be economical and less time-consuming (Ebong et al. 2014). The electrical resistivity technique can be used to infer the distribution of shallow lithological materials from the variations in resistivity of such materials, since impermeable argillite-dominated lithologic unit are characterised by low resistivity values in contrast to arenite-dominated lithologic units that will be more resistive (Gemail et al. 2011). The aquifers in most parts are very shallow and highly vulnerable to contamination especially in areas overlain by arenaceous materials. This study is aimed at using electrical resistivity infor- mation and geological data to 1. assess the level of protection that the fractured and sandy aquifers in Abi area are current enjoying 2. assess their levels of vulnerability to contamination 3. generate aquifer vulnerability map for the area 4. suggest measures for efficient management and sus- tenance of groundwater quality. Hence, this pilot investigation will provide a frame- work for planning and controlling of human activities on the land surface within the area. Aquifer vulnerability assessment Aquifer vulnerability assessment seeks to quantify the sensitivity of an aquifer system to groundwater degra- dation due to human activities. It is an intrinsic property of the groundwater system that depends on the sensitiv- ity of the system to the human influence on the surface and/or natural events (Vrba and Zaporozec 1994; Almasri 2008). The vulnerability of groundwater cannot be measured directly; hence, it is a complex function of the hydrogeologic parameters prevalent within the area of interest which can serve as protection to the underly- ing aquifer system or pathways of contaminant transport (Gogu and Dassargues 2000). It could also be assessed from the standpoints of analogue models and parametric systems (Conrad et al. 2002). Arising from the increasing trends in groundwater contamination studies, several techniques have been developed for quantitative assessment of aquifer vulner- ability to contamination by surface, or near surface pollutants (Casas et al. 2008). These techniques use 156 Page 2 of 18 Environ Monit Assess (2015) 187: 156
  • 3. information generated from hydrologic, geophysical and GIS data either in stand-alone basis or in integrated form to assess the vulnerability of aquifer to contamina- tion (Neshat et al. 2013). These techniques include the DRASTIC and its modified varieties that uses seven hydrological parameters in assessing aquifer vulnerabil- ity and environmental deterioration (Aller et al. 1987; Leone et al. 2009; Javadi et al. 2011), the aquifer vul- nerability index (AVI) method (Draoui et al. 2007; Ducci and Sellerino 2012; Fraga et al. 2013; Edet 2014), the IEC (Kirsch et al. 2003; Casas et al. 2008), the groundwater hydraulic confinement–overlying stra- ta–depth to water table (GOD) method (Foster 1987; Foster et al. 2002) and SINTACS (Civita and De Maio 1997; Sinkevich et al. 2005; Yin et al. 2012). The DRAS TIC method is the most widely used in spite of the large amount of hydrogeological data involved. The geophysical-based IEC and the GOD techniques use less number of data but can generate acceptable results thus, making both techniques popular choices for pre- liminary evaluation of aquifer vulnerability (Draoui et al. 2007; Fraga et al. 2013). The IEC and GOD techniques were used in this pilot study. Aquifer vulnerability maps show areas of low and high aquifer vulnerabilities which are vital tools for the construction of groundwater contamination risk maps (Perles Roselló et al. 2009; Kirsch 2006). Generally, the parameters necessary for assessing aquifer vulnerability depend on the hydrogeological characteristics of the vadose zone which may encourage or impede contam- inant transport and on the theory of stratified conductors (Henriet 1976). Since hydrogeologic conditions such as permeability of the vadose zone overlying aquifer sys- tems differ based on geologic settings, the degree of protection offered to the aquifers will definitely vary. Thus, different vulnerability ratings will be assigned to the various aquifers, based on the characteristics of the vadose zone materials (Casas et al. 2008). Many researchers have adopted the AVI technique in assessing the vulnerability of the aquifers to surface contaminants. The AVI approach uses hydraulic resis- tance (HR) to the vertical flow of water through the vadose zone in quantifying aquifer vulnerability (Van Stempvoort et al. 1992). HR can be computed from Eq. (1) as HR ¼ Xn i ¼ 1 hi ki ð1Þ where hi and ki are thickness and hydraulic conductivity of the ith layer above the aquifer respectively. In arena- ceous materials, k values are usually of the range 10−5 – 10−1 m/s and are higher than their argillaceous counter- parts by several orders of magnitude (Freeze and Cheery 1976; Kirsch 2006). Eq. (1) is based on the assumption that each layer is intact and multiple layers are perpen- dicular to the flow direction. In the field, layers are not perfectly intact due to geologic complexities; hence, preferential pathways exist which could alter laboratory measured HR values of geologic materials. Since HR observations depend on the thickness and lithologic composition of the local materials in the vadose zone (Gemail et al. 2011), geophysical techniques such as electrical resistivity can be used to map their spatial distribution (Kirsch 2006). For unconsolidated detrital materials where the bulk resistivity of the protective layer depends on effective porosity and quantity of clay as matrix, effective poros- ity will thus be a dominant factor that controls the value of HR. Conversely, values of HR for clay dominated protective layer will depend on the clay content. Therefore, the magnitude of HR generated from Eq. (1) will be proportional to the clay content of the geologic materials (Kirsch 2006). From Eq. (1), HR has the dimension of time and can be used to estimate the vertical travel time of water from the surface to the top of the aquifer (Van Stempvoort et al. 1992). According to Kirsch (2006), travel time estimates made from the HR approach are usually crude estimates since influenc- ing factors such as hydraulic gradient, diffusion and sorption capacity are ignored in such computations. Based on the dependence of HR on the lithological and physical characteristics of the protective layers, the k term in Eq. (1) can be replaced by the electrical resistivity (ρ) or its inverse, conductivity (σ ¼ 1 ρ) of the layer. By this approach, the observed HR results will be equivalent to the integrated electrical conductivity (IEC) or geophysical-based protective index (GPI) parameter. Thus IEC ¼ Xn i¼1 hi ρi ¼ Xn i¼1 hi  σi ð2Þ IEC can also be used to assess the vulnerability of aquifers to surface contamination (Casas et al. 2008). Ordinarily, the computation of the IEC values is sup- posed to be a simple arithmetic operation provided hi and ρi are available from either quantitative Environ Monit Assess (2015) 187: 156 Page 3 of 18 156
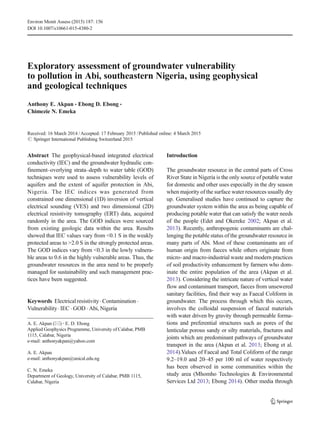
  • 4. interpretation of resistivity sounding, tomographic data or other sources such as wireline logs, time domain electromagnetics and geological data. Since quantitative interpretation of resistivity sounding or tomographic data is usually not possible due to constraints imposed by the problem of equivalence, longitudinal conduc- tance (S) can be used to suppress the associated inter- pretational ambiguities (Casas et al. 2008). According to Maillet (1947) and Niwas and Singhal (1981), the lon- gitudinal conductance, which is one of the Dar Zarrouk parameters is defined as S ¼ Xn i¼1 hi ρi ð3Þ Thus, groundwater circulating in aquifers overlain by thick lowly resistive geologic formation will have stron- ger protection from surface pollutants (Casas et al. 2008; Gemail et al. 2011) and vice versa. The conventional unit of the IEC is the mho (Ω−1 ) otherwise called the siemens (S). The acronym GOD in hydrogeology stands for three dominant contaminant attenuating parameters. The let- ter G expresses the level of groundwater hydraulic con- finement and it measures the extent of hydraulic con- finement of the water circulating within the aquifers. Since the aquifer can be either fully or partially con- fined, the hydraulic confinement parameter apportions varying vulnerability levels to the aquifer. Thus, numer- ical values assigned to G are such that for unconfined and fully confined aquifers, G values lie between 1 and 0. The letter O in the acronym represents the bulk nature of the overlying strata. The O term describes the char- acter of the materials overlying the aquifers with respect to their capacity to impede the flow of contaminants. Values assigned to the O parameter, usually tend to 0 if the vadose zone materials are dominated by impervious argillites such as clays, shales, silty sands and fresh basement rocks such as granite. For arenaceous and other permeable materials such as loose sands, gravels and porous limestone materials, weights assigned to the letter O usually approaches 1. Finally, the letter D in the acronym represents the depth to the groundwater table. This parameter is important in assessing the travel time of the contaminants from the surface or near surface to the aquifer. Weights assigned to the D parameter in- creases as the depth to the groundwater decreases. Since the GOD technique is the product of composite parameters, final vulnerability ratings for different geo- logic materials are as shown in Fig. 1. Physiography of study area Abi LGA (Fig. 2a) is located between latitudes 5.76° N and 6.02° N of the Equator and longitudes 7.93° E and 8.71° E of the Greenwich Meridian in Cross River State, Nigeria (Figs. 2b). Ikwo and Afikpo Local Government Areas (LGAs) in Ebonyi State bound Abi in the north and west respectively. It is bordered in the northeast by Yakurr and Obubra LGAs and bounded in the south by Biase LGA. Two dominant climatic conditions, the wet and dry seasons are common in the area. These condi- tions depict a humid climatic condition with relative humidity of ~80 %, annual precipitation of ~2,200 mm and temperatures dropping to as low as 23 °C in the wet season and rising to ~35 °C in the dry season. The wet season starts in March when moisture-enriched tropical maritime air mass that originates from the Atlantic Ocean blows northward across the area. The air mass usually begins the gradual process of temporal cessation of continuous blowing activity in the area around October which marks the end of the rainy season. Water levels in both the groundwater and surface water resources in the area usually attain maximum elevations above the datum (i.e. mean sea level) in the rainy season. Sudden increase in aridity, ambient temperature and heat usually mark the beginning of the dry season in the month of November and these harsh conditions will persist till March. The beginning of the dry season marks the arrival of the tropical continental air mass that blow southward from the Sahara Desert across the area. Most of the surface water resources usually dry up in the dry season leading to severe water scarcity in the entire area. Hydrogeology The dimension of the southward flowing Cross River which crosses Abi LGA is ~56 km long and ~0.2 km wide. The Cross River and its tributaries drain the entire area (Figs. 2a). Abi is located in the middle course of the river regime where it exhibits a sluggish and meander- ing flow pattern with huge sand deposits at the beaches. Some lakes including the Ijum and Ekpon Azogor Lakes and a few artificial ponds also contributed to the 156 Page 4 of 18 Environ Monit Assess (2015) 187: 156
  • 5. draining of the area. Rainfall is the primary source of recharge for the numerous water resources in the area. The volume of water and the amount of sediments that the Cross River transports across the area is season dependent. The volume of water in the rivers, streams and other surface water resources in the area usually drop to all-seasons low at the peak of the dry season and water flow in the Cross River is normally restricted to narrow channels in the riverbed. During the wet season, there is usually a rapid rise in water levels in the Cross River and its tributaries, probably due to bank filtration, flooding, seepage from ponds and direct infiltration of rainwater most of which forms the bulk of groundwater recharges in the entire area during the season. Evapotranspiration is usually high in most of the elevat- ed areas, thus leaving the groundwater in a predomi- nantly slightly acidic state (Egboka and Okpoko 1984). The slightly acidic groundwater usually seeps out of the hills in the rainy season thereby causing the acidic water to mix with the other water resources in the area. Geology, stratigraphy and tectonics of the study area Abi area is located in the Ikom Mamfe Embayment (IME) in central Cross River State. The IME is located between Latitudes 5°15′ N and 6°30′ N of the Equator and between Longitudes 7°45′ E and 8°45′ E of the Greenwich Meridian and is the NW–SE splay segment of the NE–SW trending Benue Trough. The basin ex- tends laterally into parts of Western Cameroun where it covers an estimated area of ~2016 km2 (Eseme et al. 2002). The IME appears to be a contiguous part of the Lower Benue Trough (LBT) (Ukaegbu and Akpabio 2009) and is bounded in the west by the Abakaliki Anticlinorium, to the east and northeast by the Obudu None Overflowing Unconfined (covered) Unconfined Confined 0.0 0.2 0.4 0.6 Semi-confined 1.0 Lacustrine/ estuarine clays Residual soils Alluvial silts, loess, glacial till Aeolian sands Alluvial and fluvio-glacial sands Alluvial-fan gravels UNCONSOLIDATED (sediments) Mudstones Siltstones Sandstones Chalky CONSOLIDATED (porous rocks)Shales Volcanic tuffs Limestones Calcarenites Igneous/metamorphic formations and older volcanics Recent volcanic lavas Calcretes + karst limestones CONSOLIDATED dense rocks 0.4 0.5 0.6 0.7 0.8 0.9 1.0 20-50m 5-20m <-5m >-50m Alldepths 0.6 0.7 0.8 0.19.0 0.0 0.1 0.2 0.3 0.4 0.5 0.6 0.7 0.8 0.9 1.0 NEGLIGIBLE LOW MODERATE HIGH EXTREME AQUIFER POLLUTION VULNERABILITY DEPTH TO GROUNDWATER TABLE (unconfined) OR STRIKE (confined) OVERLYING STRATA (lithological character and degree of consolidationof vadose zone or confining beds) GROUNDWATER CONFINEMENT Fig. 1 The GOD vulnerability index for various geologic materials (Adapted from Foster et al. 2002) Environ Monit Assess (2015) 187: 156 Page 5 of 18 156
  • 6. Plateau and the Cameroun Volcanic Line and in the southeastern part by the Oban Massif (Fig. 3a). It is characterised by low relief and gently undulating topog- raphy (Eseme et al. 2002) and covers some communities in Abi, Ikom, Obubra, Biase and Yakurr LGA of Cross River State (Figs 3b). Deposition of the Asu River Group (ARG) on the crystalline basement that underlies the IME and parts of the LBT has been reported to have commenced in the Albian time. This deposition marks the first marine incursion into the area. Migmatitic and granitic gneisses and schists with some pegmatitic in- trusions in some locations dominate the basement ma- terials. The gneisses are usually foliated with some pink feldspartic materials and vary from black to white horn- blende. The dominant strike of regional geologic struc- tures is NE–SW although some occasional N–S swings have also been reported (Ekwueme et al. 1995; Eseme et al. 2002). Impervious shales, limestones, sand lenses, sandstone intercalations and ammonites dominate the sediments within the ARG (Odigi and Amajor 2009). Late Albian–Cenomanian thick flaggy impervious cal- careous and non-calcareous black shales; siltstone and sandstones dominated Eze-Aku Group (EAG) overlies the ARG. According to Murat (1972), the sediments of EAG were deposited under marine condition in a tecton- ically controlled basin. The regressive and transgressive cycles of the marine incursion was marked with the de- position of sandstone, other detrital sediments and argilla- ceous materials. Brackish marsh and highly fossiliferous pro-deltaic facies of Late Campanian-Early Maastrichtian Nkporo Shales Formation (NSF) overlie the EAG (Reijers and Nwajide 1998). Deposition of the sediments of the NSF reflects a funnel-shaped shallow marine setting that graded into channelled low-energy marsh. Dense, fine-grained and sometimes dark coloured Tertiary volcanic rocks (e.g. basalts and dolerites) in- trude these Cretaceous lithostratigraphic units in some locations. It has been opined that these post Cretaceous and other low-grade metamorphic activities originated from the adjoining Cameroun Volcanic Province (CVP). Fig. 2 Geological map of Abi LGA (a) showing locations of VES stations and ERT profiles. Insert: Map of Nigeria (b) showing location of Abi LGA 156 Page 6 of 18 Environ Monit Assess (2015) 187: 156
  • 7. These activities resulted in immense alterations in the primary lithological and physical properties (e.g. porosity, resistivity) of the overlying Cretaceous lithostratigraphic units. Thus, the overlying Cretaceous materials are occa- sionally highly baked, domed and seriously deformed in many locations (Benkhelil et al. 1975; Offodile 1975). Tectonic-induced episodes of compressional/ tensional regimes that occurred in Cenomanian and Santonian times caused significant alterations in the sed- imentary rocks such as folding and realigning of the sediments in a predominantly NE–SW direction. These deformations produce multiple folds and fractures paral- lel to the fold axis. These episodic tectonic disturbances led to the formation of the Abakaliki Anticlinorium and the Afikpo Syncline (Onwualu et al. 2012). In many locations, the sandstones in the Eze-Aku Group form ridges that averagely strike at N40o E and dip between 20° and 68° (Egboka and Uma 1986). Materials and methods VES data acquisition and analysis Physical properties (e.g. electrical resistivity, dielectric constant and acoustic impedance) of geologic materials that over- and underlie aquifers are expected to show reasonable contrast such that a carefully organised elec- trical resistivity investigation can be used to map their spatial distribution. From the analysis and interpretation of such data constrained with geologic and lithologic information, the distribution of such materials can be inferred from the discontinuities in the electrical signa- tures (Casas et al. 2008; Gemail et al. 2011). Consequently, an experimental design that centres on electrical resistivity mapping was planned and executed in the study area. Electrical resistivity method is a geophysical explo- ration tool that can be employed in mapping the spatial distribution of resistivity of earth materials from ob- served potential differences induced when electrical current is passed through them via a pair of pointed electrodes (the current electrodes). The resistivity methods adopted in the data acquisition in this study comprise vertical electrical sounding (VES) that was randomly performed in 40 well-distributed stations spread across the entire area and five 2D ERT profiles (Fig. 2a). The VES field procedure was performed using the Schlumberger electrode array. The choice of the Schlumberger array was informed by its suitability for mapping shallow- and deep-seated structures, since electrodes are expanded on logarithmic basis. For the purpose of mapping very shallow resistivity variations, minimum current electrode spacing (AB) was 2 m while in some locations, field constraints such as the undulat- ing topography and settlement pattern restricted maxi- mum current electrode spacing to vary between 500 and 600 m. The corresponding potential electrode spacing varied from 0.5 m for the minimum electrode spacing to 40 m for the maximum electrode spacing. As is typical of the VES procedure performed with the Schlumberger array, the current electrode spacing were increased after Fig. 3 Generalised geological map of Nigeria showing location of study area (A) and (B) digital elevation map of Abi LGA Environ Monit Assess (2015) 187: 156 Page 7 of 18 156
  • 8. each acceptable resistance reading and their correspond- ing potential electrode spacing were increased only when necessary. In all cases, the MN spacing was such that AB/ 2≥5MN/2, so as to validate the potential gradient assump- tion (Keller and Frischknecht 1966; Dobrin and Savit 1988). Contact resistance problems were severe in the dry season in some locations but its effect was minimised by repeated wetting of the electrode positions. The tech- nique of re-designing the data sheet such that all cross over points take on integer multiple of their original values was adopted. This was necessary to aid visual conversion and comparison of acquired data. The converted data at the cross over points were checked to ensure that they satisfy preset repeatability conditions prior to recording otherwise, measurements were repeated. The raw apparent resistance data were transformed to the apparent resistivity domain and smoothened to re- move noisy data where necessary. Manual interpretation procedure that involves the matching of field curves with theoretically prepared curves was performed (Orellana and Mooney 1966; Rijkswaterstaat 1969). Partial curve matching procedure was adopted in gener- ating preliminary layer parameters from the field curve. The starting model of the inversion process consists of the raw VES data and the initial layer parameters generated from the manual procedure. The RESIST modelling code (Vender Velpen 1988) was used in the computer aided inverse modelling phase. In the process of inverting the raw input data, the RESIST code auto- matically computed theoretical data from the prelimi- nary layer parameters generated in the manual interpre- tation phase. A subroutine program within the RESIST code compares the theoretical data with the raw field data, computes and displays the difference between the two sets of data using the root mean square error (RMSE) technique. Borehole lithologic data near the VES points obtained from the Cross River State Rural Water Supply and Sanitation Agency (CRS-RUWATSS A) were used to provide constraints during the inversion process to reduce ambiguities in the interpretation stage. The initial RMSE values were reduced to acceptable values that suit the starting models by performing a couple of iterations. The inverse modelling produced models that best fit the data in a least squares sense using ridge regression (Inman 1975). Typical VES curves obtained after the inverse modelling exercise are shown in Fig. 4. IECs were computed from the observed layer param- eters (thicknesses and resistivities) using Eq. (2) and the results were contoured (Fig. 5a) using SURFER 11 contouring software from Golden Software Inc., USA. In addition, the inverted results of the Schlumberger soundings were combined, gridded using the Kriging method and contoured to generate the resistivity cross- sections (Fig. 6a and b) that closely approximate the shallow lithographic sequence in the area. The choice of the Kriging method was informed by its ability to min- imise the variance of the estimation error (Van Beers and Kleijnen 2003; Jassim and Altaany 2013). ERT data acquisition and analysis Multi-electrode data were acquired along the profiles indicated in Fig. 2a using a SAS 1000 model of ABEM resistivity metre and the ES 10-64 switching unit. The choice of the 2-D ERT technique was informed by the desire to generate a laterally extensive (>100 m) high- resolution subsurface image of the area (Chambers et al. 2011). Such subsurface images were expected to serve as a visual aid to the pattern of resistivity changes within the shallow subsurface. The ERT profiles were posi- tioned along fairly planar ground surfaces in order to reduce effects of topography on the data. The ERT imaging was performed using the Wenner electrode array that is reputed for its capacity to generate data with high signal to noise ratio (Loke et al. 2003). Minimum electrode spacing (a) was 3 m while the maximum was 11 m. Electrical contacts between the ground and the electrodes were carefully checked and it was observed that majority of the electrodes have con- tact resistances that vary between 200 and 300 Ωm. This range of contact resistances have been reported by Wilkinson et al. (2010), to be excellent for proper trans- mission of electrical current into the ground. Water and brine were used to improve contact resistances between the ground and the electrodes where necessary. The reciprocal error (RPE) technique that involves interchange of the current and potential electrode cable was adopted for in situ data quality assessment. The RPE was computed using Eq. (4) with 5 % set as the maximum acceptable value e ¼ 100 ρn−ρrj j ρn þ ρr ð4Þ The RPE was observed to be less than 5 % in many locations but where occasional swings were observed, measurements were repeated. 156 Page 8 of 18 Environ Monit Assess (2015) 187: 156
  • 9. The ERT data were further filtered and the RES2DINV software (Loke and Barker 1996; Loke et al. 2003) was used to model the data. The RES2DINV software is equipped with codes that enable Fig. 4 Model VES curves observed at a Egboronyi, b Adadama 1, c Agbara and d Ilike Communities. Insert: Correlation of borehole lithologs with inverted VES results Fig. 5 Observed vulnerability maps generated from a IEC and b GOD techniques Environ Monit Assess (2015) 187: 156 Page 9 of 18 156
  • 10. the computer to execute finite difference modelling and non-linear smoothness-constrained least-squares opti- mization procedures. Thus, the software can calculate apparent resistivity and the resistivity values of the model blocks respectively (de Groot-Hedlin and Constable 1990). In the process of executing the sub- routine commands, the RES2DINV subdivides the sub- surface into rectangular grids that are equal in number to the number of data points and iteratively adjusts the resistivity model of each block by minimising the dif- ference between the observed and the calculated resis- tivity values. It eventually transforms the measured ERT data into an approximate picture of the true subsurface resistivity distribution and geometry (Olayinka and Yaramanci 2000). This procedure is known to produce smooth variations in subsurface resistivity distribution with depth (Loke et al. 2003) especially in areas with geologic constraints. The RMSE technique was also adopted in quantifying the difference between the theo- retical and the observed data sets, which was iteratively minimised until a satisfactory fit was obtained. Samples of the ERT-derived subsurface images are shown in Fig. 7. The GOD data acquisition Relevant information on the nature and spatial distribution of the confining materials in the area were sourced from the geologic map of Abi LGA (Fig. 2a). Results obtained from the 1D and 2D modelling of resistivity data were used in assessing the vertical continuity of the various lithologic units. After ascertaining the confining conditions of the aquifers in the entire area using geophysical and geological information, numerical values that vary be- tween 0.2 and 0.4 were assigned to the G parameter. Generally, low values were assigned to G because imper- vious materials that range from consolidated materials such as shalestones, siltstones sandstones and claystones to thick argillaceous materials such as clays, shales and silts overlie over 85 % of the entire area. The lineament map of the area (Fig. 8) was used to provide constraints on the Fig. 6 Resistivity cross-sections generated along profiles a A–A′ and b B–B′ 156 Page 10 of 18 Environ Monit Assess (2015) 187: 156
  • 11. numerical values assigned to G. Where lineaments were observed, a value of 5 was assigned to the G parameter. Impervious arenaceous sandstones, argillites and their deformed counterparts dominate the geology. Therefore, the indices for the O parameter were made to vary be- tween 0.4 and 0.7. Static water level (SWL) observations from 40 boreholes in the area were used in selecting values of the D parameter. The SWL data were observed to vary between 2 m in Adadama Community and ~17 m at Igoni-Igoni Community. Locations with SWLs below 5 m were assigned D index value of 0.9 while locations where SWL variations were observed to vary between 5 and 20 m were assigned D index of 0.8 in accordance with the classification of Foster et al. (2002) (Fig. 1). The GOD indices were averaged, gridded and contoured on Abi map (Fig. 5b) in order to assess its spatial variation. The two maps (IEC and GOD) are shown in Fig. 5. Results and discussions The inferred shallow surface electrostratigraphy and layer parameters (Table 1) generated from the inversion process were in good agreement with available borehole lithologic logs closest to some of the VES stations (Fig. 4). Litho- and hydro-resistivity cross-sections The two VES-derived resistivity cross-sections (Fig. 6a, b) capture the shallow subsurface of the area as being dominated by thickly bedded argillaceous and arenaceous materials that are characterised by low resis- tivity (ρ<150 Ωm) value. The argillites are usually capped by some more resistive (ρ>700 Ωm) sandstone materials with variable thicknesses. The sandstone Fig. 7 Representative subsurface images generated using the ERT technique Environ Monit Assess (2015) 187: 156 Page 11 of 18 156
  • 12. materials are exposed extensively in many communities in the area. In the north–south profile (Fig. 6a), the sandstone materials are characterised by high resistivi- ties (ρ>1,000 Ωm) and thicknesses that do reach 5 m in some locations. These materials are underlain by thickly bedded argillites whose vertical continuity is occasion- ally truncated by some more resistive sandy materials (ρ>100 Ωm). These sandy materials are characterised by variable thicknesses and are saturated with site- dependent discharge rate. According to Akpan et al. (2013) and Petters (1989), this sandy horizon has low– high groundwater yield and is the dominant source of potable water in the area. The overlying sandstones and the adjoining clayey materials form the protective cap that seals the interbedded sandy materials from surface contaminants. The overlying sandstones and argilla- ceous materials and the underlying argillaceous mate- rials also serve as the confining units for the aquifers. The level of aquifer confinement is site dependent due to the abundance of subsurface structural discontinuities such as fractures (Fig. 6a) appearing to exert significant influence on them. These structural discontinuities (e.g. fractures and joints) serve as preferential pathways for contaminant transport. The thickness of the interbedded sandy aquifers varies with spatial location and its resistivity values seem to depend on the extent of saturation, composition of the saturating fluid andlithological composition. Near the surface where the sandy materials are fairly sorted and the pores are air filled, resistivity values were high (ρ>700 Ωm) compared to the sandy materials at deeper depths where the pores are water filled. Underlying the sandy materials are sets of moderately resistive argilla- ceous materials with vertical continuity that extends beyond 70 m. Thus, the sandy aquifers exist in a ful- ly–partially confined state though at shallow depth. In the NE–SW oriented AA′ resistivity profile that runs through the NSF (Fig. 6b), high resistivity (ρ> 1,000 Ωm) arenaceous materials with south-west in- creasing thickness, cap the entire lithostratigraphic se- quence. From the beginning of the profile to ~8 km, the sandstone materials are ~1 m in vertical extent while their thickness increased to ~15 m in the other part of the profile. Moderately consolidated argillaceous materials (ρ<200 Ωm) with variable thicknesses directly underlie the sandstone materials. From the northeastern section up to ~5 km along the profile, argillaceous materials dominate the entire lithostratigraphic sequence. Fig. 8 Lineament map of Abi, Nigeria 156 Page 12 of 18 Environ Monit Assess (2015) 187: 156
  • 13. Table 1 Summary of layer parameters generated from the inversion of VES data S/no. Location coordinates Layer resistivity (Ω. m) Estimated depth to bottom (m) Longitude (°) Latitude (°) VES Points ρ1 ρ2 ρ3 ρ4 ρ5 h1 h2 h3 h4 1 8.0975 5.9407 VES1 261.3 15.8 6.9 52.8 466.1 0.7 4.3 22.4 20.0 2 8.0837 5.9346 VES2 176.2 54.9 20.8 115.6 – 1.4 3.9 30.6 – 3 8.0897 5.9370 VES3 546.1 53.8 73.8 160.5 – 1.3 15.3 29.2 – 4 8.0848 5.9312 VES4 149.3 18.5 23.7 2.2 35.9 1.4 5.3 10.3 21.0 5 8.0999 5.9249 VES5 232.0 1,186.0 1,444.8 263.0 329.5 1.4 3.9 33.0 16.0 6 8.0968 5.9293 VES6 1,583.0 252.7 896.9 135.8 147.2 2.9 4.4 9.7 62.9 7 8.0827 5.9304 VES7 519.5 101.2 44.8 58.5 – 1.4 4.7 32.7 – 8 8.0828 5.9286 VES8 1,425.8 27.9 10.2 246.4 – 1.0 1.8 18.7 – 9 8.0319 5.9069. VES9 490.0 112.2 27.3 17.5 – 2.0 4.5 33.4 – 10 8.0384 5.9115 VES10 148.4 265.5 19.4 60.5 – 1.2 1.6 60.0 – 11 8.0124 5.9963 VES11 2,262.9 55.9 12.3 21.5 88.2 1.0 0.9 61.0 10.8 12 8.0211 5.9938 VES12 762.1 79.8 286.0 62.7 178.2 1.6 4.9 14.0 16.2 13 8.0268 5.9947 VES13 33.8 59.8 405.1 30.4 122.7 3.0 1.2 7.7 35.2 14 8.0453 5.9920 VES14 448.6 100.3 68.9 56.5 155.3 1.1 2.2 11.8 13.9 15 8.0159 5.9907 VES15 209.5 25.6 97.6 – – 2.1 14.9 – – 16 8.0198 5.9276 VES16 370.7 1,881.2 419.3 60.2 88.1 0.7 2.7 18.7 33.3 17 8.0368 5.9453 VES17 313.0 121.8 17.1 86.3 267.0 1.6 5.5 21.3 14.4 18 8.0470 5.9021 VES18 1,277.0 303.8 98.5 271.5 562.0 1.1 6.7 14.8 19.8 19 8.0356 5.8697 VES19 289.4 85.6 15.9 98.8 – 1.4 6.1 39.0 – 20 8.0286 5.8631 VES20 654.0 27.9 10.6 72.2 – 1.3 2.6 31.0 – 21 8.0119 5.8367 VES21 447.3 858.6 120.6 745.9 60.4 1.5 1.9 5.5 16.3 22 7.9654 5.8476 VES22 249.3 66.2 11.4 25.6 – 0.9 19.3 61.3 – 23 7.9646 5.8496 VES23 346.6 76.6 415.5 13.5 – 1.8 2.8 6.7 – 24 7.9939 5.8838 VES24 500.5 3,886.4 602.7 804.4 – 1.2 23.6 51.3 – 25 8.0025 5.8765 VES25 4,567.8 9,404.1 1,690.2 338.2 458.4 1.3 2.6 24.1 36.1 26 8.0035 5.8791 VES2626 408.6 9,520.9 843.4 155.5 521.1 0.6 1.9 22.0 23.7 27 8.1598 5.9400 VES27 129.0 38.2 13.6 24.0 – 2.4 5.7 24.0 – 28 8.1603 5.9429 VES28 155.2 66.2 16.2 50.0 – 1.3 6.1 32.8 – 29 8.1609 5.9443 VES29 350.7 384.6 73.2 21.4 – 5.8 4.8 16.3 – 30 8.1459 5.9370 VES30 1,071.1 15,164.2 2,207.9 55.2 88.6 0.4 1.3 12.9 28.0 31 8.1167 5.9362 VES31 94.1 359.2 771.9 164.0 – 1.3 8.0 31.5 – 32 8.1194 5.9339 VES32 3,481.9 23,137.2 541.5 165.8 – 1.0 3.0 29.4 – 33 8.1148 5.9338 VES33 507.7 3, 409.5 111.6 359.5 13.2 0.6 1.7 14.3 11.6 34 8.1128 5.9321 VES34 545.3 203.8 380.0 90.3 – 2.8 4.5 41.9 – 35 8.1486 5.9575 VES35 244.1 9.6 35.1 4.4 29.6 1.4 4.9 5.8 9.6 36 8.0810 5.9405 VES36 1,318.6 309.0 17.7 32.8 99.3 2.0 4.1 8.7 8.5 37 8.0958 5.9539 VES37 207.1 17.7 52.3 11.8 54.0 1.6 9.8 14.5 30.2 38 7.9694 5.8194 VES38 2,474.5 8, 623.6 363.6 428.7 – 1.2 7.2 43.4 – 39 7.9568 5.8260 VES39 654.0 27.9 10.6 72.2 – 1.3 2.6 31.0 – 40 7.9702 5.8047 VES40 2,832.2 1, 124.5 183.0 879.1 – 0.6 6.5 15.3 – Environ Monit Assess (2015) 187: 156 Page 13 of 18 156
  • 14. However, from ~5 km to the end of the profile, moderate resistivity (ρ<600 Ωm) sandstone materials were ob- served to intercalate with the argillaceous materials. These intercalating sandy materials are saturated at shal- low depth range of ~20 to 55 m. Thus, the shallow aquifers exist under partially to fully confined conditions. Three representative ERT images of the area are shown in Fig 7. The shallow subsurface image of ERT 1 located in the NSF shows moderately resistive sandy materials (ρ>100 Ωm) with nearly uniform thickness (~3 m) which cap the lithostratigraphic sequence. These overlying arenaceous materials lie almost horizontal to the underlying argillaceous materials. Low–moderate resistivity (ρ<100 Ωm) argillaceous materials that dom- inate the shallow subsurface image underlie the sand- stones materials. These shaly materials extend beyond 15 m. The low resistivity (ρ<10 Ωm) associated with these materials seem to be indicative of an area where wastewater from cassava processing mills accumulates. The subsurface image from ERT 2 (Fig. 7) that was also stationed in the NSF show that, low resistivity (ρ< 50 Ωm) nearly parallel argillaceous materials overlie the lithostratigraphic sequence. The clayey materials are ~5 m in thickness from the beginning up to ~40 m along the profile. From ~40 m point, thickness of the argilla- ceous materials increases to~12 m. Relatively high resistivity (ρ>75 Ωm) arenaceous materials underlie the clayey materials and dominate the entire image beyond 17 m. These results show that the aquifers are moderately protected since thin impermeable argilla- ceous and consolidated arenaceous materials overlie them. ERT 2 correlates strongly with results of VES 17 and the lithologic log of a close borehole (Fig. 7). ERT 3 (Fig. 7) that was positioned in the EAG shows that high resistivity (ρ>1,000 Ωm) arenaceous materials that are in direct contact with some conducting clayey materials dominate the subsurface from ~27 m to the end of the profile. These arenaceous materials dip gently eastward and are over 10 m thick in some locations. Moderately resistive sandy–clay (ρ<800 Ωm) are dom- inant from the beginning of the profile up to 27 m. The high resistivity values suggest that the sandy–clay exist in a highly deformed state. Aquifer protection based on IEC and GOD indices The aquifers in the study area, which are major source of potable water for the people, are shallow (≤50 m) and therefore the level of protection offered by the vadose zone materials need to be established quantitatively. The spatial distribution of IEC values and GOD indices in the area are shown in Fig. 5 a, b. Observed values of the IEC and the GOD indices were compared (Table 2) and the IEC showed better representation and correlates with geology. The resistivity cross-sections (Fig. 6) were also used to assess the thickness of the vadose zone in the area. IEC values range from <0.1 S for the weakly protected aquifers to >2.0 S for strongly protected aqui- fers. The pattern of IEC variation in the area is unsys- tematic because it appears to be independent of factors such as properties of the soil, net recharge and charac- teristics of the unsaturated layer (Casas et al. 2008) that are known to influence IECs. Rather, IEC values show strong dependence on depth to the aquifer, which in turn depends on the paleotectonic disturbances in the area (Onwualu et al. 2012). These paleotectonic activities seem to be a dominant factor that dictates the behaviour of many geological structures in the area including the dominant course of the Cross River. In some communi- ties, e.g. Usumutong and Ebom in the southeastern region, Itigidi at the centre, Ekureku in the northern part, Adadama and Igbo Imabana in the northeastern part (Figs. 2a, 3b and 8) where fractured materials overlie the aquifer horizon (Ebong et al. 2014), the aquifers were observed to be weakly-fairly protected with IEC values varying between 0.1 and ~0.4 S. The GOD indices vary from <0.30 in the lowly vulnerable areas to 0.65 in the highly vulnerable areas. The values of the GOD indices show that the aquifers in Abi have moderate-high vulnerability to contamination. This observation corroborates with the IEC results (Table 2). Although laterally extensive impermeable materials overlie aquifers in Abi, the lack of reasonable thickness for proper contaminant attenuation by natural process in many locations and fracturing of the overly- ing consolidated materials (Fig. 8) can provide prefer- ential pathways through which contaminants get to the aquifers. In some isolated areas where the vadose zone materials are reasonably thick, the vertical flow of Table 2 General vulnerability and protective capacity classes IEC (S) Protective capacity GOD Vulnerability rating >2.0 Strong <0.3 Low 1.1–2.0 Moderate 0.3–0.5 Moderate 0.1–1.0 Fair 0.5–0.7 High <0.1 Weak >0.7 Extreme 156 Page 14 of 18 Environ Monit Assess (2015) 187: 156
  • 15. contaminants can be impeded by mechanical, physico- chemical, microbiological and other natural processes. These areas are located on topographic highs (Fig. 3b) that incidentally correspond to regions of groundwater recharge. Here, surficial contaminants and water migrate into deeper layers through fractures (Akpan et al. 2013). These fractures are characterised by large pore spaces that naturally lacks the capacity to attenuate contami- nants (Ebong et al. 2014). Most of the communities where these weakly protected aquifers abound are loca- tions where the farmers also practice yield enhancement farming methods. Thus, with the high elevations and steepness of slope, topographically induced flow gradi- ent will drive surface water that are contaminated with fertilizer, pesticides or other contaminants downhill into the low lying areas (Akpan et al. 2013) thereby reducing the rate at which contaminants infiltrate into the aquifer horizon. However, during such downhill flows, the ten- dency of the contaminated water to be driven into the aquifer horizon via fractures and joints is certain al- though at low rates and so can be neglected.Aquifer protection based on the IEC in other communities varies from 1.1 to ~2.6 S depicting a group of moderate to strongly protected aquifers. These groups of aquifers are dominant in the northern, southern, southeastern, south- western and central parts of the study area (Fig. 5a) where the EAG and NSF are dominant. Within these geologic formations, the aquifers consist of sandy/ gravelly materials that are overlain by thick imperme- able clayey/shaly materials and their metamorphosed varieties. The impermeable and thick clay overburden materials which are charaterised by low hydraulic con- ductances serve as natural filters to any percolating fluid (Sharma and Baranwal 2005; Yadav and Singh 2007; Ebong et al. 2014). These materials reduce the rate of movement of the fluid through them hence, increasing their residence time and offering better protection to the underlying aquifers. Suggested management practices Potential management practices for sustaining the aqui- fers are as follows; 1. Faecal and total coliforms are human borne contam- inant. Their menace can be minimised by the adop- tion of good sanitary practices. Therefore, massive education and reorientation on sanitary habits will be the most powerful tool needed to curb its menace. 2. If inorganic chemical fertilizers especially those enriched with nitrogenous compounds must be ap- plied to the soils, the quantity, type and the time of application must be carefully managed. This ap- proach is the most practical, most acceptable and standard practice in minimising groundwater con- tamination resulting from the application of fertil- izers, thereby sustaining groundwater quality within such areas. The number of times that nitrogenous fertilizers must be applied to the farm per season must be properly regulated (Yadav and Wall 1998). 3. Other less harmful sources of soil nitrogen includ- ing the use of organic substances to improve soil fertility and consequently, crop yield should be con- sidered (Waskom 1994). 4. The period of application of inorganic fertilizers must be carefully planned so that it does not coin- cide with the peak period of leaching, which in the area will coincide with the peak period of rainfall of June and July. Thus, fertilizer application must be done at the period of maximum crop uptake. 5. The current practice of shifting cultivation, which is the dominant system of farming, should be sustained in spite of its short coming. This method has the capacity of restoring lost soil fertility natu- rally before the next cultivation period. 6. Industrialists should be encouraged to embrace en- vironmental friendly methods of waste management such as waste recycling in order to reduce their impacts on the environment. Conclusion This study was embarked upon to quantitatively rate the level of protection that will be of advantage or otherwise to the fractured shales/sandy aquifers, which are the major sources of potable water for the people in Abi- Nigeria. Abi area was selected because it is an area where inorganic wastes resulting from soil productivity enhancement techniques and micro-industrial activities are prevalent. The geophysical data used were the elec- trical resistivity data generated from forty VES and five 100 m long 2-D ERT profiles. The geological data used include the generalised geological, borehole lithologic and tectonic information of the area. Both manual and computer modelling techniques were adopted in converting the measured field data to their geologic Environ Monit Assess (2015) 187: 156 Page 15 of 18 156
  • 16. equivalents using borehole lithologic data as constraints. Interpreted layer resistivities and thicknesses were used in computing the geophysical protective index (or IEC) for lithologies that overlie the aquifers. Results show that the composition of the aquifer horizon varies from fractured shales –fractured sand- stones to sandy/gravelly materials in the EAG and NSF dominated areas. The aquifers exist under partially confined to fully confined conditions. The composition of the overlying materials varies from argillaceous ma- terials in the EAG and NSF dominated areas to consol- idated sandstones and shalestone materials. Thus, the protection capacity offered by the overlying materials to the aquifer varies from weak to strong depending on the composition of the overlying materials that in many cases, depends on the paleo-tectonic events of the area. The weakly–fairly protected aquifers with IEC values varying from 0.1 to ~0.4 S were dominant in locations where fractured shales and other detrital materials domi- nate the aquifer horizons. Impermeable consolidated sandstones and/or shalestone materials overlie such aqui- fers at very shallow depths. Most of the communities where these aquifers abound are located on the elevated parts of the study area. The overlying impermeable ma- terials will reduce the rate of infiltration of contaminated surface water and consequently increase their residence time, thereby, strengthening surface runoff downhill. The moderate–strongly protected aquifers are the sandy/gravelly dominated aquifers in the EAG and NSF areas characterised by IEC values that range between 1.1 and 2.6 S. The EAG and the NSF occupy the low lying parts of the study area and aquifers are deeply buried at depths below 40 m. Impermeable argillaceous materials dominate the protective layers. Although locations where these aquifers abound are areas where various forms of farming practices including crop rotation that encourages the use of artificial soil fertility enhancers is being prac- ticed. The overlying clayey materials are thick enough to naturally attenuate the contaminants and allow only good quality water to get to the aquifer horizon. Finally, vul- nerability mapping based on IEC and GOD techniques are cost effective and efficient techniques for exploratory assessment of aquifer protection and management as these two are suited for regional investigations. Acknowledgments The authors are grateful to the University of Calabar, Calabar-Nigeria that provided the resources, which the authors used in conducting the research. The contributions and suggestions from the anonymous reviewers are gratefully acknowledged. References Akpan, A. E., Ugbaja, A. N., & George, N. J. (2013). Integrated geophysical, geochemical and hydrogeological investigation of shallow groundwater resources in parts of the Ikom- Mamfe Embayment and the adjoining areas in Cross River State, Nigeria. Journal of Environmental Earth Sciences, 70, 1435–1456. Aller, L, Bennet, T, Lehr, J.H., Petty, R.J., & Hackett, G. (1987). DRASTIC: a standardized system for evaluating ground water pollution potential using hydrogeologic settings. US EPA, 600/2-87–035. Almasri, M. N. (2008). Assessment of intrinsic vulnerability to contamination for Gaza coastal aquifer, Palestine. Journal of Environmental Management, 88, 577–593. Benkhelil, M. G., Ponsard, J. F., & Saugy, L. (1975). The Bornu- Benue Trough, the Niger Delta and its Offshore: Tectono- sedimentary reconstruction during the Cretaceous and Tertiary from geophysical data and geology. In C. A. Kogbe (Ed.), Geology of Nigeria (pp. 277–309). Lagos: Elizabethan Press. Braga, A. C., Filho, W. M., & Dourado, J. C. (2006). Resistivity (DC) method applied to aquifer protection studies. Revista Brasileira de Geofisica, 24(4), 573–581. Casas, A., Himi, M., Diaz, Y., Pinto, V., Font, X., & Tapias, J. C. (2008). Assessing aquifer vulnerability to pollutants by elec- trical resistivity tomography (ERT) at a nitrate vulnerable zone in NE Spain. Environmental Geology, 54, 515–520. Chambers, J. E., Wilkinson, P. B., Kuras, O., Ford, J. R., Gunn, D. A., Meldrum, P. I., Pennington, C. V. L., Weller, A. L., Hobbs, P. R. N., & Ogilvy, R. D. (2011). Three- dimensional geophysical anatomy of an active landslide in Lias Group mudrocks, Cleveland basin, UK. Geomorphology, 125(4), 472–484. Civita, M., & De Maio, M. (1997). SINTACS Un sistema parametricoper la valutazione e la cartografia per la valutazione della vulnerabilit’a degli acquiferi all’inquinamento, Metodologia e automazione. Bologna: Pitagora Ed. 191. Conrad, J., Hughes, S. & Weaver, J. (2002). Map production. In Zaporozec, A. (Ed.), Groundwater contamination inventory: a methodological guide (pp. 75-98). International Hydrological Programme-VI, No. 2, UNESCO. de Groot-Hedlin, C., & Constable, S. (1990). Occam’s inversion to generate smooth, two dimensional models from magnetotelluric data. Geophysics, 55, 1613–1624. Dobrin, M. B., & Savit, C. H. (1988). Introduction to geophysical prospecting (4th ed.). New York: McGraw-Hill Book Company. Draoui, M., Vias, J., Andreo, B., Targuist, K., & Stitou el MessarI, J. (2007). A comparative study of four vulnerability mapping methods in a detritic aquifer under Mediterranean climatic conditions. Environmental Geology, 54, 455–463. Ducci, D., & Sellerino, M. (2012). Vulnerability mapping of groundwater contamination based on 3D lithostratigraphical models of porous aquifers. Journal of Science of the Total Environment, 447, 315–322. Ebong, E. D. (2014). Hydrogeophysical and Physco-chemical investigation of the Presbyterian Primary School Ekureku Be Water borehole, Ekureku, Abi Local Government Area, 156 Page 16 of 18 Environ Monit Assess (2015) 187: 156
  • 17. Cross River State. Unpublished Technical Report submitted to Cross River State Community Development and Water Supply Agency. Ebong, E. D., Akpan, A. E., & Onwuegbuche, A. A. (2014). Estimation of geohydraulic parameters from fractured shales and sandstone aquifers of Abi (Nigeria) using electrical re- sistivity and hydrogeologic measurements. Journal of African Earth Sciences, 96, 99–109. Edet, A. E. (2014). An aquifer vulnerability assessment of the Benin Formation aquifer, Calabar, southeastern Nigeria, using DRASTIC and GIS approach. Journal of Environmental Earth Sciences, 71(4), 1747–1765. Edet, A. E., & Okereke, C. S. (2002). Delineation of shallow groundwater aquifers in the Coastal Plain Sands area (Southern Nigeria) using surface resistivity and hydrogeological data. Journal of African Earth Sciences, 35, 433–443. Egboka, B. C. E., & Okpoko, E. I. (1984). Gully erosion in the Agulu-Nanka region of Anambra State, Nigeria. Changes in African Hydrology and Water Resources (Proceedings of the Harare Symposium, July 1984). IAHS Publication No 144. Egboka, B. C., & Uma, K. O. (1986). Hydrogeochemistry, con- taminant transport and Tectonic effects in the Okposi-Uburu salt lake area of Imo state, Nigeria. Hydrological Science Journal, 31(2), 205–221. Ekwueme, B. N., Nyong, E. E., & Petters, S. W. (1995). Geological excursion guide book to Oban Massif. Southeastern Nigeria: Calabar Flank and Mamfe Embayment. Eseme, E., Agyingi, C. M., & Foba-Tendo, J. (2002). Geochemistry and genesis of brine emanations from Cretaceous strata of the Mamfe Basin, Cameroon. Journal of African Earth Sciences, 35, 467–476. Ezzy, T. R., Cox, M., O’Rourke, A. J., & Huftile, G. (2006). Groundwater flow modeling within a coastal alluvial plain setting using a high-resolution hydrofacies approach: Bells Creek plain, Australia. Hydrogeology Journal, 14, 675–688. Foster, S. (1987). Fundamental concepts in aquifer vulnerability, pollution risk and protection strategy. In W. Van Duijvenbooden & H. G. Van-Waegeningh (Eds.), Vulnerability of soil and groundwater to pollutants (pp. 69– 86). The Hague: Hydrological Research. Foster, S. S. D., Hirata, R., Gomes, D., D'Elia, M., & Paris, M. (2002). Groundwater quality protection: a guide for water utilities, municipal authorities and environment agencies (secondth ed.). Washington, DC: World Bank. Fraga, C. M., Fernandes, L. F. S., Pacheco, F. A. L., Reis, C., & Moura, J. P. (2013). Exploratory assessment of groundwater vulnerability to pollution in the Sordo River Basin, Northeast of Portugal. REM: R. Esc. Minas, Ouro Preto, 66(1), 49–58. Freeze, R. A., & Cherry, J. A. (1979). Groundwater. Englewood Cliffs. New Jersey: Prentice-Hall Inc. 604 p. Gemail, K. S., El-Shishtawy, A. M., El-Alfy, M., Ghoneim, M. F., & Abd El-Bary, M. (2011). Assessment of aquifer vulnera- bility to industrial waste water using resistivity measure- ments. A case study along El-Gharbyia main drain, Nile Delta, Egypt. Journal of Applied Geophysics, 75, 140–150. Gogu, R. C., & Dassargues, A. (2000). Current trends and future challenges in groundwater vulnerability assessment using overlay and index methods. Environmental Geology, 39, 549–559. Henriet, J. P. (1976). Direct applications of the Dar Zarrouk parameters in ground water surveys. Geophysical Prospecting, 24, 344–353. Jassim, F. A., & Altaany, F. A. (2013). Image interpolation using Kriging technique for spatial data. Canadian Journal on Image Processing and Computer Vision, 4(2), 16–21. Javadi, S., Kavehkar, N., Mousavizadeh, M. H., & Mohammadi, K. (2011). Modification of DRASTIC model to map ground- water vulnerability to pollution using nitrate measurements in agricultural areas. Journal of Agricultural Science and Technology, 13(2), 239–249. Keller, G. V., & Frischknecht, F. C. (1966). Electrical methods in geophysical prospecting. Oxford: Pergamon Press. 519 p. Kirsch, R., Sengpiel, K., & Voss, W. (2003). The use of electrical conductivity mapping in the definition of an aquifer vulner- ability index. Near Surface Geophysics, 1, 3–20. Kirsch, R. (2006). Groundwater geophysics: a tool for hydrogeol- ogy. Springer-Verlag Berlin Hendelberg. 493p. Leone, A., Ripa, M. N., Uricchio, V., Dek, L., & Vargay, Z. (2009). Vulnerability and risk evaluation of agricultural nitrogen pollution for Hungary’s main aquifer using DRASTIC and GLEAMS models. Journal of Environmental Management, 90(10), 2969–2978. Loke, M. H., & Barker, R. D. (1996). Practical techniques for rapid least-squares inversion of apparent resistivity pseudosections using a quasi-Newton method. Geophysical Prospecting, 44, 131–152. Loke, M. H., Acworth, I., & Dahlin, T. (2003). A comparison of smooth and blocky inversion methods in 2D electrical imag- ing surveys. Exploration Geophysics, 34, 182–187. Maillet, R. (1947). The fundamental equations of electric prospecting. Geophysics 12, 529–556. Mhomho Technologies & Environmental Services Ltd (2013). Drilling, construction of a one unit motorised water supply borehole and water quality analyses in Agbara-Ekureku. A Technical Report No. 123, pp. 23. Murat, R. C. (1972). Stratigraphy and Paleogeography of the cretaceous and lower tertiary in southern Nigeria. In T. F. J. Dessauvagie & A. J. Whiteman (Eds.), African geology (pp. 251–266). Ibadan: Univ. Press, Ibadan. Neshat, A., Pradhan, B., Pirasteh, S., & Shafri, H. Z. M. (2013). Estimating groundwater vulnerability to pollution using a modified DRASTIC model in the Kerman agricultural area, Iran. Environmental Earth Sciences. doi:10.1007/s12665- 013-2690-7. Niwas, S., & Singhal, D. C. (1981). Estimation of aquifer trans- missivity from Dar Zarrouck parameters in porous media. Journal of Hydrology, 50, 393–399. Odigi, M. I., & Amajor, L. C. (2009). Geochemical characteriza- tion of Cretaceous sandstones from the Southern Benue Trough, Nigeria. Chinese Journal of Geochemistry, 28, 044–054. Offodile, M. E. (1975). A review of the geology and Cretaceous of the Benue Valley. In C. A. Kogbe (Ed.), Geology of Nigeria (pp. 375–376). Lagos: Elizabethen Press. Okereke, C. S., Esu, E. O., & Edet, A. E. (1998). Determination of potential groundwater sites using geological and geophysical techniques in the Cross River State, southeastern Nigeria. Journal of African Earth Sciences, 27(1), 149–163. Okiongbo, K. S., & Akpofure, E. (2012). Determination of aquifer properties and groundwater vulnerability mapping using Environ Monit Assess (2015) 187: 156 Page 17 of 18 156
  • 18. geoelectric method in Yenagoa City and its environs in Bayelsa State, South South Nigeria. Journal of Water Resource and Protection, 4, 354–362. Olayinka, A. I., & Yaramanci, U. (2000). Assessment of the reliability of 2D inversion of apparent resistivity data. Geophysical Prospecting, 48(2), 293–316. Onwualu, J. N., Ukaegbu, V. U., & Okengwu, K. O. (2012). Source region inhomogeneity in igneous suite of Ishiagu, Southern Benue Trough, Nigeria. Archives of Applied Science Research, 4(2), 923–934. Orellana, E., & Mooney, A. M. (1966). Master curve and tables for vertical electrical sounding over layered structures. Escuela, Spain: Interciencia. Perles Roselló, M. J., Vías Martínez, J. M., & Andreo Navarro, B. (2009). Vulnerability of human environment to risk: case of groundwater contamination risk. Environment International, 3, 325–335. Petters, S. W. (1989). A regional hydrogeological study of rural water supply options for planning and implementation of phase II rural water programme in Cross River State. Unpublished Technical Report submitted to DFFRI, Cross River State, pp 97. Raju, N. J., & Reddy, T. V. K. (1998). Fracture pattern and electrical resistivity studies for groundwater exploration. Environmental Geology, 34(2–3), 175–182. Reijers, T. J. A., & Nwajide, C. S., (1998). Geology of the Southern Anambra Basin. Unpublished Report for Chevron Nigeria Limited, Anambra Basin Field Course, p. 66. Rijkswaterstaat, (1969). Standard Graphs for Resistivity Prospecting, European Association of Exploration Geophysicists, The Netherlands, The Hague. Sharma, S. P., & Baranwal, V. C. (2005). Delineation of groundwater-bearing fracture zones in a hard rock integrating very low frequency electromagnetic and resistivity data. Journal of Applied Geophysics, 57, 155–166. Sinkevich, M. G., Walter, M. T., Lembo, A. J., Jr., Richards, B. K., Peranginangin, N., Aburime, S. A., & Steenhuis, T. S. (2005). A GIS-based ground water contamination risk as- sessment tool for pesticides. Ground Water Monitoring & Remediation, 25(4), 82–91. Sorensen, K. I., Auken, E., Christensen, N., & Pellerin, L. (2005). An integrated approach for hydrogeophysical investigations: new technologies and a case history. In D. K. Bulter (Ed.), Near-surface Geophysics (pp. 585–597). Tulsa: Society of Exploration Geophysicists. Ukaegbu, V. U., & Akpabio, I. O. (2009). Geology and stratigra- phy of middle cretaceous sequences Northeast of Afikpo Basin, Lower Benue Trough, Nigeria. Pacific Journal of Science and Technology, 103, 518–256. Van Beers, W. C. M., & Kleijnen, J. P. C. (2003). Kriging for interpolation in random simulation. Journal of Operational Research Society, 54, 255–262. Van Stempvoort, D., Ewert, L., & Wassenaar, L. A. (1992). A method for groundwater protection mapping in the Prairie Provinces of Canada, Canada, PPWB Report No. 114. Saskatoon: National Hydreogeology Research Institute. Vender Velpen, B. P. A. (1988). A computer processing package for D.C. Resistivity interpretation for an IBM compatibles, ITC JouR, Natherlands Vol-4. Vrba, J., & Zaporozec, A. (1994). Guidebook on mapping ground- water vulnerability. Verlag Heinz Heise, Hannover, Germany, International contributions to hydrogeology, 16, p 131. Waskom, R. M. (1994). Best management practices for nitrogen fertilization. Bulletin #XCM-172, University Cooperative Extension, Colorado State University. Wilkinson, P. B., Meldrum, P. I., Kuras, O., Chambers, J. E., Holyoake, S. J., & Ogilvy, R. D. (2010). High-resolution electrical resistivity tomography monitoring of a tracer test in a confined aquifer. Journal of Applied Geophysics, 70, 268–276. Yadav, G. S., & Singh, S. K. (2007). Integrated resistivity surveys for delineation of fractures for ground water exploration in hard rock areas. Journal of Applied Geophysics, 62(3), 301– 312. Yadav, S. N., & Wall, D. B. (1998). Benefit-cost analysis of best management practices implemented to control nitrate con- tamination of groundwater. Water Resources Research, 34(3), 497–504. Yin, L., Zhang, E., Wang, X., Wenninger, J., Dong, J., Guo, L., & Huang, J. (2012). A GIS-based DRASTIC model for assessing groundwater vulnerability in the Ordos Plateau, China. Environmental Earth Sciences, 69(1), 171–185. 156 Page 18 of 18 Environ Monit Assess (2015) 187: 156